- drach09's home page
- Posts
- 2022
- 2020
- June (1)
- 2019
- 2018
- 2017
- 2016
- 2015
- 2014
- December (13)
- November (2)
- October (5)
- September (2)
- August (8)
- July (9)
- June (7)
- May (5)
- April (4)
- March (4)
- February (1)
- January (2)
- 2013
- December (2)
- November (8)
- October (5)
- September (12)
- August (5)
- July (2)
- June (3)
- May (4)
- April (8)
- March (10)
- February (9)
- January (11)
- 2012
- 2011
- October (1)
- My blog
- Post new blog entry
- All blogs
Run-11 Transverse Jets: Updated Polarization Correction (Sivers)
Previous blog posts on the polarization correction did not properly apply the polarizations for blue beam and yellow beam. This post updates the polarization correction for the Sivers asymmetries.
Polarization-corrected Asymmetries
Figure 1
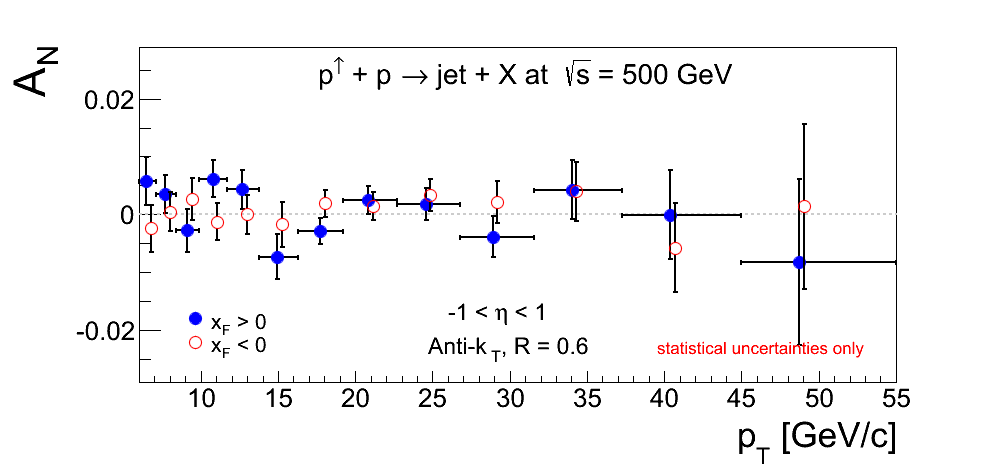
Figure 1 shows the Sivers asymmetries summed over all triggers and from -1 < η < 1 and 6 < pT < 55 GeV/c.
Figure 2
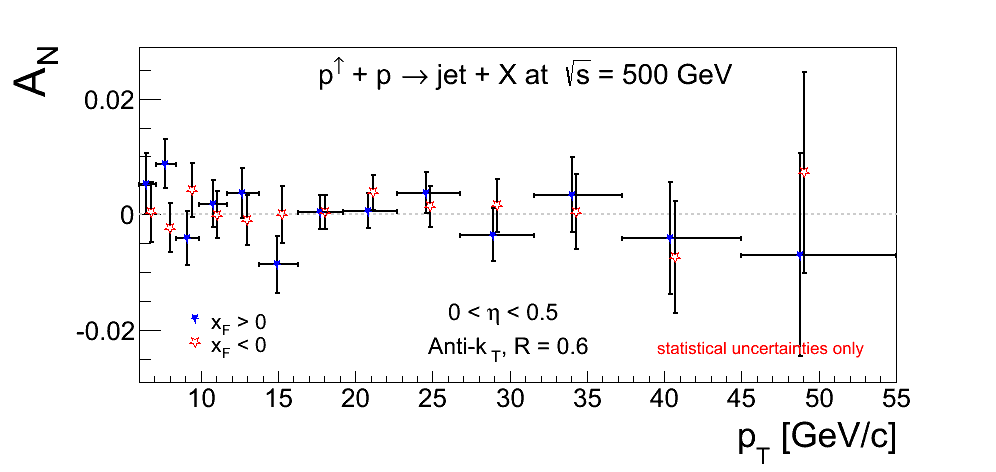
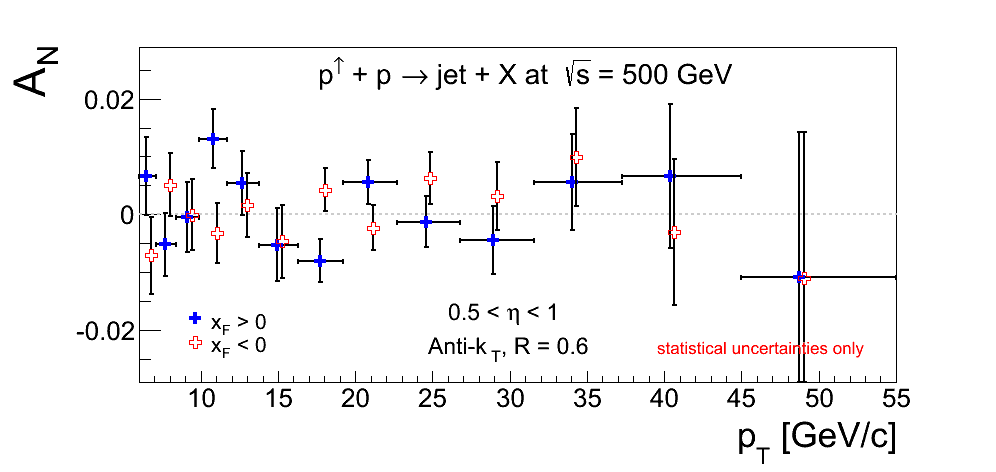
Figure 2 shows the Sivers asymmetries calculated for two bins of physics-η. These combine west-blue-beam-polarized events with east-yellow-beam-polarized events and vice versa.
Statistical Cross-checks
A few bins seem to show more fluctuations than one would like. The following plots show the residual distributions for weighted means with χ2 probabilities < 2%.
Figure 3: ⟨pT⟩ = 7.7 GeV/c with -1 < η < 1
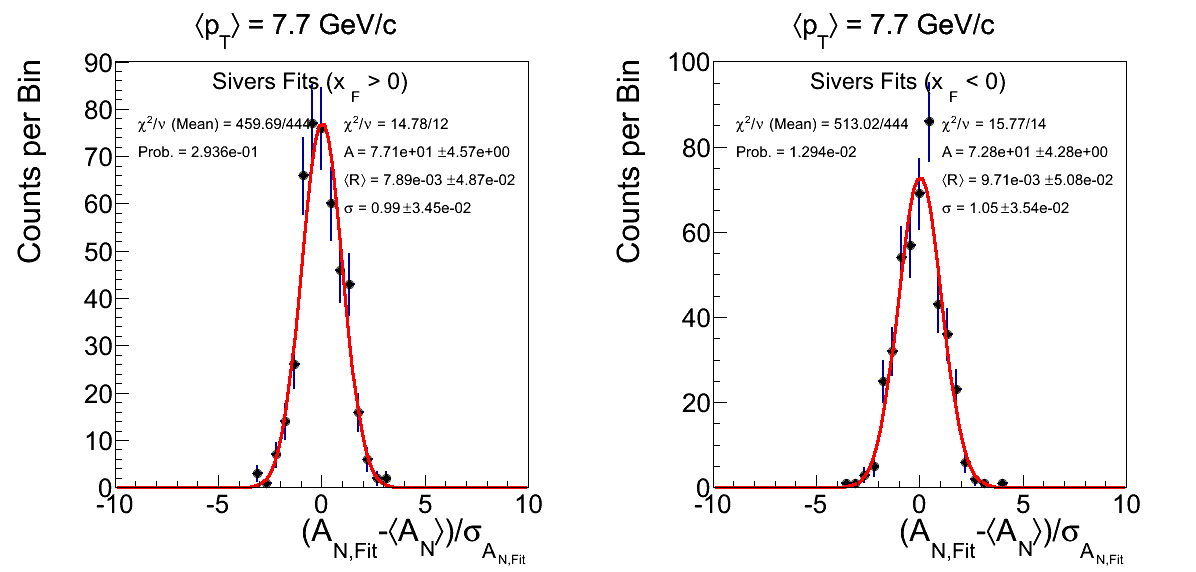
Figure 3 shows the residual distributions for ⟨pT⟩ = 7.7 GeV/c with -1 < η < 1. The χ2/ν returns a probability of 1.3%. The residual distribution, however, appears to be of reasonable shape.
Figure 4: ⟨pT⟩ = 17.7 GeV/c with -1 < η < 1
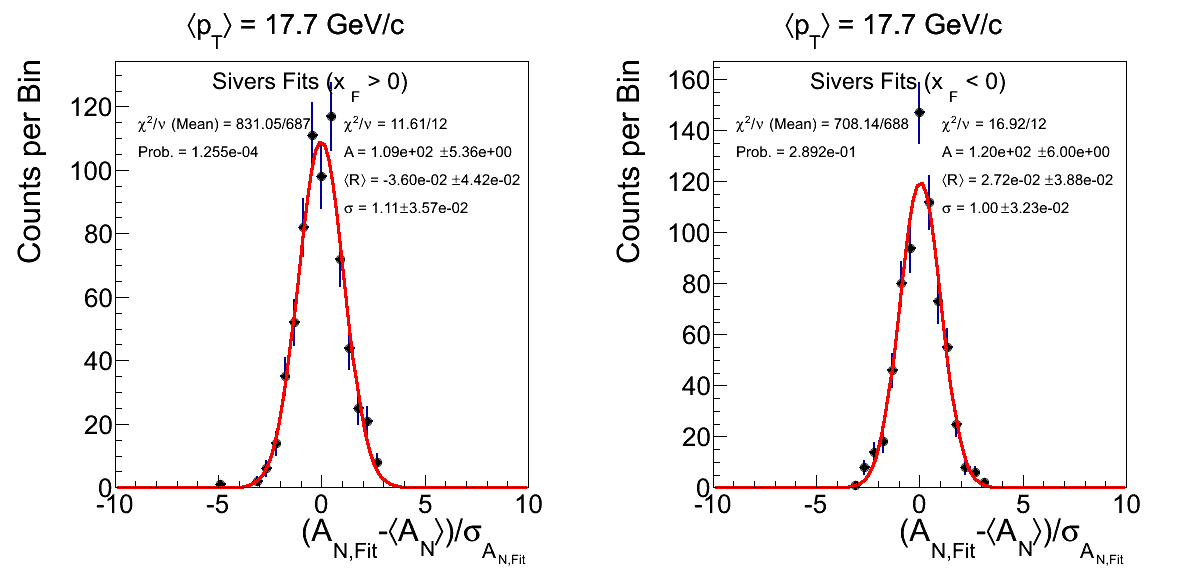
Figure 4 shows the residual distributions for ⟨pT⟩ = 17.7 GeV/c with -1 < η < 1. For xF > 0 the χ2/ν returns a probability well below 1% and the residual distribution has a width 3σ from unity. One can see a single event near -5 whose removal alone would improve the χ2 probability by an order of magnitude.
Figure 5: ⟨pT⟩ = 17.7 GeV/c with 0 < η < 0.5
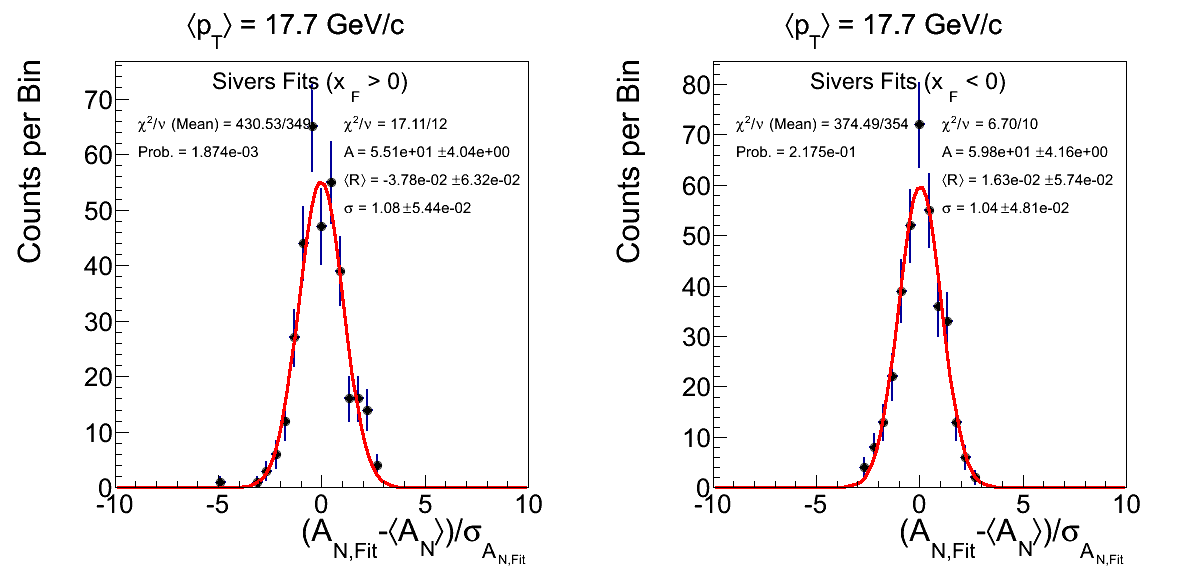
Figure 5 shows the subset of events from Fig. 4 with 0 < η < 0.5. Note, the mean AN, here, is what is reflected in Fig. 2 rather than Fig. 1. Again, the weighted mean returns a χ2 with probability well below 1% (in this case 0.2%). The residual distribution appears reasonably shaped, however, the statistics are a bit lower. The solo event at -5 appears to be relegated to this sample.
Figure 6: ⟨pT⟩ = 17.7 GeV/c with 0 < η < 0.5 (JP0 Fill 15213)
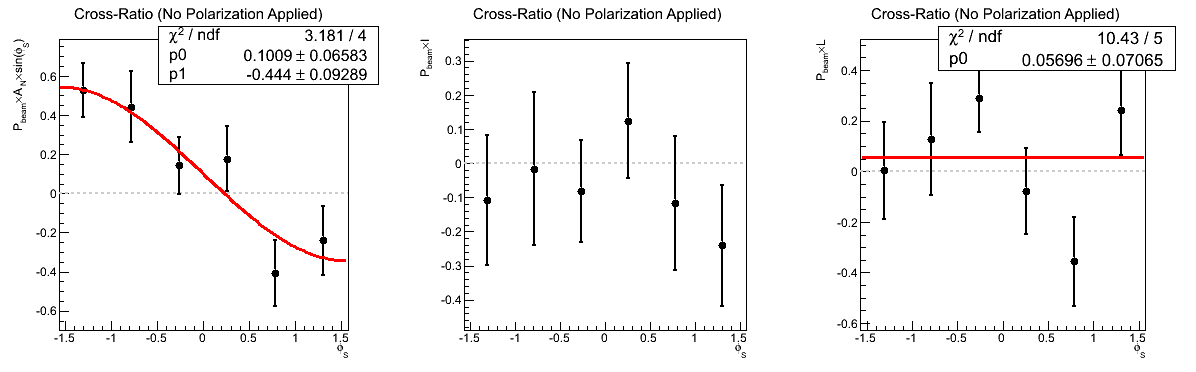
The outlier event appears to fall in fill 15213 with JP0. The asymmetry is quite large (4.8σ), and there does not appear to be an accompanying acceptance asymmetry, luminosity asymmetry, or p0 of substance.
Figure 7: ⟨pT⟩ = 17.7 GeV/c with 0.5 < η < 1
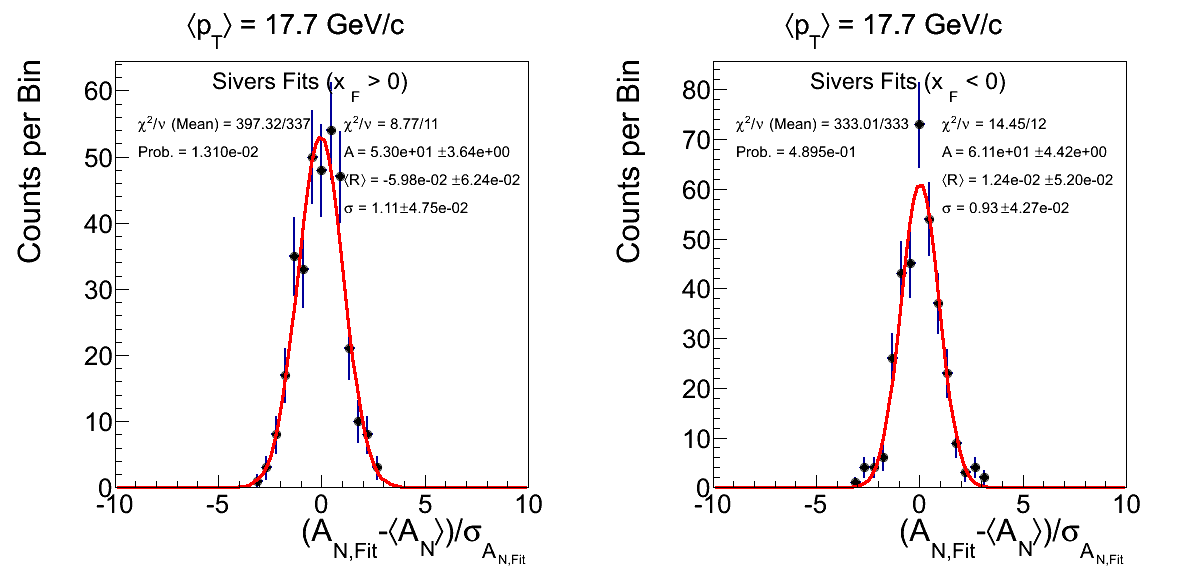
Figure 7 shows the subset of events from Fig. 4 with 0.5 < η < 1. Note, the mean AN, here, is what is reflected in Fig. 2 rather than Fig. 1. The weighted mean returns a χ2 with probability of 1.3%. The residual distribution, again, appears not-so-bad in its shape. Again, however, the statistics are a bit lower; and the width is still 2.3σ from unity.
Figure 8: ⟨pT⟩ = 20.8 GeV/c with -1 < η < 1
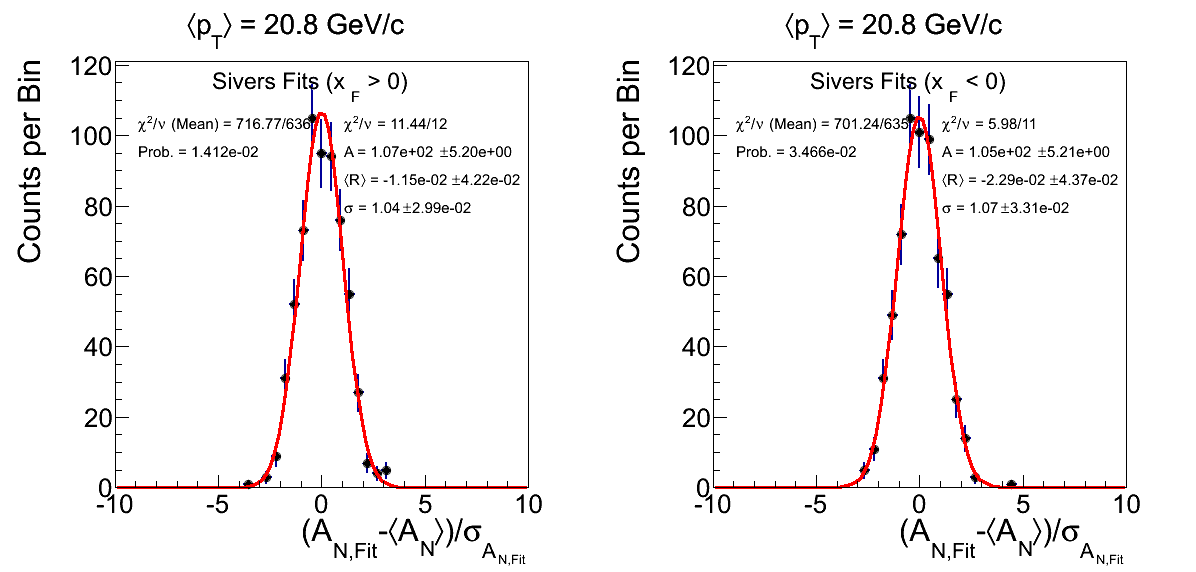
Figure 8 shows the residuals for ⟨pT⟩ = 20.8 GeV/c with -1 < η < 1. The χ2 probability for xF > 0 is 1.4%, however, the residual distribution looks reasonably shaped.
Figure 9: ⟨pT⟩ = 40.4 GeV/c with 0.5 < η < 1
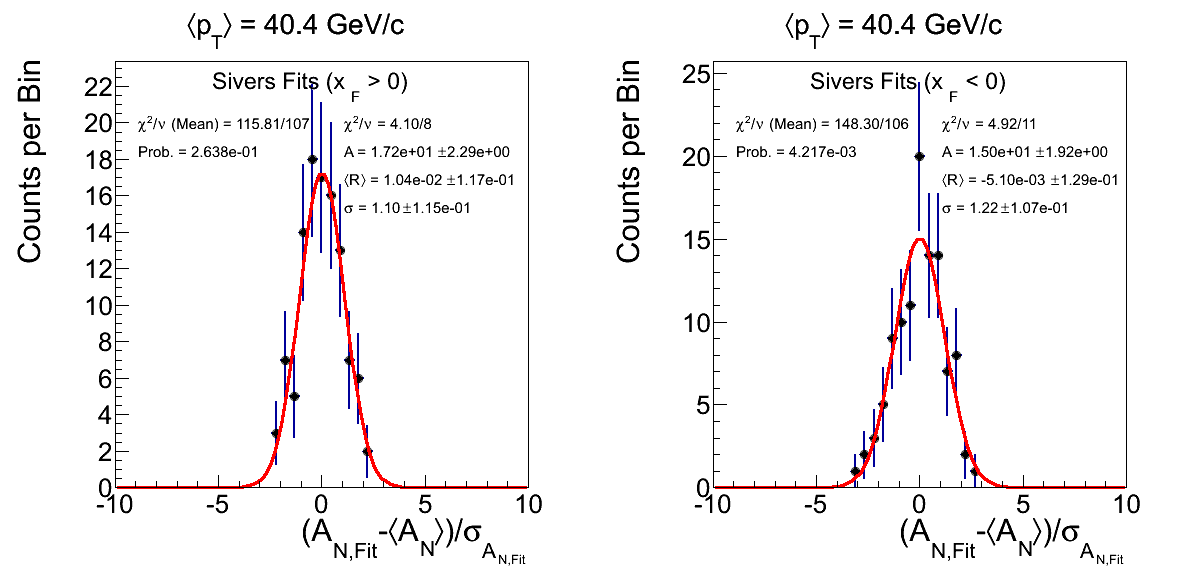
Figure 9 shows the residual distributions for ⟨pT⟩ = 40.4 GeV/c with 0.5 < η < 1. The χ2 probability for xF < 0 is 0.4%. Again, the residual distribution looks reasonably shaped.
Figure 10: ⟨pT⟩ = 48.7 GeV/c with -1 < η < 1
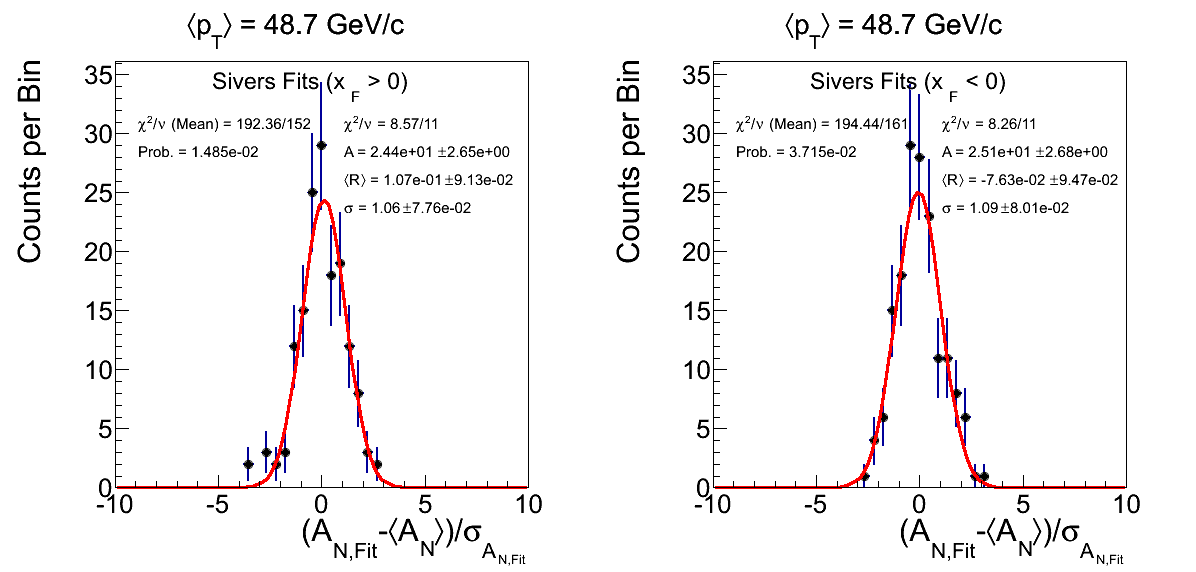
Figure 10 shows the residual distributions for ⟨pT⟩ = 48.7 GeV/c with -1 < η < 1. The χ2 probability for xF > 0 is 1.5%. Again, the residual distribution looks reasonably shaped. The two events (fills 15280 and 15399 with 0 < η < 0.5) near -3.5 each add substantially to the χ2.
Groups:
- drach09's blog
- Login or register to post comments