- drach09's home page
- Posts
- 2022
- 2020
- June (1)
- 2019
- 2018
- 2017
- 2016
- 2015
- 2014
- December (13)
- November (2)
- October (5)
- September (2)
- August (8)
- July (9)
- June (7)
- May (5)
- April (4)
- March (4)
- February (1)
- January (2)
- 2013
- December (2)
- November (8)
- October (5)
- September (12)
- August (5)
- July (2)
- June (3)
- May (4)
- April (8)
- March (10)
- February (9)
- January (11)
- 2012
- 2011
- October (1)
- My blog
- Post new blog entry
- All blogs
Run-11 Transverse Jets: Revisiting Trigger Definitions
Carl has proposed a new trigger definition for the 2011 analysis. The new trigger definition is as follows:
- Define a "floor" based on the TCU response: never demote a trigger below it's TCU response (save AJP which has a floor of JP0 to test both on a jet-by-jet basis)
- Promote to the most restrictive trigger available by requiring that the simulator has fired, the pT cut is satisfied, and the jet maps to a patch for that trigger
- Iterate the procedure until either the floor is reached or a trigger is satisfied
For the embedding, the floor is set by the simulator. Of course, since VPDMB is take-all below 16.3 GeV/c, the floor is always VPDMB unless the jet is above 16.3, when the floor is effectively JP0. I have, now, run over the entire 2011 dataset and show embedding-data comparisons including vertex weighting for the new trigger scheme.
Renee has also asked to see comparisons simply filling the embedding histograms if the trigger simulator is satisfied. These are shown below (left-hand side). Here, there is also a vertex-weighting applied for the embedding.
Figure 1: VPDMB
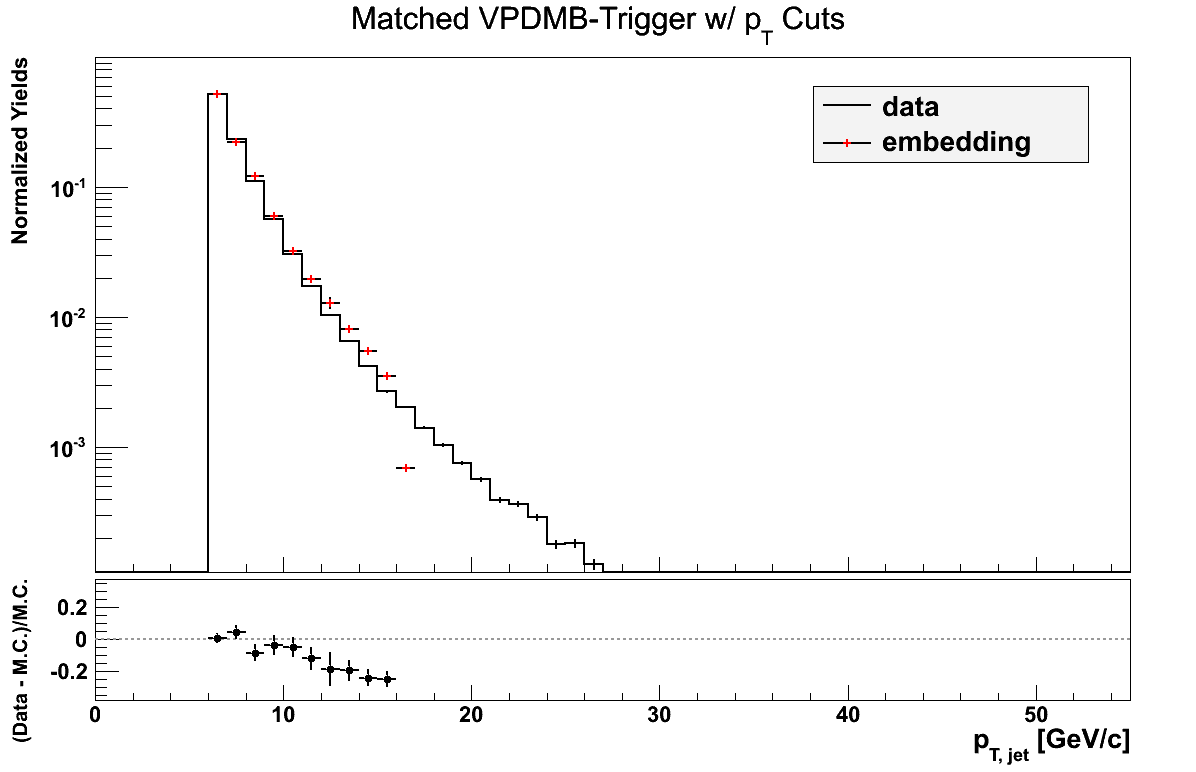
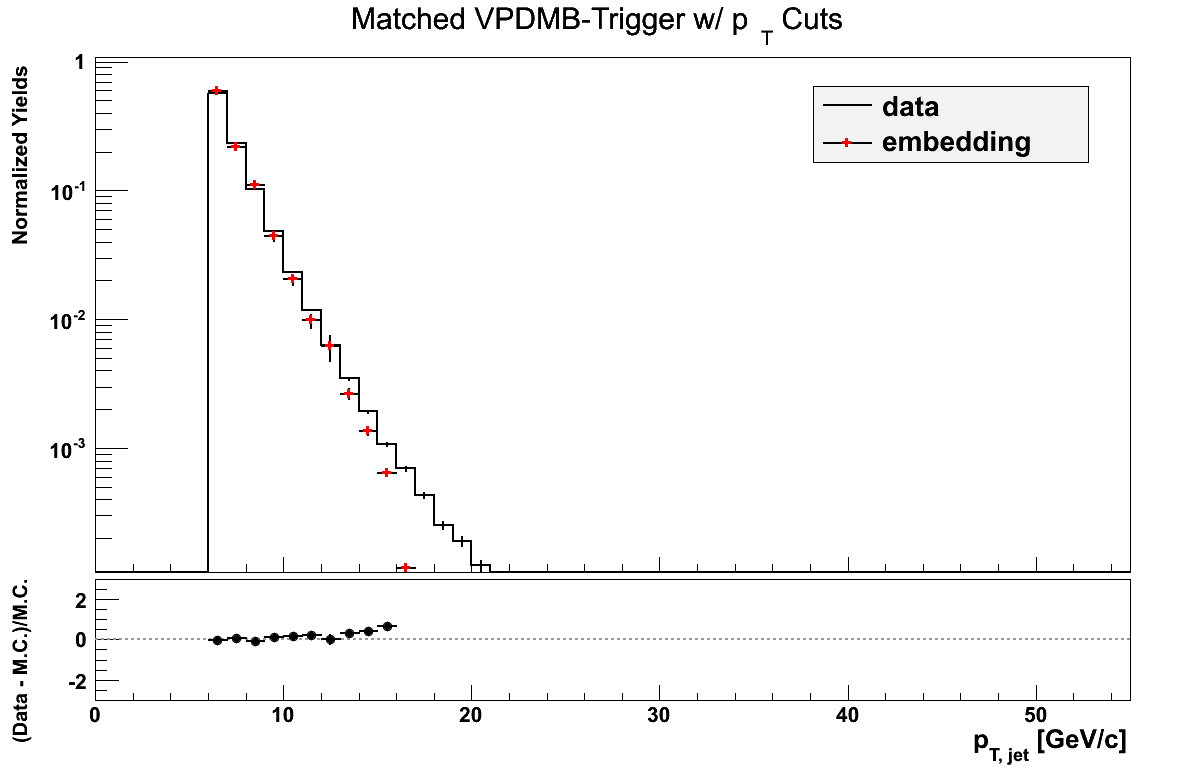
On the left is the simple comparison of binning the embedding if the trigger is satisfied. For VPDMB, this is all jets below 16.3 GeV/c. On the right uses the new trigger definition. In either case the comparison is quite good.
Figure 2: JP0
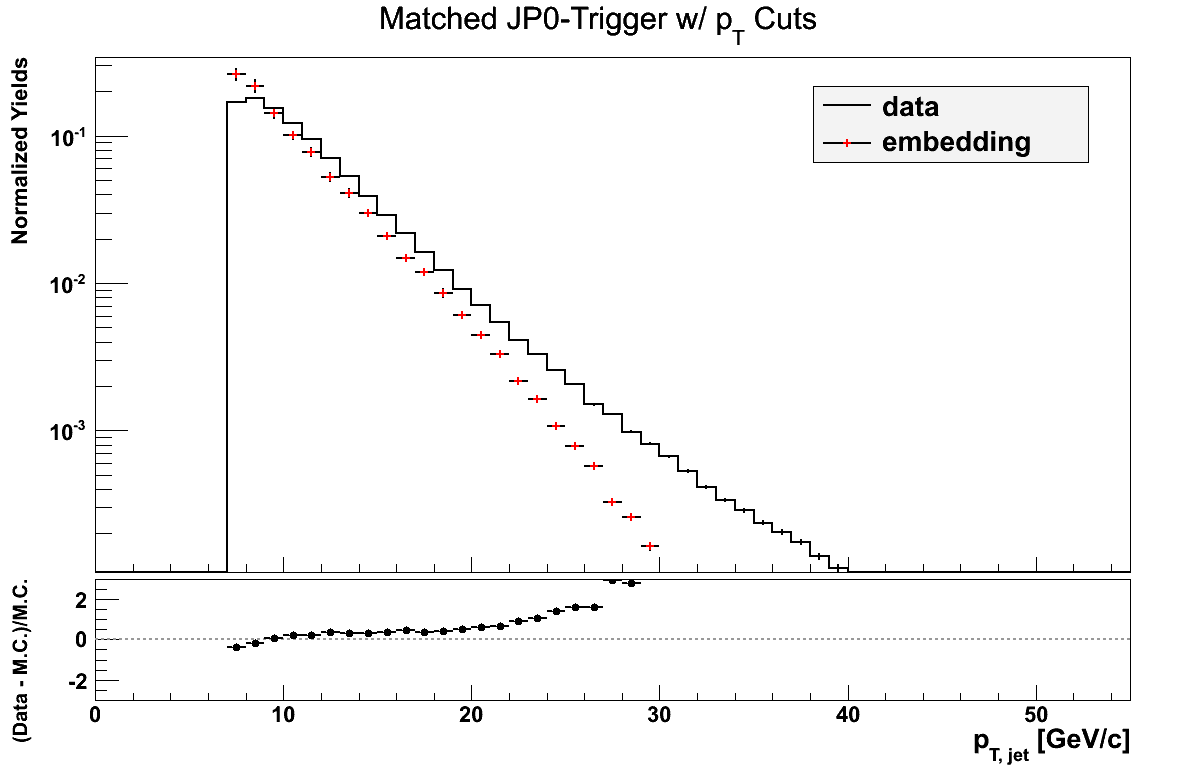
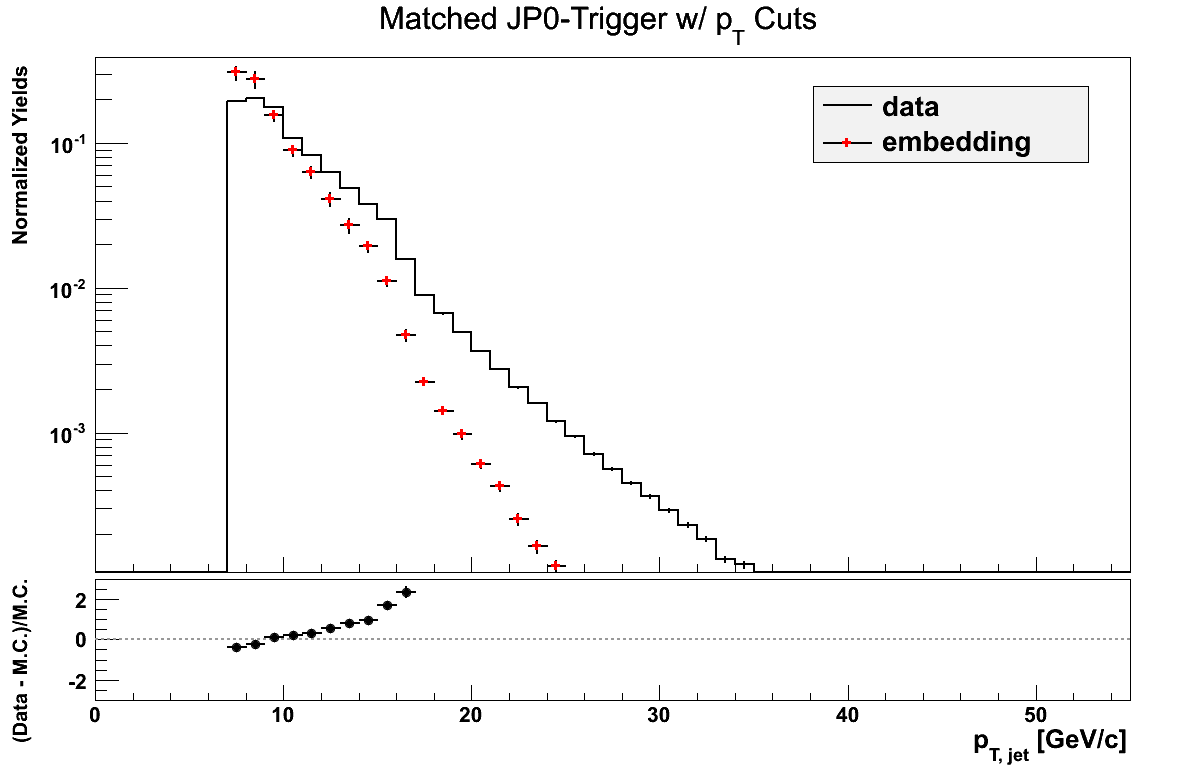
For JP0 the comparisons are not so great. On the left (simply ask if the trigger fired) the slopes are fairly close out to 20 GeV/c. The trigger turn-on does not appear to be as dramatic in the embedding as in the data. Above 20 GeV/c the data appears harder than the embedding. Part of this could be due to the fact that above partonic pT = 25 GeV/c, the shouldFire() does not work for JP0, since I use the 2009 embedding. The EM201 output for 2009 does have the JP0 bit, so in principle I could use it. However, it would require a bit of work.
On the right, the comparison for the new trigger definition is, if anything, worse. Ironically, if I overlay the embedding distribution from the left with the data on the right, I get a very nice match.
Figure 3: JP1
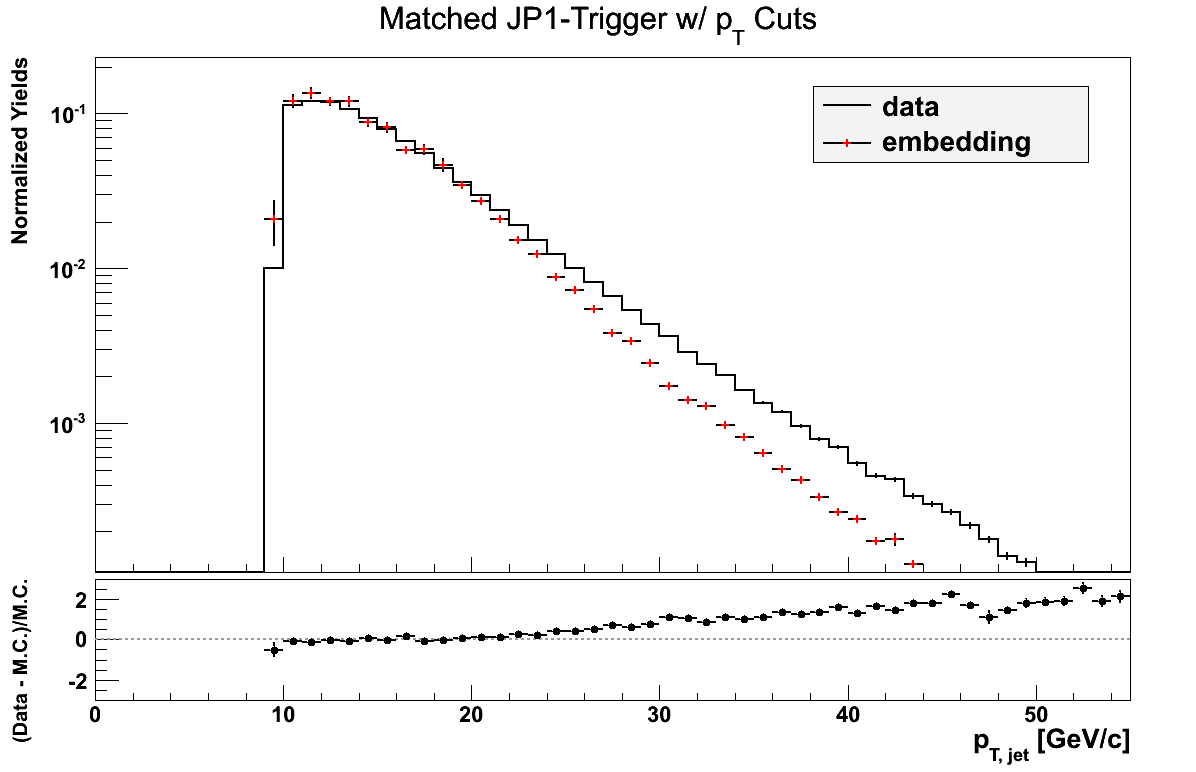
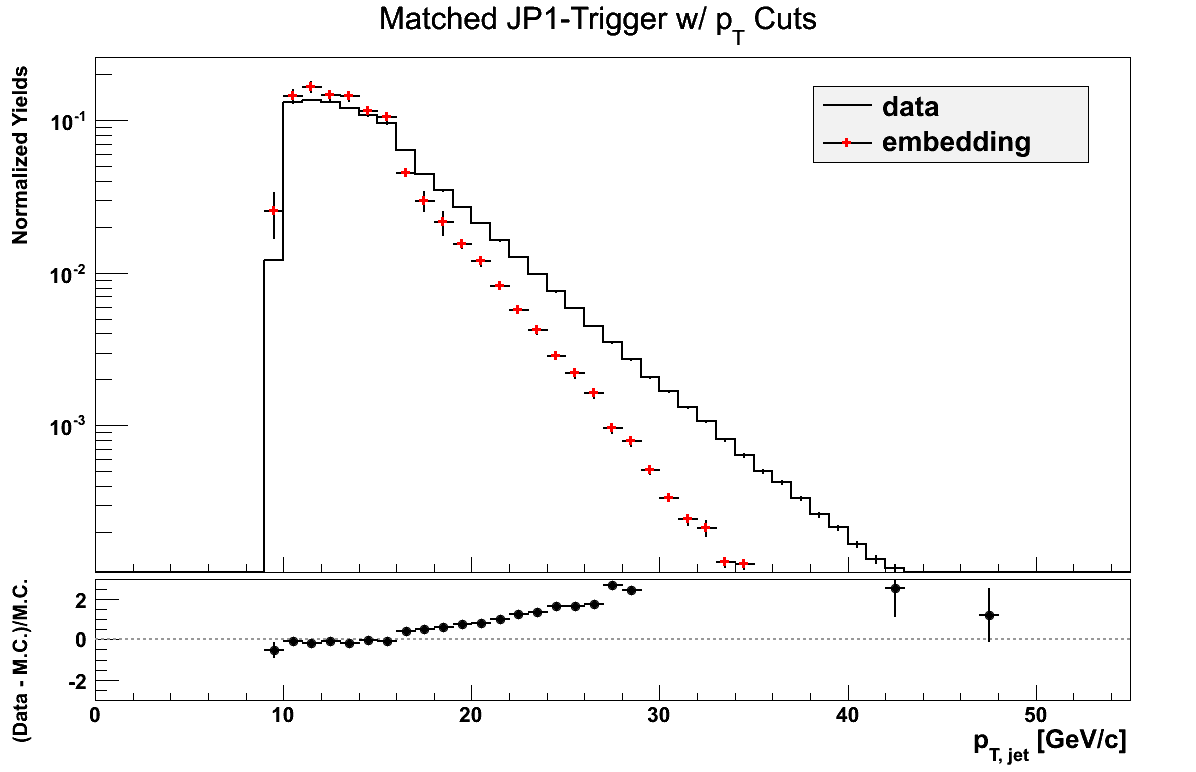
For JP1, I use both the 2011 and 2009 embedding. The left-hand comparison is dead-on out to 20 GeV/c. Above that the comparison begins to diverge. On the right, the comparison is, again, pretty good out to 16 GeV/c, where it begins to diverge, sharply. Again, if I overlay the embedding from the left with the data from the right, the match is quite good.
Figure 4: JP2
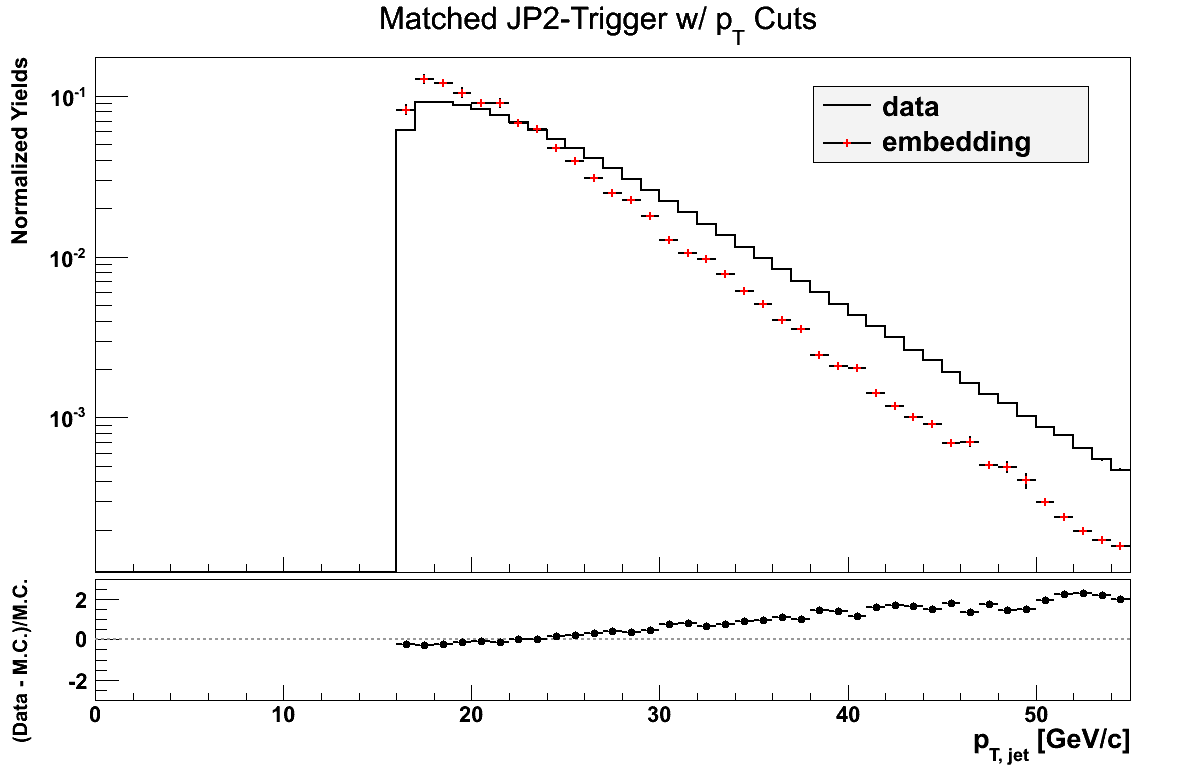
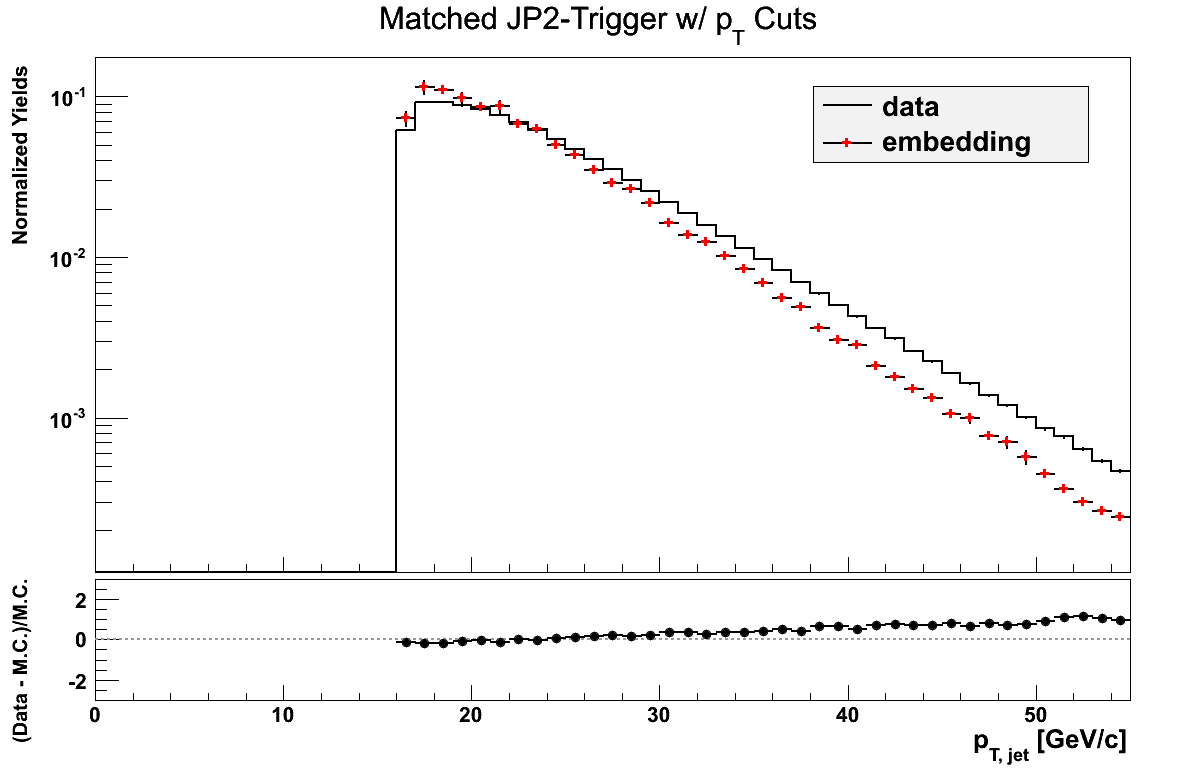
For JP2 the distributions should be basically identical. The trigger turn-on appears in the right place, however, the data are simply much harder than the embedding. One subtle change is the vertex reweighting. The differences in the embedding between the left and right possibly indicate the improvement in my scheme. This may also indicate some inadequacies in the vertex-weighting seen in Fig. 3 (left).
Renee has begun to wonder if the some of the differences between data and embedding are due to inclusion of the Run-9 sample. Below, I post JP1 and JP2 using Run-11 embedding only (left), Run-9 embedding only (center), and Run-11+Run-9 embedding (right). VPDMB and JP0 to this point only use Run-11 embedding.
Figure 5: JP1 Run-11 vs. Run-9 vs. Run-11+Run-9
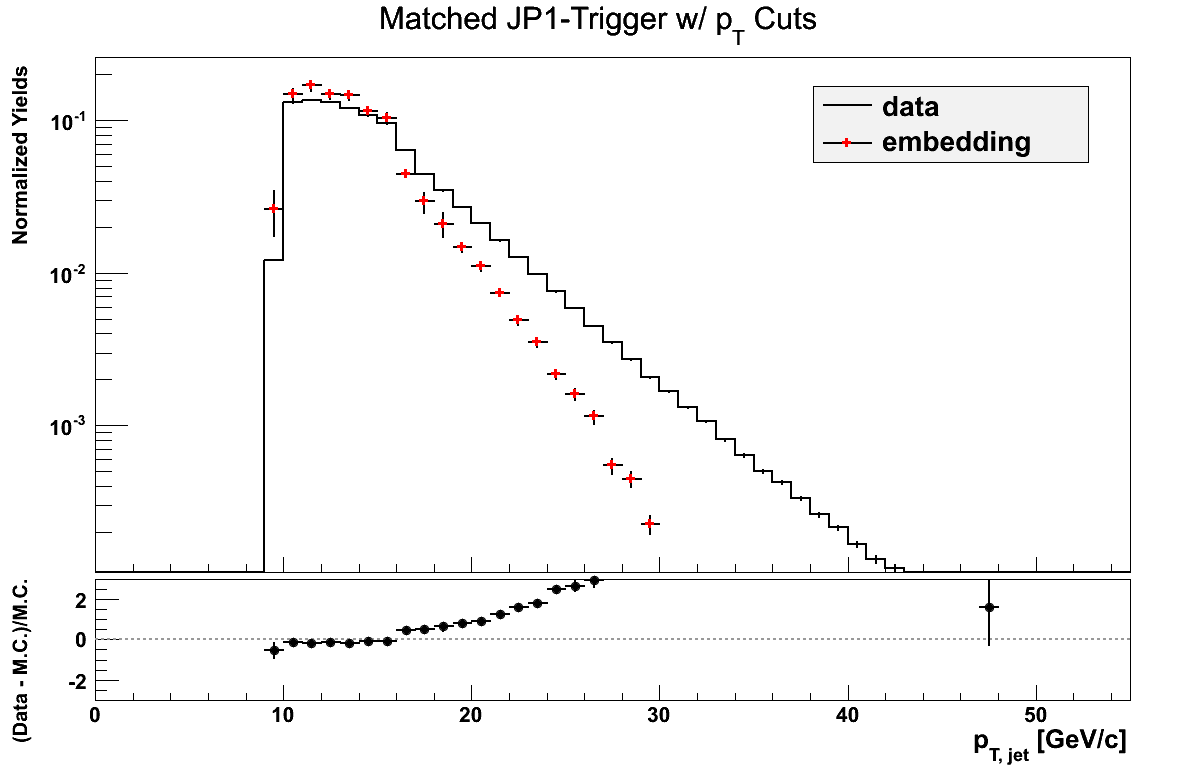
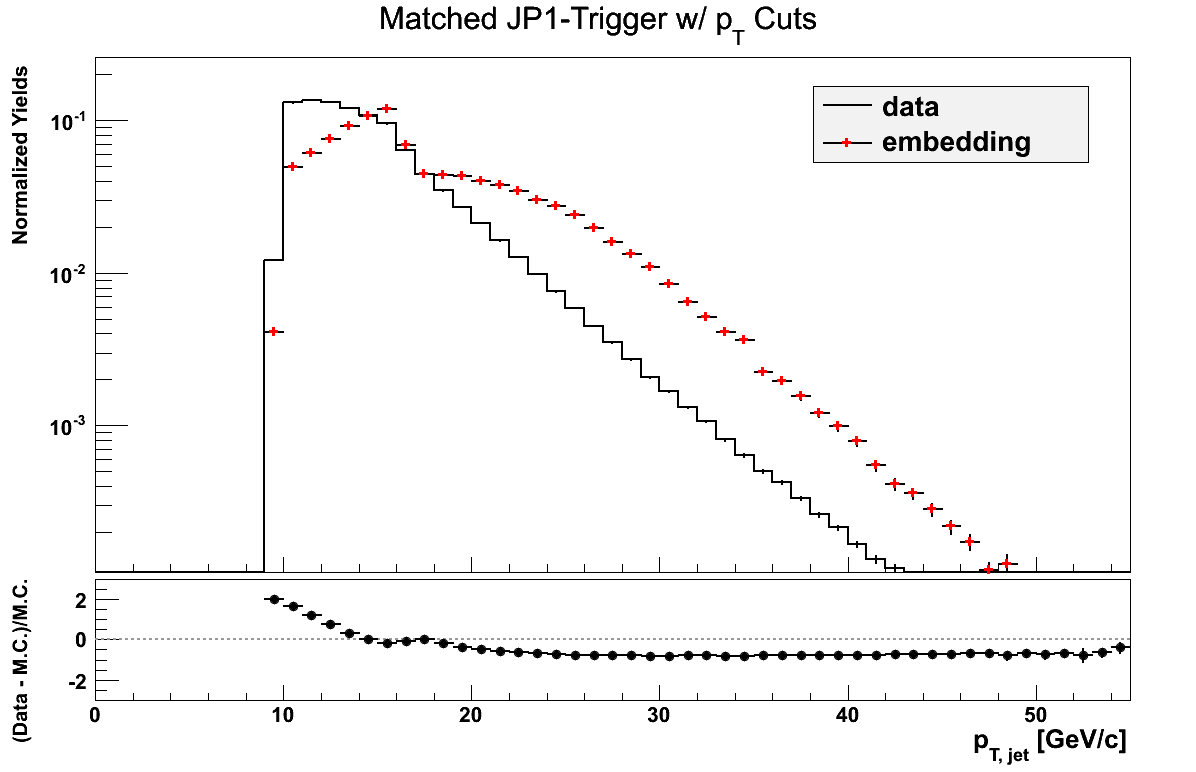

I'm a bit surprised by how little of a difference the Run-9 embedding makes under the new trigger scheme. One can clearly see the break at 16.3 GeV/c where jets start being promoted to JP2. The extra partonic pT bins somewhat flatten out the slope of the embedding above ~20 GeV/c, albeit not by much. By itself, the slope of the Run-9 embedding at high-pT seems to match fairly well. This is apparently swamped by the higher weighting of the lower partonic pT bins.
Figure 6: JP1 Run-11 vs. Run-9 vs. Run-11+Run-9
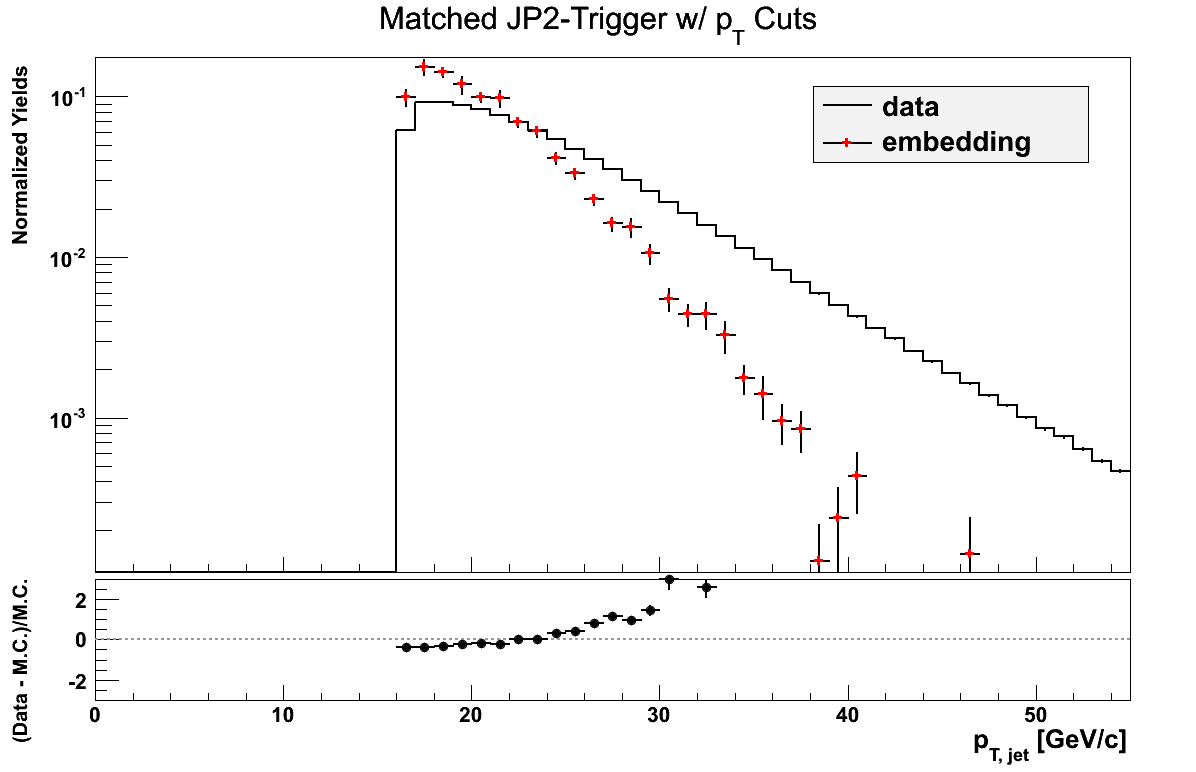
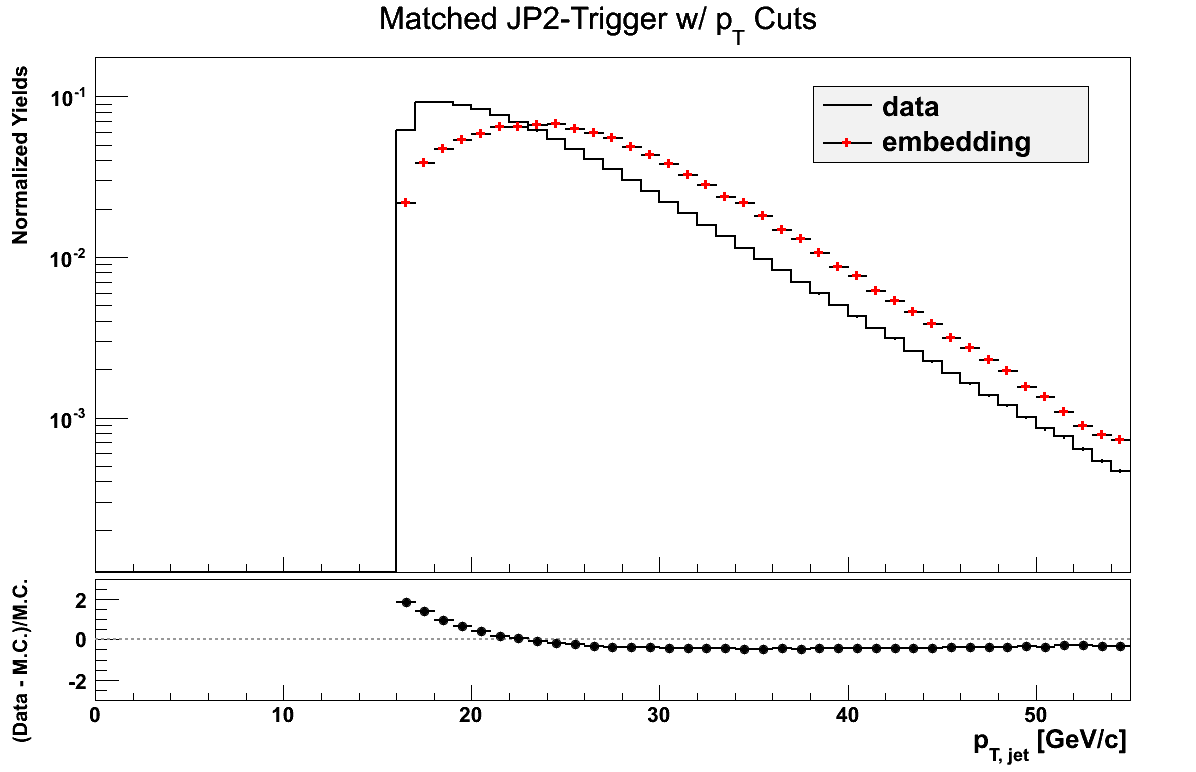

One can quite readily see the difference the Run-9 embeddign makes on JP2. The middle plot is fairly familiar at this point. Again, the slope at high-pT is pretty close, but damped by the high weighting of the lower partonic pT bins.
- drach09's blog
- Login or register to post comments
