- drach09's home page
- Posts
- 2022
- 2020
- June (1)
- 2019
- 2018
- 2017
- 2016
- 2015
- 2014
- December (13)
- November (2)
- October (5)
- September (2)
- August (8)
- July (9)
- June (7)
- May (5)
- April (4)
- March (4)
- February (1)
- January (2)
- 2013
- December (2)
- November (8)
- October (5)
- September (12)
- August (5)
- July (2)
- June (3)
- May (4)
- April (8)
- March (10)
- February (9)
- January (11)
- 2012
- 2011
- October (1)
- My blog
- Post new blog entry
- All blogs
2006 EEMC Neutral Pions: Single-beam Backgrounds (part 5)
I have run the analysis code removing the software requirement and replacing it with "requireEither." My understanding is will pass events which pass the hardware or the software trigger. While this does not leave an optimal situation for the analysis it will increase our event counts which may aide our understanding of the non-coincidence events.
Figure 1
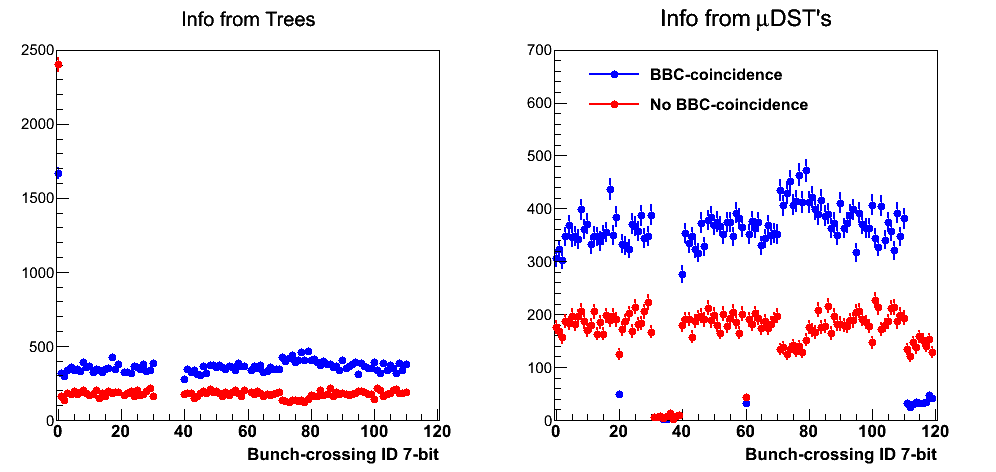
In Fig. 1 I show the bunch-crossing distributions for coincidence and non-coincidence events. They now look very similar to the distributions from my previous post. Indeed, they are the same save an over-all scale of 0.92. This suggests the bulk of the non-coincidence events are lost via the software trigger requirement.
Figure 2
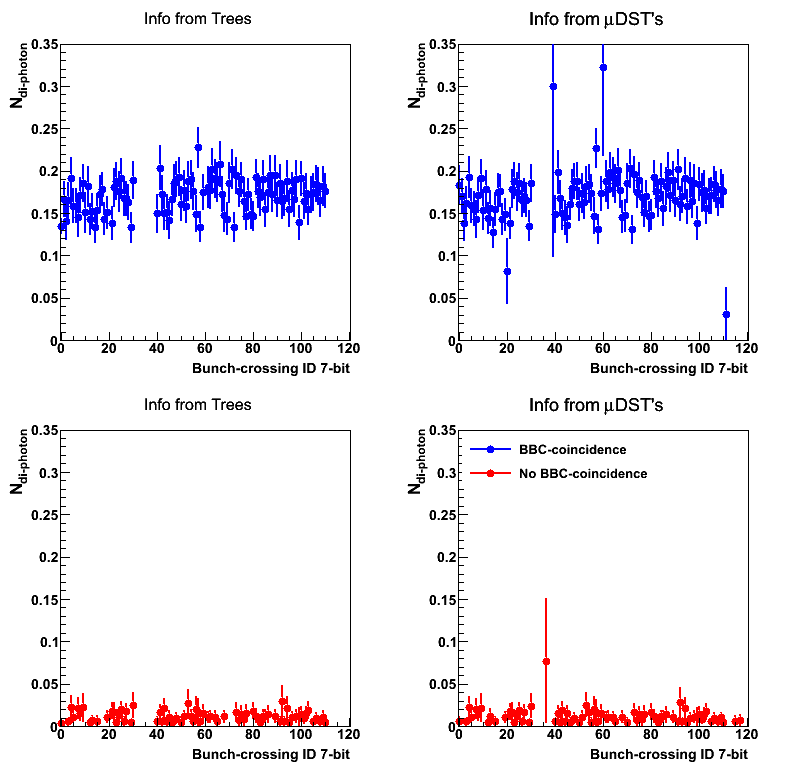
Again, rather few unfilled bunches return di-photons. On average, a coincidence event contains 0.169 di-photons, while a non-coincidence event contains 0.00790 di-photons. Thus, it appears most remaining non-coincidence events are removed by our di-photon requirement.
Figure 3
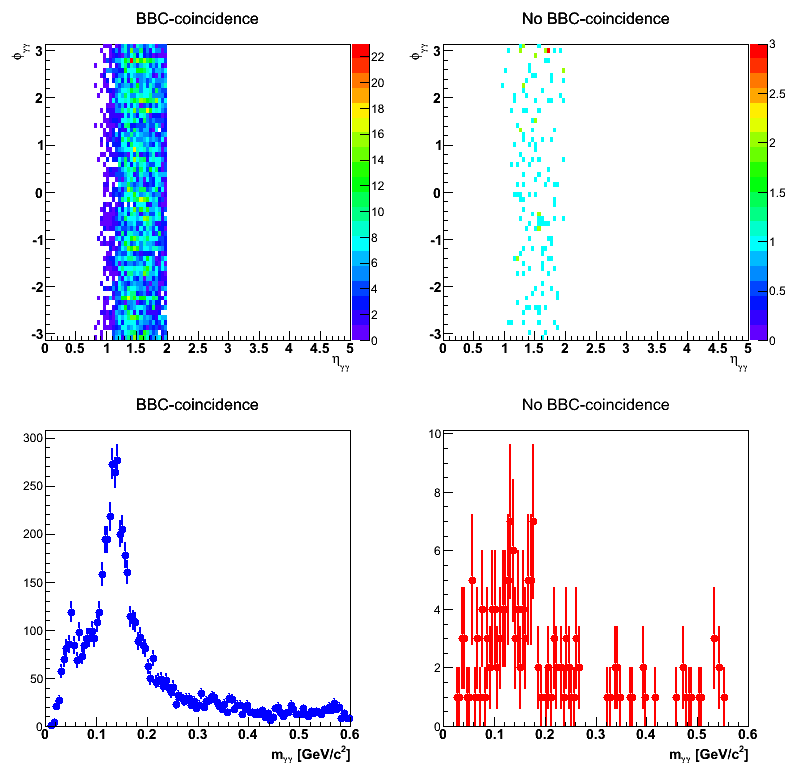
Within limited statistics (156 non-coincidence di-photons), the distributions for coincidence and non-coincidence di-photons look rather similar. Coincidence di-photons have <η> = 1.53 vs. 1.52 for non-coincidence. The mean φ are somewhat different (0.049 vs. 0.24), however, a constant fit to the φ-projection of the non-coincidence events returns 2.03518±0.194135 with χ2/ν = 46.1005/53. Thus, there is not really any noticeable φ-asymmetry from the non-coincidence events. The mass distributions look rather similar with means of 0.188 (coincidence) vs. 0.192 (non-coincidence) and RMS values of 0.127 (coincidence) vs. 0.129 (non-coincidence).
Figure 4
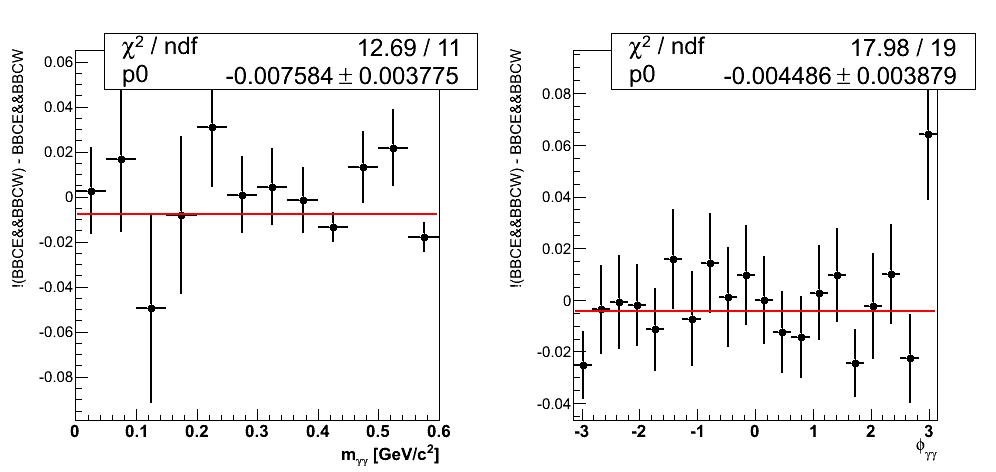
Another way to examine the differences between coincidence and no-coincidence events is shown in Fig. 4. Above, I have normalized the mass and φ distributions for both samples. I have, then, subtracted the coincidence events from the no-coincidence events, fitting the resulting distribution with a constant. The results are quite reasonably constant within 2σ of zero, suggesting no statistically significant difference between the shape of the two samples.
Figure 5
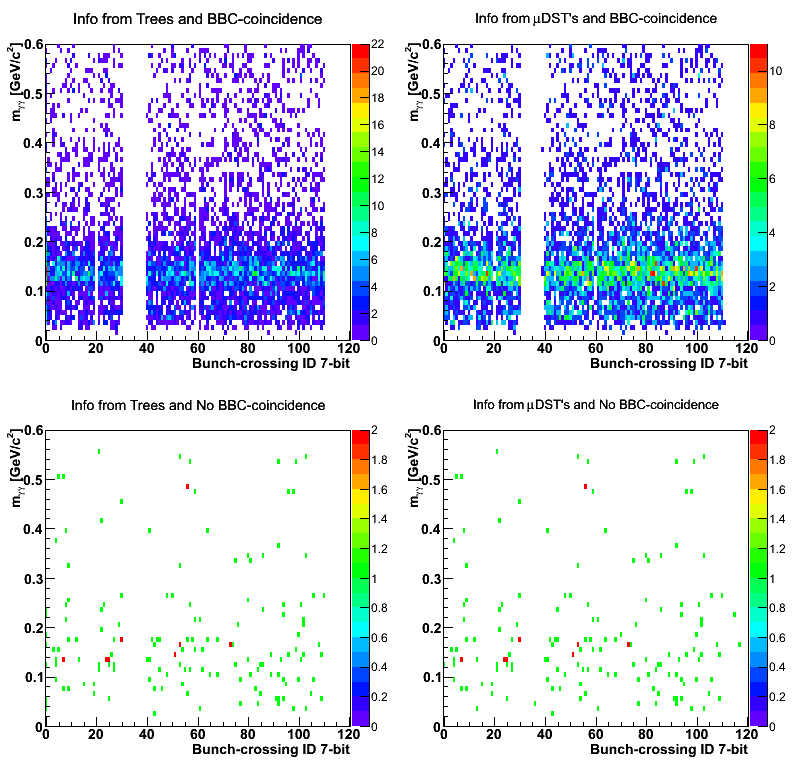
With very limited statistics, it does not appear there is a particular mass-bias for abort gap events.
Figure 6
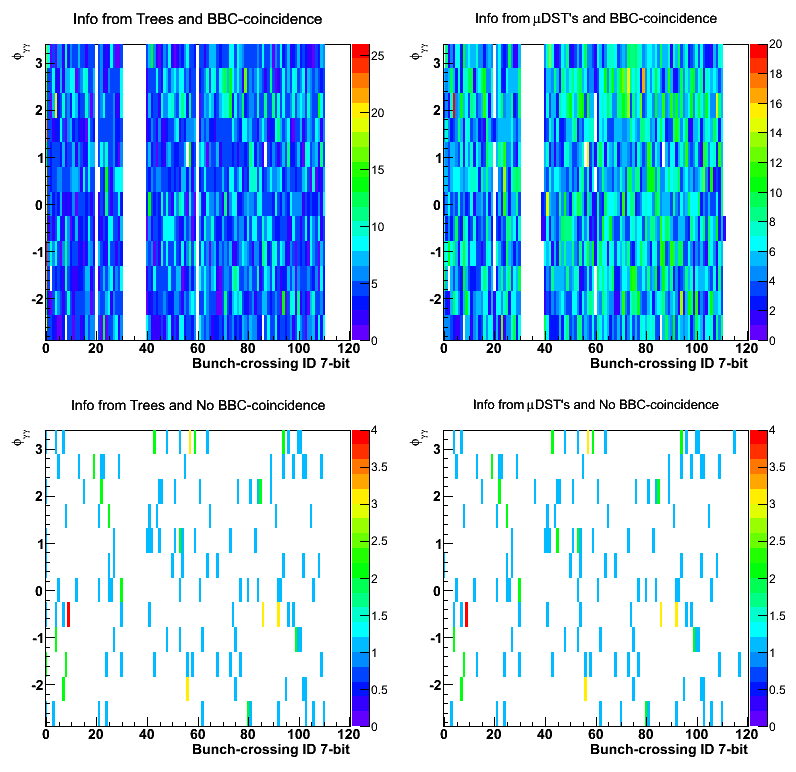
Neither does there appear to be a φ-bias in abort gap events.
- drach09's blog
- Login or register to post comments
