- drach09's home page
- Posts
- 2022
- 2020
- June (1)
- 2019
- 2018
- 2017
- 2016
- 2015
- 2014
- December (13)
- November (2)
- October (5)
- September (2)
- August (8)
- July (9)
- June (7)
- May (5)
- April (4)
- March (4)
- February (1)
- January (2)
- 2013
- December (2)
- November (8)
- October (5)
- September (12)
- August (5)
- July (2)
- June (3)
- May (4)
- April (8)
- March (10)
- February (9)
- January (11)
- 2012
- 2011
- October (1)
- My blog
- Post new blog entry
- All blogs
2006 EEMC Neutral Pions: Single-beam Backgrounds (part 6)
Carl pointed out to me that the min-bias requirement actually only looks at the ADC of BBC-small tiles. While this may not change the message of the results, it is useful to examine the effect of tagging coincidence events on either small or small+large tiles.
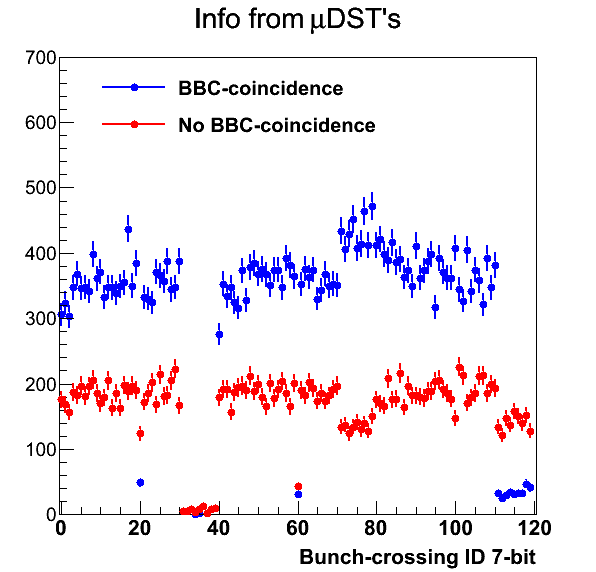
Figure 1
| BBC Large and Small | BBC Small |
|---|---|
 |
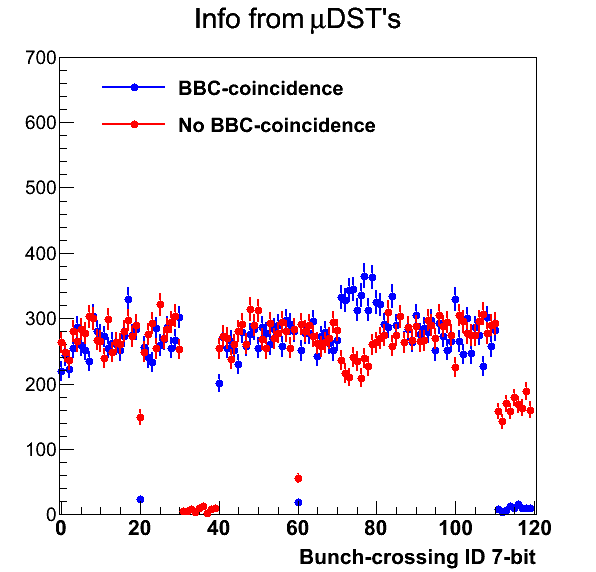 |
As Fig. 1 shows, there is a substantial increase in no-coincidence events relative to coincidence events when only looking to small tiles. I am actually surprised there is this much of a change, as now there are actually slightly more no-coincidence events (27888 vs. 29059). Moreover, the actual min-bias trigger places a constraint on the TAC and ΔT, which means I am actually tagging too many coincidence events. Given the event vertex cut, such requirements should have no effect on my di-photon samples.
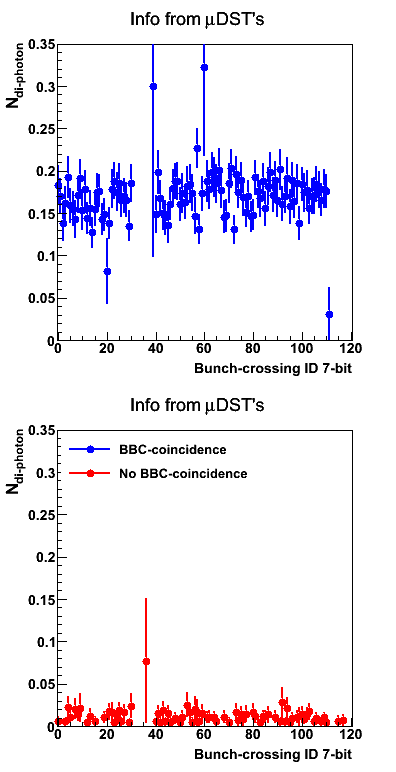
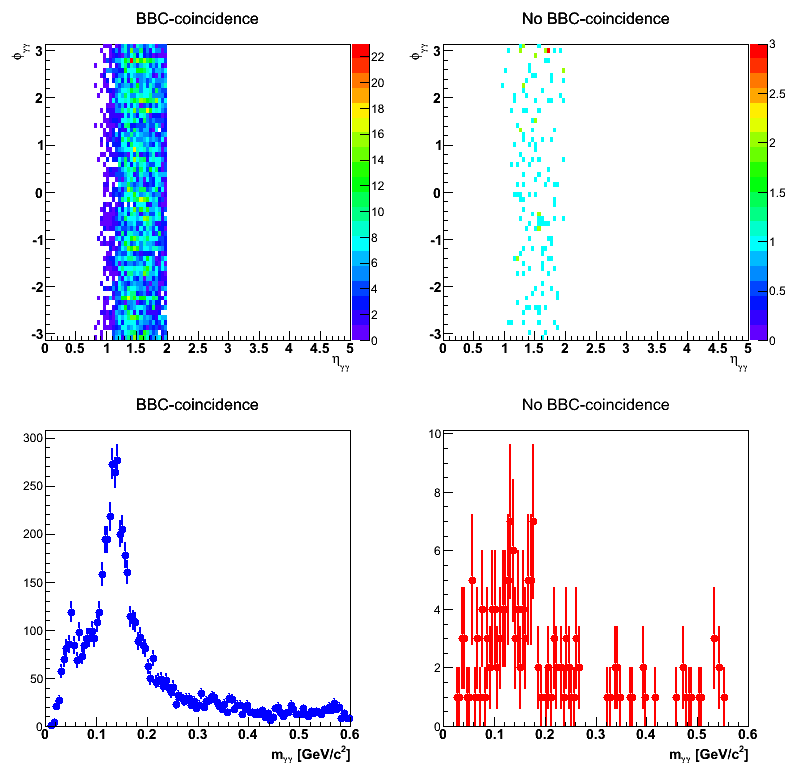
Figure 2
| BBC Large and Small | BBC Small |
|---|---|
 |
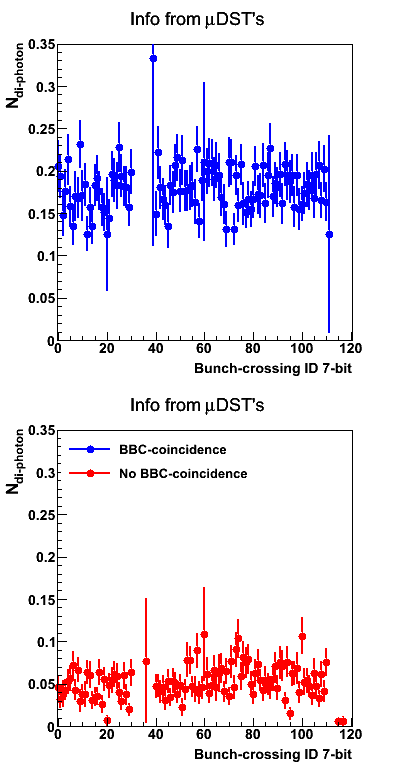 |
The rate of di-photons for each ID changes little for coincidence events (0.1692 to 0.1795) while it changes rather substantially for no-coincidence events (0.007898 to 0.04966).
Figure 3
| BBC Large and Small | BBC Small |
|---|---|
 |
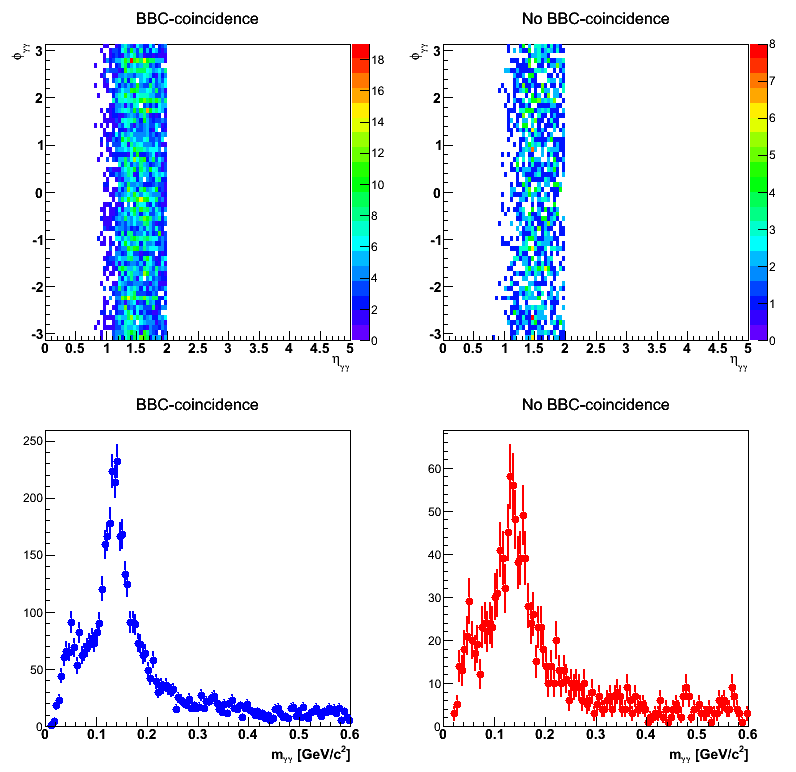 |
The resulting mass and eta-phi distributions seem relatively similar between the two samples. However, the final arithmetic is a bit odd. Given the final numbers (5005 coincidence di-photons and 1443 no-coincidence di-photons), I estimate a BBC efficiency of 77.6% which is quite a bit lower than the quoted 88%. If I assume the difference is due to additional single-beam background, I would expect some 671 non-collision di-photons in my no-coincidence sample, i.e. 46% of the no-coincidence sample. It seems likely that such a contribution would noticably change the shape of the no-coincidence distributions, however, no such difference appears to my eyes.
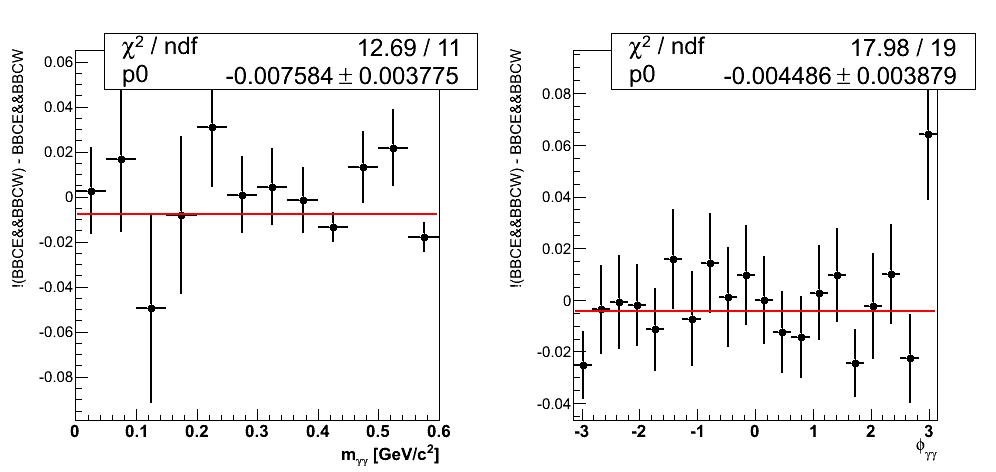
Figure 4
| BBC Large and Small |
|---|
 |
| BBC Small |
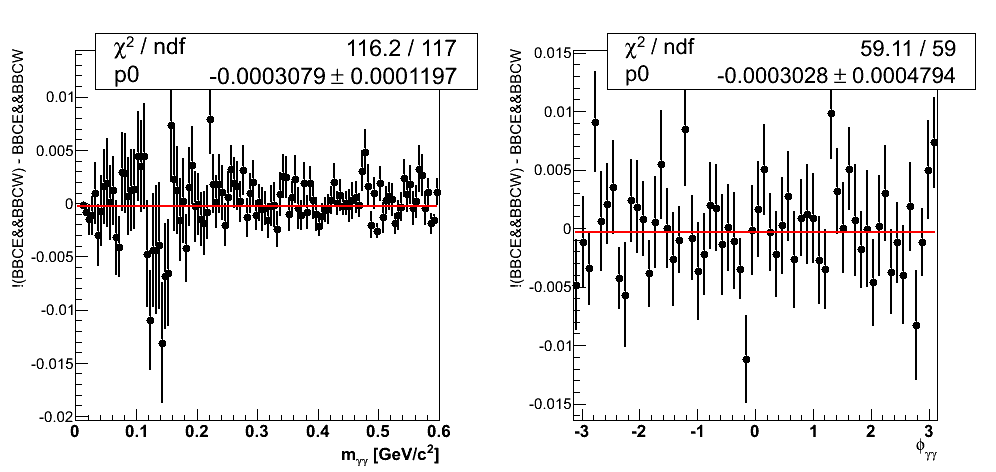 |
One final check is to normalize the coincidence and no-coincidence samples and subtract the two, looking for variations signaling a background distribution. In Fig. 4, I show the results of such a procedure. In the "large and small" sample the constant fit seems perfectly reasonable, within 2σ of 0. For the "small only" sample the fits return perfectly reasonable χ2 values, but the mass distributions are clearly different. The φ distribution is within 1σ of 0. The mass distribution is 2.6σ from 0, and there appears to be a dip within the signal mass window.
Groups:
- drach09's blog
- Login or register to post comments