- drach09's home page
- Posts
- 2022
- 2020
- June (1)
- 2019
- 2018
- 2017
- 2016
- 2015
- 2014
- December (13)
- November (2)
- October (5)
- September (2)
- August (8)
- July (9)
- June (7)
- May (5)
- April (4)
- March (4)
- February (1)
- January (2)
- 2013
- December (2)
- November (8)
- October (5)
- September (12)
- August (5)
- July (2)
- June (3)
- May (4)
- April (8)
- March (10)
- February (9)
- January (11)
- 2012
- 2011
- October (1)
- My blog
- Post new blog entry
- All blogs
2006 EEMC Neutral Pions: Single-beam Backgrounds (part 9)
To quantify the effect of non-collision background, I follow the technique utilized by Pibero in the Run-9 inclusive jet ALL analysis. A formulation may go something like the following:
δAN = fBGAN, BG / fsig
δAN = ( (NBG / Ntot) / (Nsig / Ntot) ) × AN, BG
δAN = (NBG / Nsig) × AN, BG.
So, we need to calculate the number of background pions, NBG, in our sample and their asymmetry, AN, BG. For the former, we can turn to the eemc-http sample. We can select non-coincidence di-photons to represent "identified" background di-photons. We know these events are actually a combination of non-collision and collision events (perhaps completely collision events) tagged as non-collision due to BBC inefficiency. Taking the total non-coincidence sample as non-collision di-photons will overestimate the backgrounds. This ultimately translates into a conservative upper limit on the non-collision systematic. To convert the non-coincidence di-photons into the total background contribution we consider that for a non-collision event to make it into our analysis the non-collision event must occur in random coincidence with with a vertex and be reconstructed as a "good" di-photon. Of course, for the event to make it to our non-coincidence sample it must occur in random coincidence with an event without a BBC coincidence. So, we may express the situation as follows:
NBG, non-coinc = Pnon-coinc × NBG, tot
NBG = Pvtx × NBG, tot = ( Pvtx / Pnon-coinc ) × NBG, non-coinc,
where Pvtx and Pnon-coinc represent the probabilities for a vertex and a non-coincidence event, respectively. The resulting expression for the systematic becomes
δAN = ( Pvtx / Pnon-coinc ) × ( NBG, non-coinc / Nsig ) × AN, BG.
Within the signal window (1 < mγγ < 2 GeV/c2) we find 702 non-coincidence di-photons and 2597 coincidence pions. To obtain the probabilities we can turn to zero-bias data. We have a couple of options when it comes to estimating AN, BG. We can calculate the asymmetry from the small sample of background di-photons and take the larger of the asymmetry or the uncertainty. We could also calculate the asymmetry from the background high-towers from a previous blog.
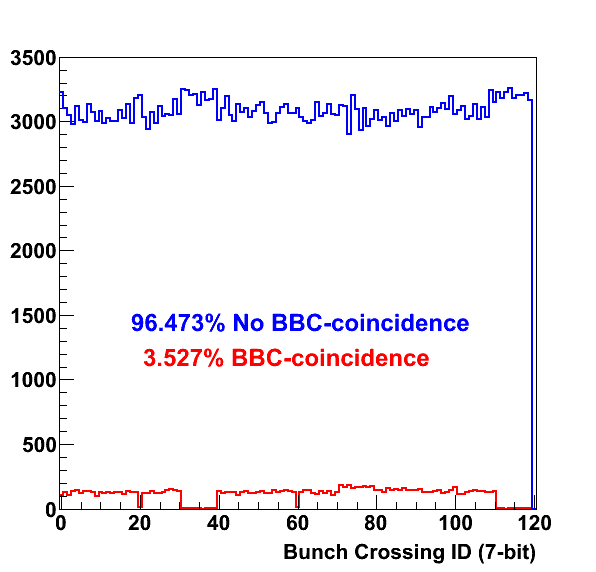
Figure 1

In Fig. 1 we see the bunch-crossing distribution for 380k zero-bias events. One can see that the vast majority (96%) occur without a BBC-coincidence. This 0.965 value can go into the calculation as Pnon-coinc.
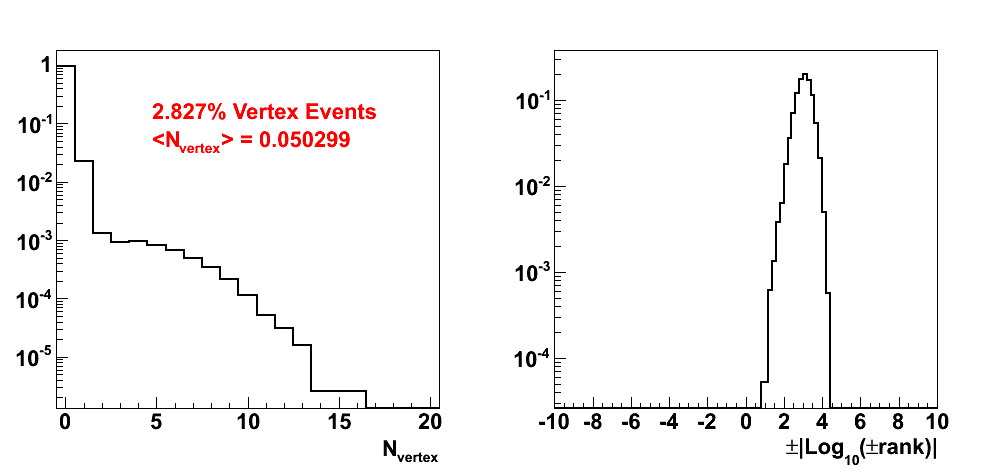
Figure 2

In Fig. 2, I show the distribution of the number of vertices in each event and the corresponding vertex rank. The distributions have been normalized to unity. One can, again, see that the vast majority of events (97%) do not contain a vertex. On average, an event will contain 0.05 vertices. Note, also, that all vertices have positive rank. This was an unexpected, but fortuitous, feature. Unbeknownst to me, negatively ranked vertices were not stored until Run-8 (thanks to Jan for clearing this up for me!). This also means we do not need to reproduce the data to include the vertex rank.
At this point, we can write our expression
δAN = 0.0079211 × AN, BG.
The largest fluctuations we have seen in our data come in at 0.32±0.17. Taking this as an estimate of an upper-limit on AN, BG, we could expect δAN < 0.003. In such a case, I expect this will be a negligible effect.
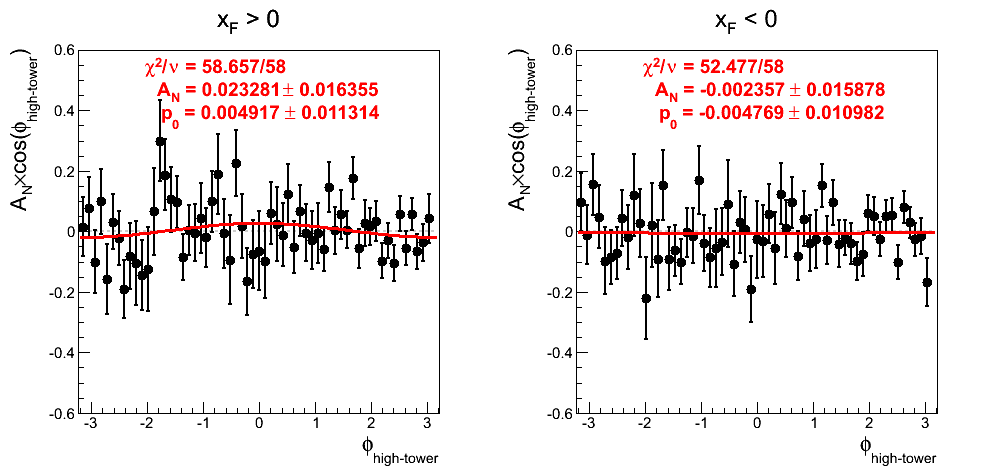
Figure 3

In Fig. 3 I show the asymmetry for high-towers from non-coincidence events. I have calculated the asymmetry from the detector-φ location of the φ-bins integrated over η-bins using the traditional difference/sum method. In this framework, the asymmetry reveals itself as a cos(φ) dependence and the p0 represents the luminosity asymmetry. I observe a 2.3% positive-xF asymmetry 1.4σ from zero. The negative-xF asymmetry is tiny and within 1σ of zero. The luminosity asymmetries are both quite small and consistent with each other and zero.
Figure 4

Figure 4 shows the background-uncorrected asymmetry for non-coincidence di-photon events integrated over xF and pT. The asymmetry is -12% and 1.05sigma from zero. The statistics are rather limited making binning difficult. That said, it is worth seeing what one can.
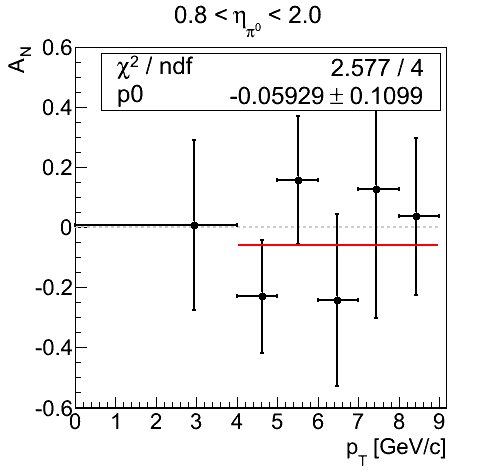
Figure 5

In Fig. 5 I post the asymmetry as a function of pT for background-uncorrected non-coincidence di-photons where all of the φS bins are populated. The distribution is fit with a constant across the relevant bins with perfectly reasonable results.
Bottom Line
For a conservative upper-limit we can take the largest of either the extracted asymmetries or their uncertainties. Then, we can assume a 50% signal fraction, which is smaller than any observed in the pT bins. In this case, we choose the -12% extraction from the integrated di-photon asymmetries which converts to 24% with the signal fraction correction. At this point, then, we can state with relative certainty
δAN < 0.002
Statistical uncertainties on a particular bin are on the order of a few percent. The smallest total systematic uncertainty on a particular bin is 0.009. Thus, in what can only be described as an overestimate of the situation, the systematic related to non-collision backgrounds is considerably smaller than total current systematics and entirely in the noise compared to statistical uncertainties.
- drach09's blog
- Login or register to post comments
