- drach09's home page
- Posts
- 2022
- 2020
- June (1)
- 2019
- 2018
- 2017
- 2016
- 2015
- 2014
- December (13)
- November (2)
- October (5)
- September (2)
- August (8)
- July (9)
- June (7)
- May (5)
- April (4)
- March (4)
- February (1)
- January (2)
- 2013
- December (2)
- November (8)
- October (5)
- September (12)
- August (5)
- July (2)
- June (3)
- May (4)
- April (8)
- March (10)
- February (9)
- January (11)
- 2012
- 2011
- October (1)
- My blog
- Post new blog entry
- All blogs
Run-11 Transverse Jets: First Look at Sivers (Full Statistics)
I have, now, integrated all statistics from Run-11 p+p 500 GeV with transverse spin polarization. Given the rather large amount of information, I will present these initial results in parts, starting with the Sivers asymmetries. Undoubtedly, new cuts will follow, as well as systematic corrections; so what is presented, here, should be in no way considered final (after all, I have not even corrected for polarization). Bin widths are denoted with horizontal "error bars." The points are plotted at the average location within the bin. I have fit each distribution with a constant, the results of which are posted in the figure. One does not expect a large effect for positive xF, nor does one expect any effect with negative xF. Thus, while mostly to guide the eye, the constant fit is not a crazy choice. One final change from previous updates is I have extended the pT bins. I have filled histograms out to pT = 100 GeV/c. I will likely need to adjust the bin widths in my next pass. However, for now, I plot asymmetries out to 50 GeV/c.
NOTE: Asymmetries are not corrected for polarization and error bars are statistical only.
Hemisphere Dependence
One useful check is to examine the asymmetries in the two hemispheres. All things being equal, the answers should be the same. However, I have not implemented a fiducial volume cut (e.g. |η| < 1), so the acceptance is different for the two hemispheres. Likely, I will need to implement such a cut in the near future.
Figure 1: Asymmetry
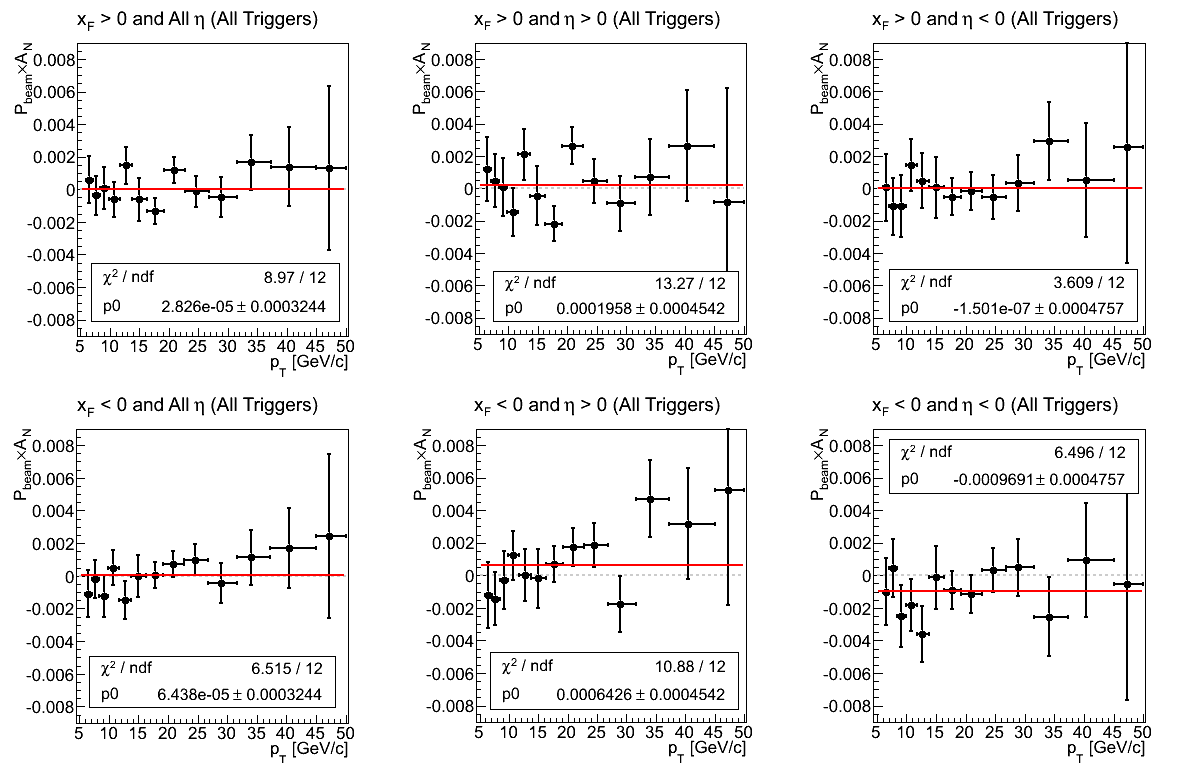
For xF > 0, integrated over η and all triggers, the distribution is perfectly consistent with 0. Breaking down into hemispheres, the same is still true. While for η > 0 there is perhaps more fluctuation than one would hope (χ2/ν = 1.11), for η < 0 there is not enough fluctuation (χ2/ν = 0.30).
For xF < 0, integrated over η and all triggers, the distribution is, again, perfectly consistent with 0. However, this time, breaking into hemispheres, the distributions show some offsets from zero. For η > 0 there is a 1.4σ positive offset. For η < 0 there is a 2.0σ negative offset. It will be worthwhile to examine these asymmetries in varying bins of η and trigger for signs of systematic effects.
Figure 2: p0 from Fit
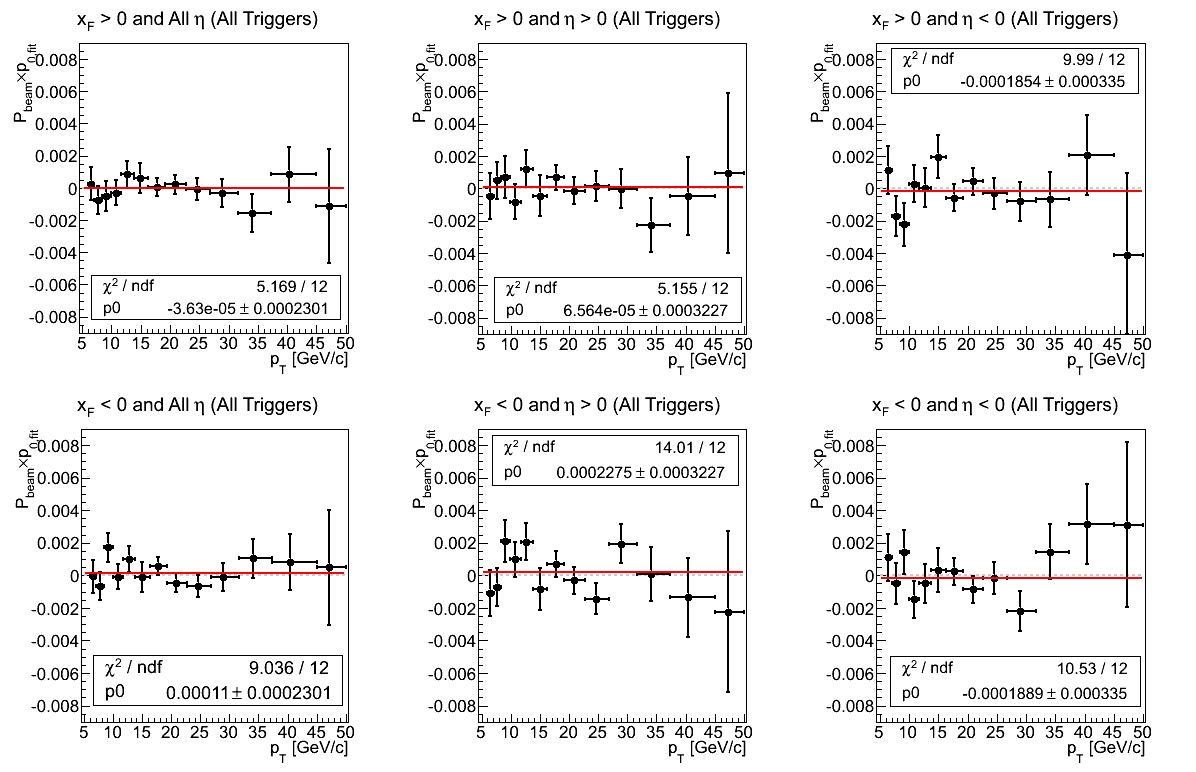
The p0's from the φS fits provide a useful statistical cross-check of this methodology. One expects the p0 to fluctuate around zero. Thus an offset may signal the presence of systematic effects.
In Fig. 2 one sees the p0 distribution integrating over η and trigger. In all cases, the constant fit is consistent with zero. In the case of xF < 0 and η > 0, one may observe a bit more fluctuation than desired (χ2/ν = 1.17), while in every other case one may not observe enough fluctuation.
Trigger Dependence
It is also useful to examine the calculations for the different triggers. One may expect consistent answers in overlap regions. Wide variations may signal systematic effects. Note, since I have implemented trigger-dependent pT thresholds not all triggers contribute in all bins. Thus, empty bins show up as simply horizontal "error bars" along y = 0.
Figure 3: Asymmetry (xF > 0)
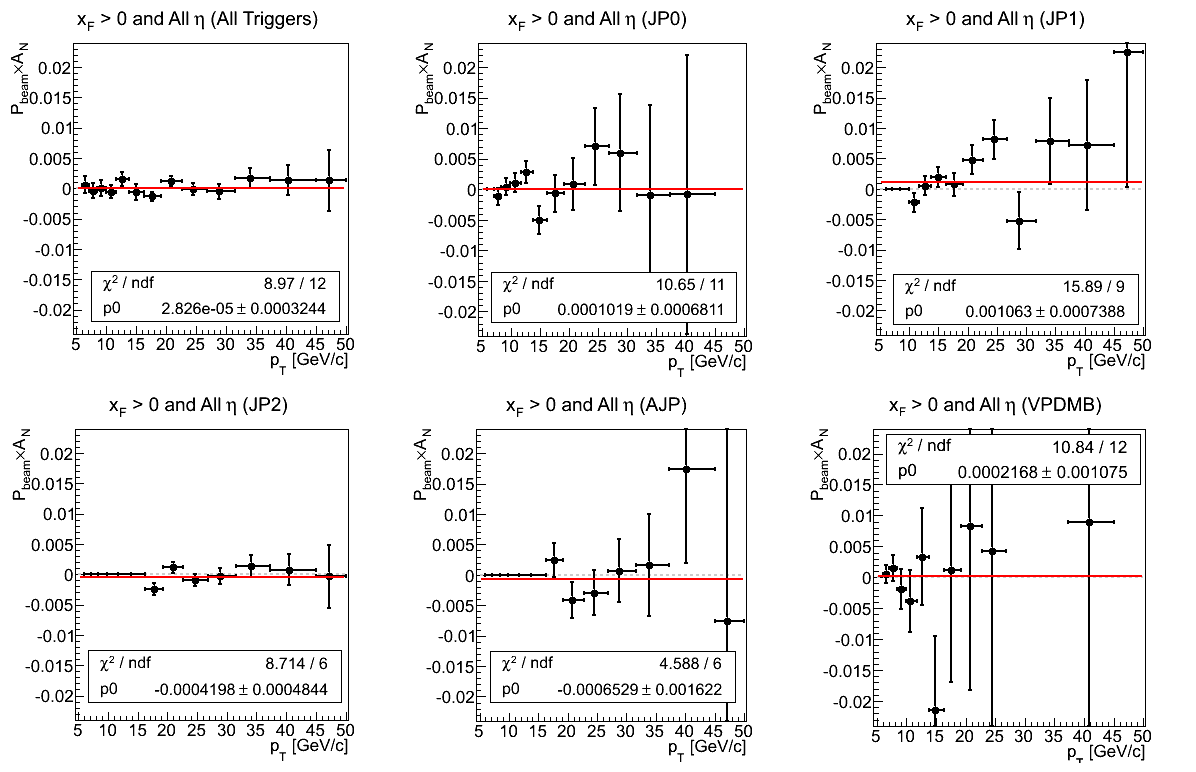
In Fig. 3 I show the asymmetry for positive xF integrated over all η broken down into the contribution of the five different triggers. I have shown a consistent vertical scale to allow one to see the different levels at which the triggers contribute. For instance, at high pT, VPDMB contributes almost nothing; and fluctuates so wildly as to be off the scale in some bins.
One sees that the constant fit is relatively sensible in most cases. In JP2, the fit returns χ2/ν = 1.45 and for JP1, the fit returns χ2/ν = 1.77. In JP2, it appears the increase in χ2/ν is due to the 7th bin. Changing the fit range to exclude this lowest bin returns 0.00027±0.00056 with χ2/ν = 2.82/5. Thus, it may be this fluctuation is due to threshold effects. It is also possible this bin contains a number of jets at higher η, which could introduce acceptance effects. On the other hand, JP1 appears to have a rather systematic positive trend at high pT. I would naïvely expect a real effect to manifest an η-dependence.
Figure 4: Asymmetry (xF < 0)
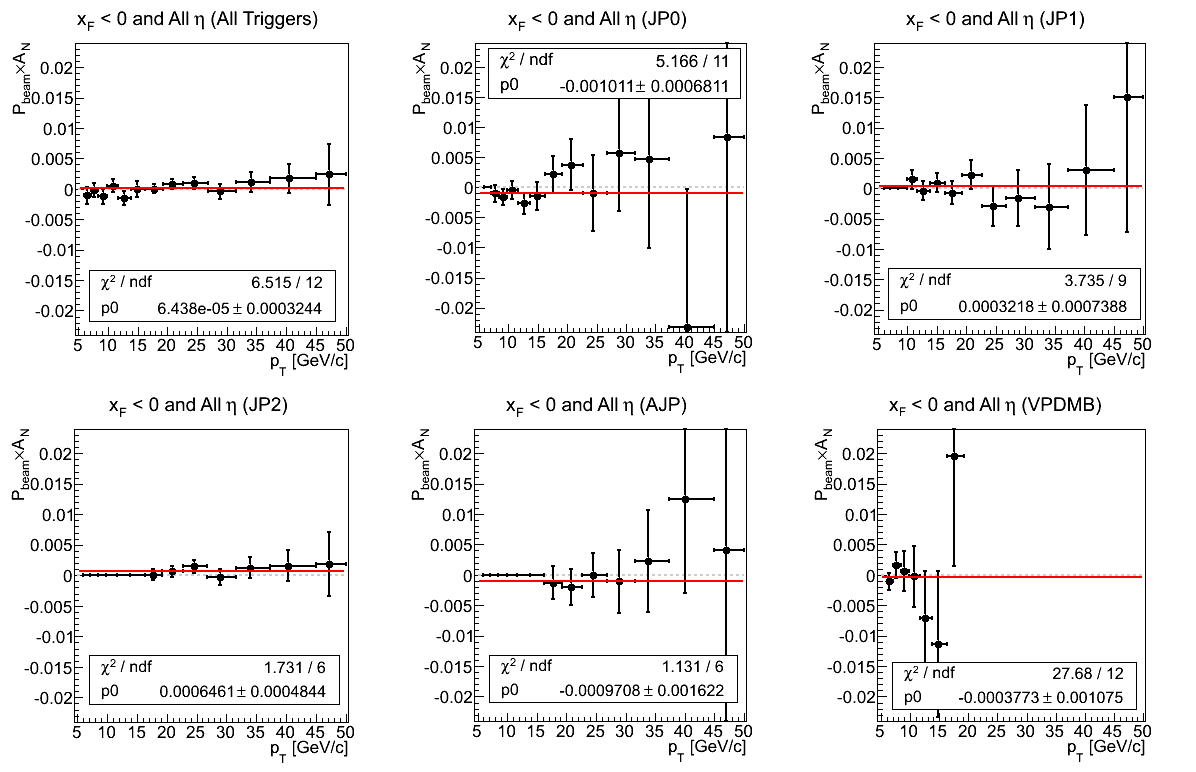
In Fig. 4 I show the asymmetry for negative xF integrated over all η broken down into the contribution of the five different triggers. One sees that, again, the constant fit is sensible (actually too good) in most cases. While VPDMB returns a horrendous fit (χ2/ν = 2.31), this is entirely due to a wild fluctuation near pT = 30 GeV/c. Fitting below this point returns -0.00031±0.00108 with χ2/ν = 5.74599/8. It will be useful to examine this bin for systematic effects. Additionally, JP0 and JP2 return systematic offsets from zero. JP0 manifests a 1.48σ negative effect, while JP2 manifests a 1.33σ positive effect. It will be useful to examine these in η bins.
Figure 5: p0 (xF > 0)
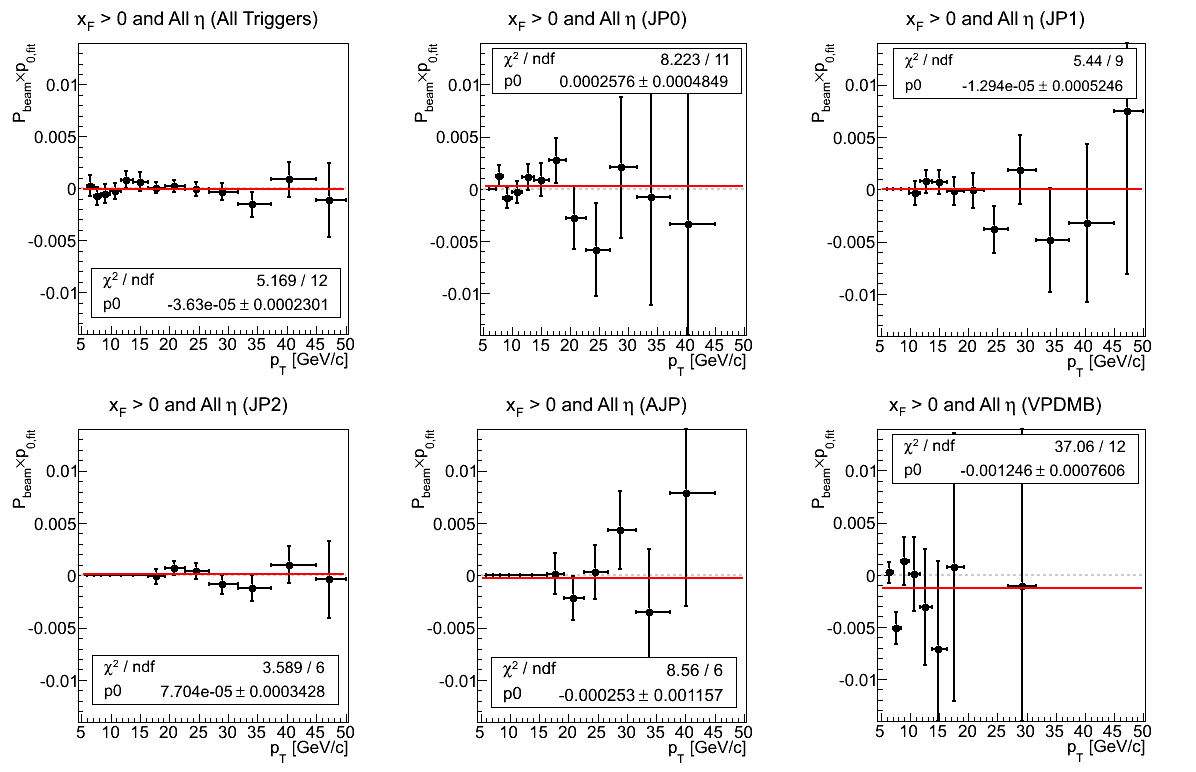
In Fig. 5 I show, now, the p0 from the positive xF asymmetry fits. The constant fit is reasonable for all but VPDMB. Here, bins 2, 8, 11, 12, and 13 show rather wild fluctuations. For AJP, the fit is also not great (χ2/ν = 1.43). This is due to bin 13 which fluctuates low. Fitting below this point returns -0.00014±0.00116 with χ2/ν = 3.28/5.
Figure 6: p0 (xF < 0)
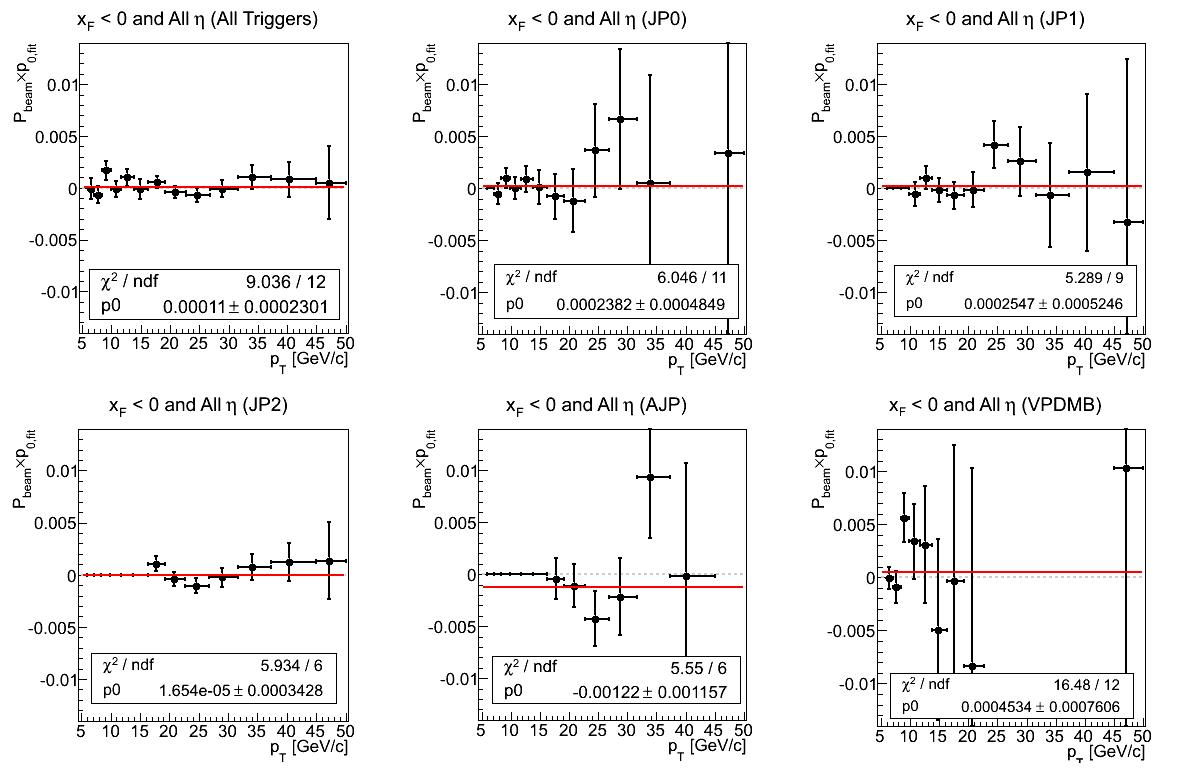
In Fig. 6 I show, now, the p0 from the negative xF asymmetry fits. Again, only VPDMB exhibits more fluctuation than one would want (χ2/ν = 1.37). This is due to fluctuations in bins 3, 10, and 12. AJP exhibits a 1.05σ negative effect.
Further Statistical Cross-checks
χ2-Distribution for Sivers Fits
Another useful means to check for hidden systematics is to examine the χ2 distribution for the Sivers asymmetry extraction.Figure 7
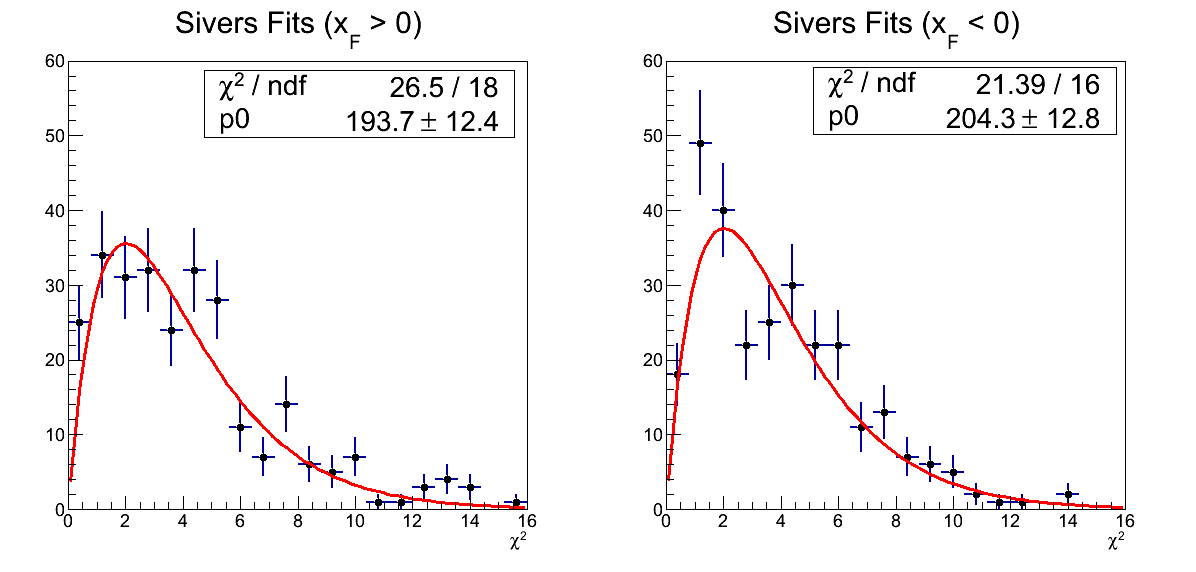
While the match to the anticipated distribution is not quite as good as previous versions, the agreement is not egregious (χ2/ν = 1.47 and 1.34, respectively). I have restricted the distribution to accept only fits with four degrees of freedom. It may improve slightly by also requiring fits to contain nonzero entries for each part term of the cross-ratio. It is also possible that this is a signature of systematics to which we are sensitive at such precision.
Distribution of Constant Fits
Given that there are so many constant fits it is difficult to grasp the bigger picture. It is perhaps informative, then, to examine the distribution of the constant fits for the individual triggers in η bins. These should be independent samples, and I would naïvely expect a normal distribution around zero in the absence of systematic effects. As some of the fits have higher precision, I have weighted the histogram entries by 1/δpar. It is possible there is a more appropriate procedure. The histograms are scaled to sum to unity for clarity.
Figure 8: Asymmetry Fits
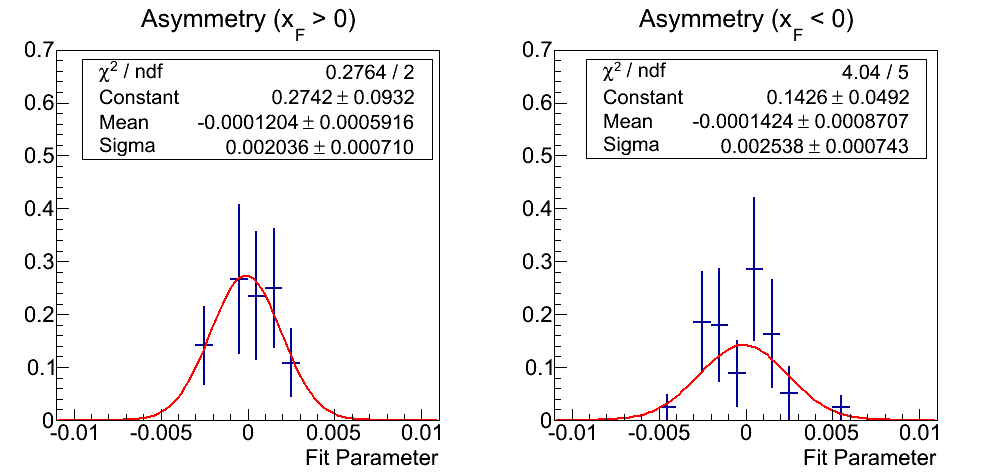
Note: click here for an unweighted version. At the end of the day, there are only 20 fits when broken up into asymmetries vs. p0's and positive and negative xF. However, the fit parameters are fairly evenly distributed about zero. The Gaussian fits return means well within 1σ of zero. The widths hover around 0.002.
Figure 9: p0 Fits
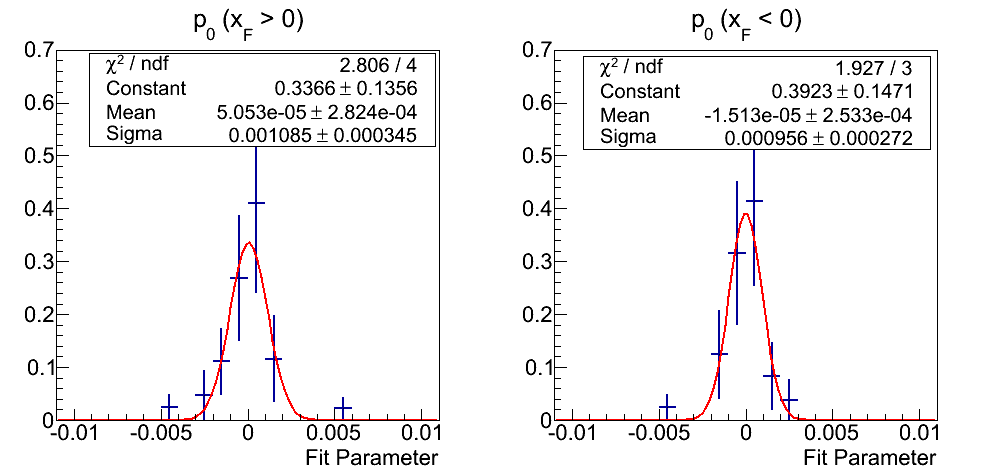
Note: click here for an unweighted version. The Gaussian fits to p0's are noticeably more sharply peaked. The means are, again, well within 1σ of zero. The widths, now, hover around 0.001.
Reduced χ2 of Constant Fits
It would be nice to examine the χ2 distribution of the constant fits, however, there are not nearly enough fits with consistent degrees of freedom for such an exercise. It may still be informative, however, to examine the reduced χ2 distribution. For this exercise I proceed in much the same way as with the fit parameter distributions, however, now without the weighting. Also, I bin in terms of χ2/ν - 1 and fit with a Gaussian, to see the deviation from zero.
Figure 10: Asymmetry Fits
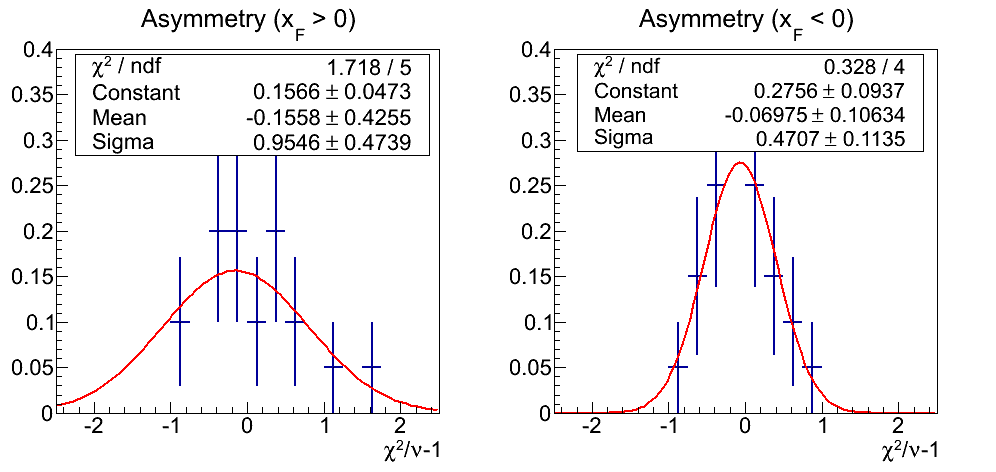
Again, there are probably insufficient fits. However, the distributions seem to scatter about 0. The Gaussian fits return means within 1σ of zero. The means are consistent with each other within the large uncertainties. Due to the huge uncertainty on positive xF one cannot say much meaningful about the widths, however, the weighted average does turn out to be 0.56 with huge uncertainty.
Figure 11: p0 Fits
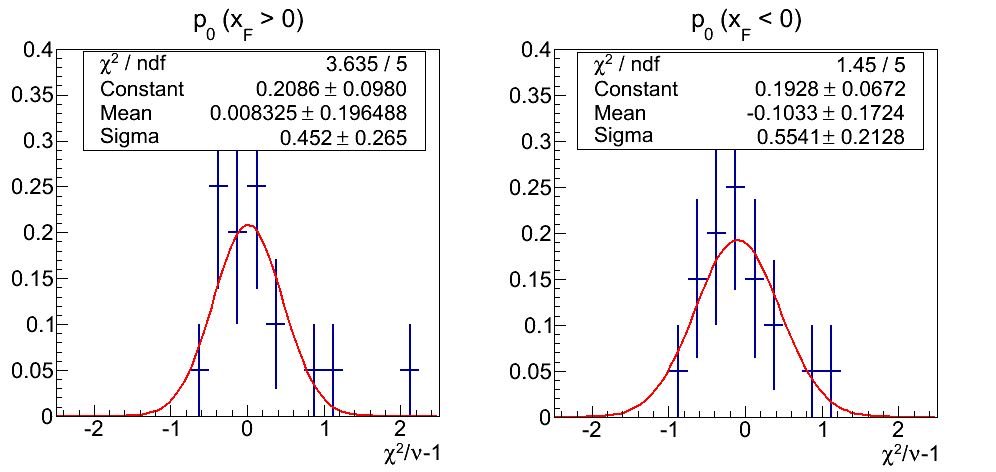
The p0 distributions are a bit more sane. The means are well within 1σ of zero. The widths hover around 0.5 (weighted average of 0.51 with still sizable uncertainty).
η Dependence
One naïvely expects a real Sivers effect to exhibit an η dependence, growing as one moves to forward scattering. Thus, it becomes useful to examine the asymmetries in bins of η. With these events, the acceptance drops quickly as one moves past η = 1. Thus, it is possible for acceptance effects to distort the picture. In the near future it will be interesting to examine the effect of a fiducial volume cut.
xF > 0
Figure 12: All Triggers
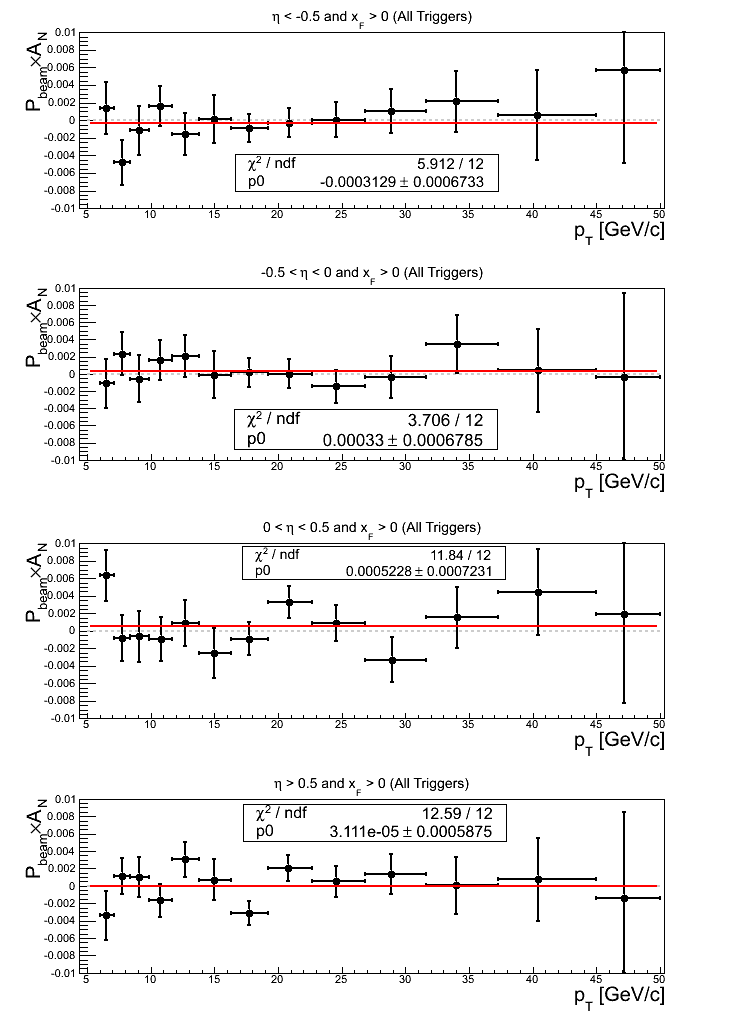
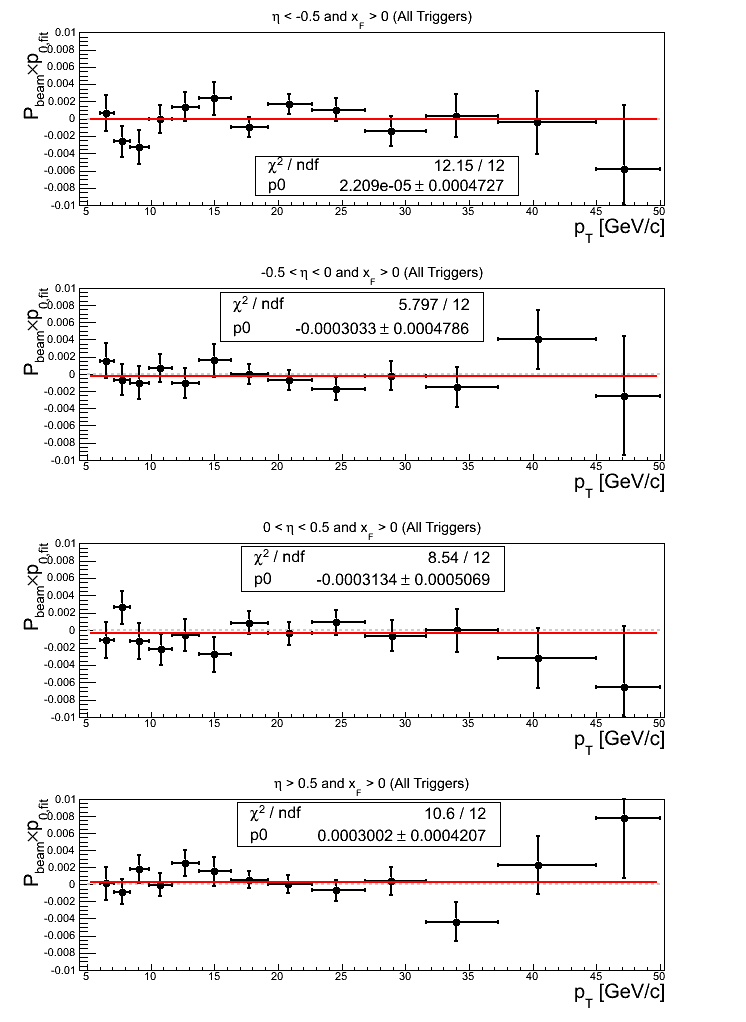
In Fig. 12 I show the asymmetries (left) and p0's (right) from asymmetry fits in η bins integrating over all triggers for xF > 0. For the asymmetries, the constant fit is everywhere consistent with zero with reasonable quality. For η > 0, bin 7 appears to be a bit low, possibly contributing to the slightly higher value of χ2/ν = 1.05. For the p0's, the constant fit is also everywhere consistent with zero with very reasonable (too good?) values of χ2/ν. Only η < 0 is greater than unity (χ2/ν = 1.01).
Figure 13: JP0 Triggers
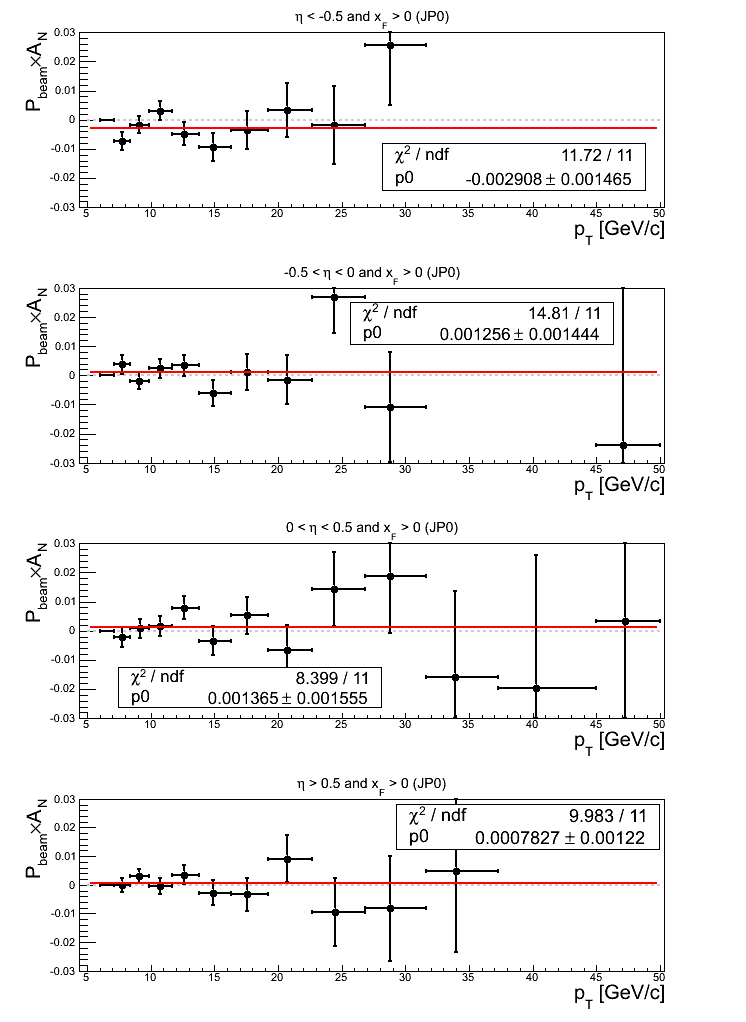
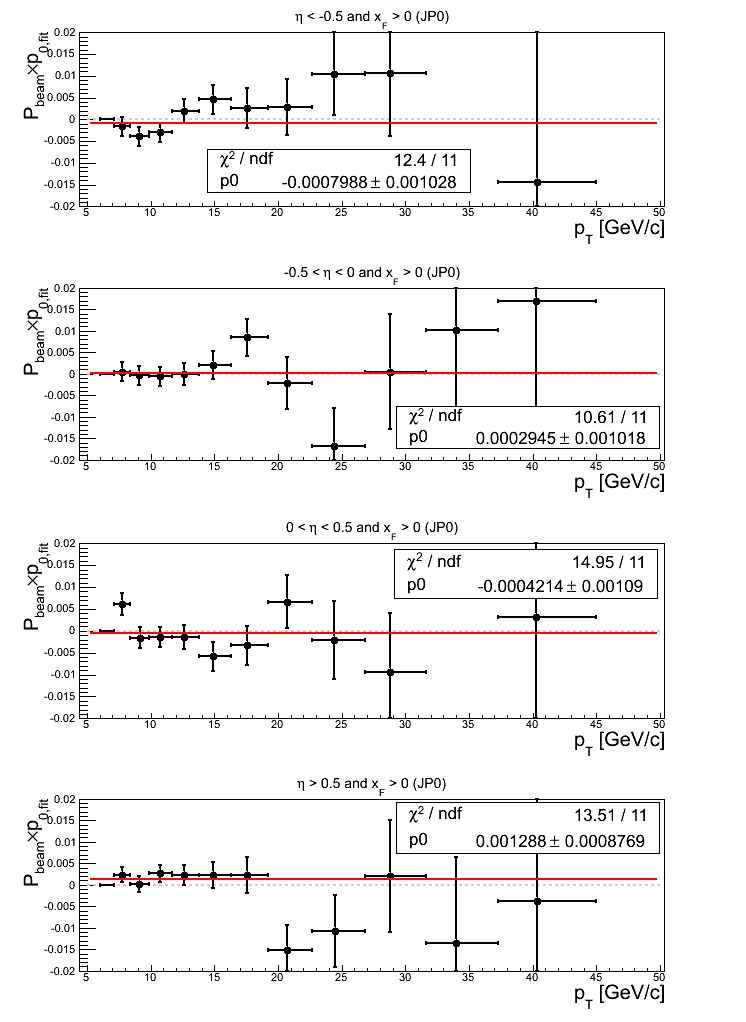
Note: click here and here for un-zoomed versions. For η > -0.5 asymmetries, the fits are consistent with zero, while for η < -0.5 the fit returns a 1.98σ negative effect. This appears largely driven by bin-2 and bin-6. Bin-2 also appears to account for most of the slightly higher value of χ2/ν = 1.07. There also appears to be a bit more fluctuation (χ2/ν = 1.35) in -0.5 < η < 0. This appears largely driven by bin-9 and bin-12.
Turning to the p0's, the fits are within a σ of zero save η > 0, which exhibits a 1.47σ positive offset. The fits also exhibit a bit more fluctuation than one might expect. The culprits appear to be bin-3 for η < -0.5, bin-2 for 0 < η < 0.5, and bin-8 for η > 0.5.
Figure 14: JP1 Triggers
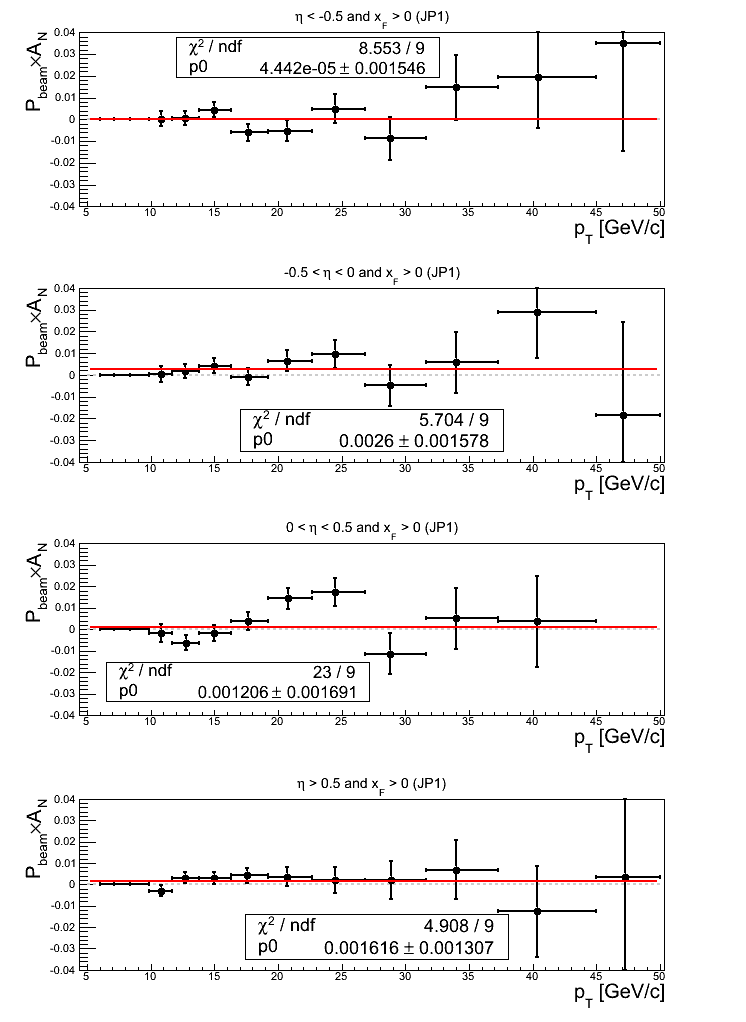
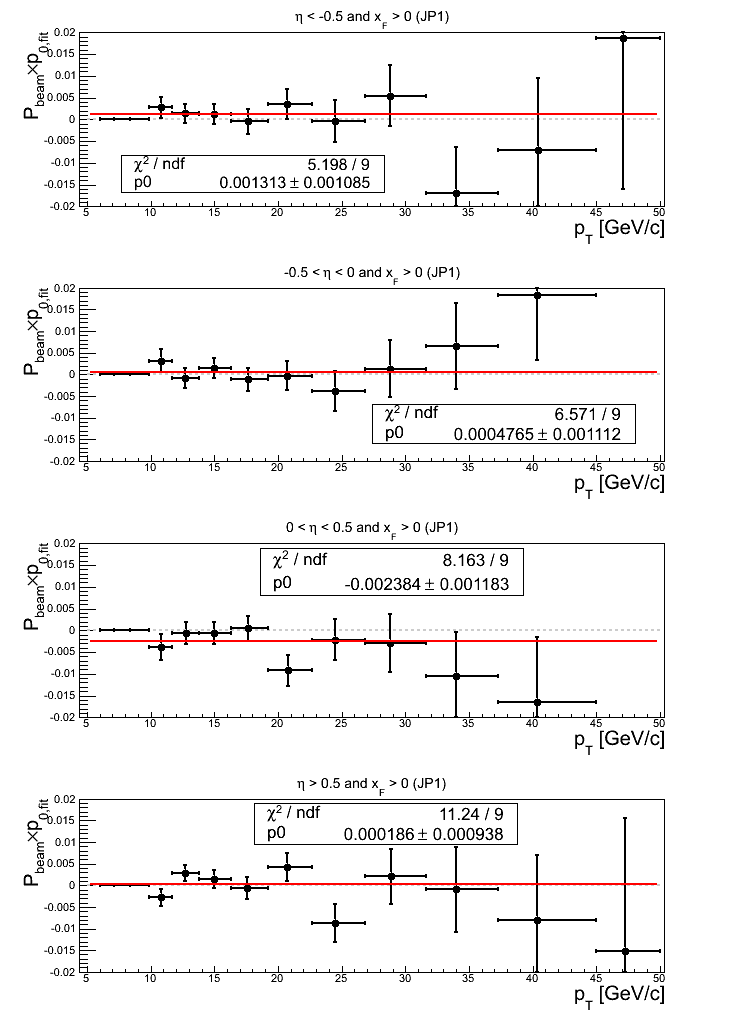
Note: click here and here for un-zoomed versions. JP1 exhibits positive offsets for -0.5 < η 0 (1.65σ) and η > 0 (1.24σ). Additionally, the fit for 0 < η < 0.5 is not good (χ2/ν = 2.56). This appears largely driven by bin-8 and bin-9.
Turning to the p0, η < -0.5 exhibits a 1.21σ positive offset; while 0 < η < 0.5 exhibits a 2.02σ negative offset. Nearly every point in 0 < η < 0.5 is below the horizontal, though, I note bin-8 is particularly low. η > 0.5 exhibits a bit more fluctuation (χ2/ν = 1.25) in part due to bin-9.
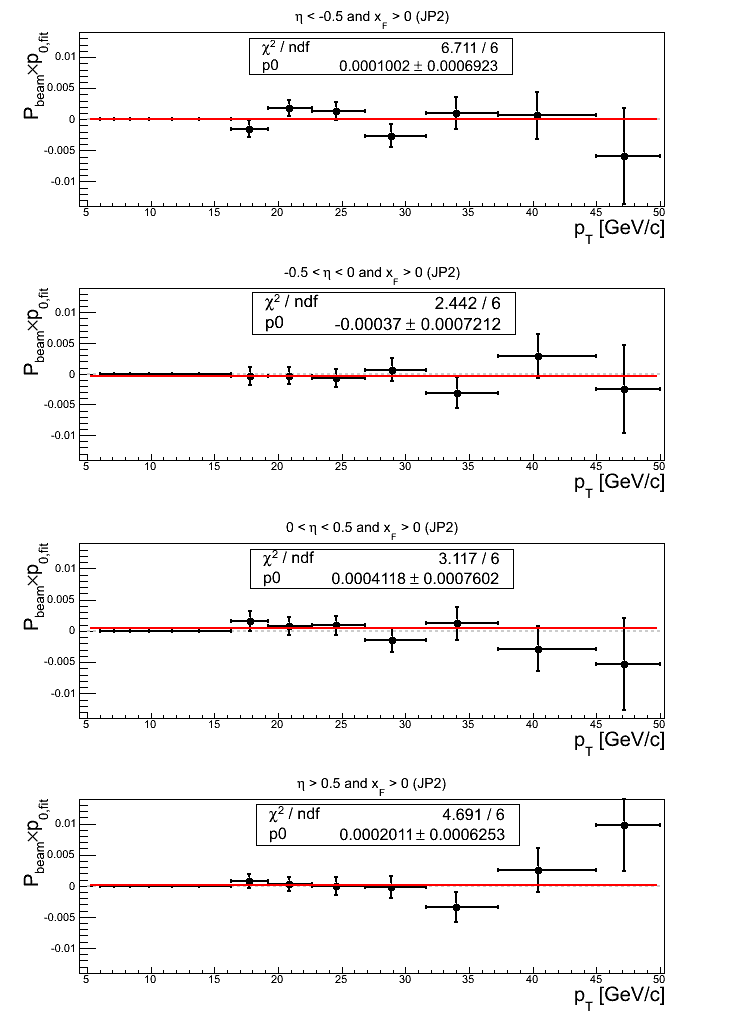
Figure 15: JP2 Triggers
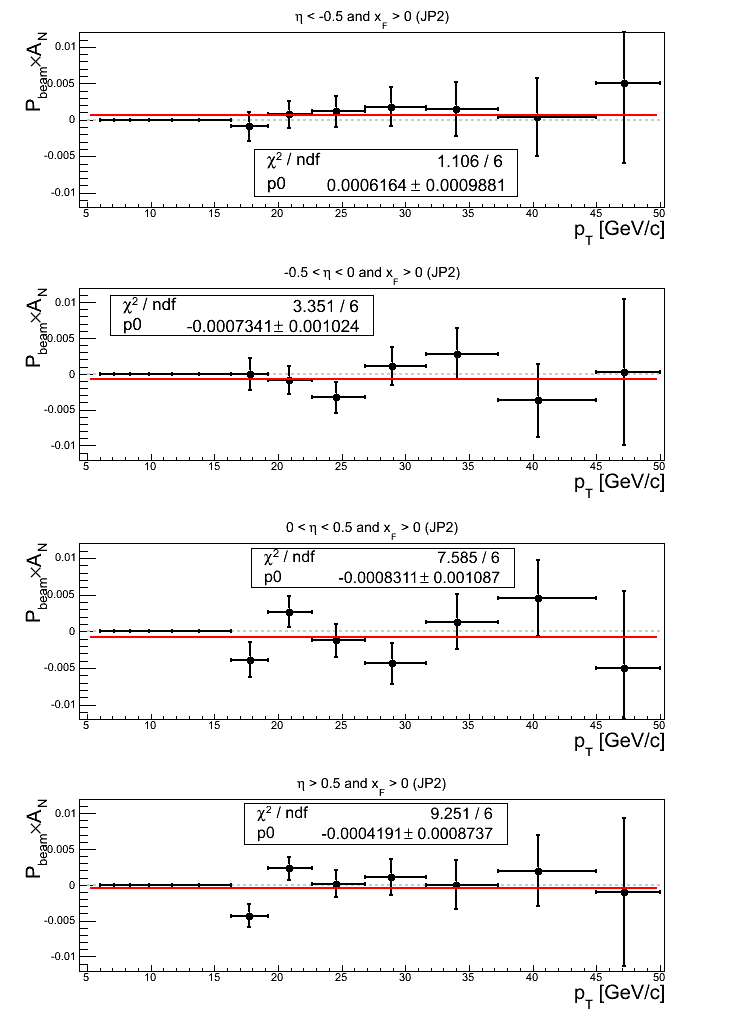
All constant fits to JP2 asymmetries are consistent with zero. The two fits for η > 0 show a bit of fluctuation with χ2/ν = 1.26 for 0 < η < 0.5 and χ2/ν = 1.54 for η > 0.5. In both cases, bin-7 contributes significantly to the increased χ2. I note that fitting above bin-7 for η > 0.5, I return a fit of 0.00120469±0.00103887 (1.16σ) with χ2/ν = 0.91/5.
Turning to the p0's, again, all fits are within 1σ of 0. The χ2's are also perfectly reasonable, with only η < -0.5 greater than 1 (χ2/ν = 1.12).
Figure 16: AJP Triggers
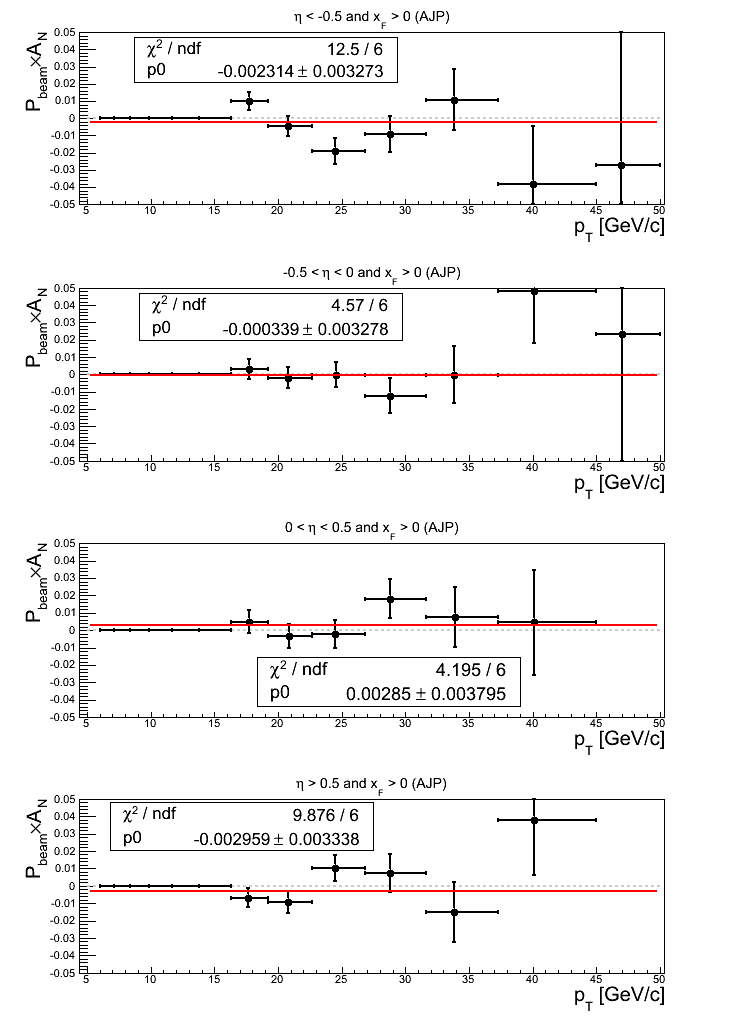
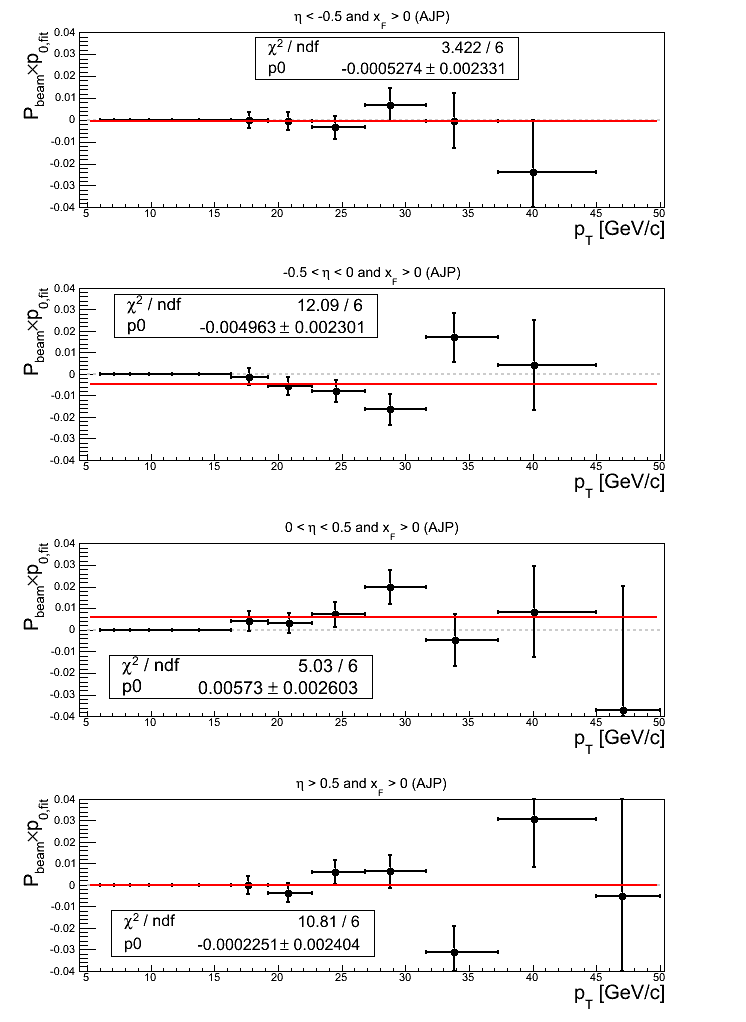
Note: click here and here for un-zoomed versions. All constant fits to the asymmetries are within 1σ of zero. The two bins for |η| > 0.5 show a bit more fluctuation with χ2/ν = 2.08 for η < -0.5 and χ2/ν = 1.65. For η < -0.5, this appears largely due to bin-7 and bin-9.
Turning to p0's, somewhat large offsets from zero manifest for -0.5 < η < 0.5. -0.5 < η < 0 shows a 2.16σ effect with a rather poor value of χ2/ν = 2.02 due in large part to bin-13 and bin-10. 0 < η < 0.5 shows a 2.20σ effect. While the χ2 is rather good, I note that bin-10 appears to be a bit high. Additionally, η > 0.5 shows a bit of fluctuation (χ2/ν = 1.80) seemingly due in part to bin-11.
Figure 17: VPDMB Triggers
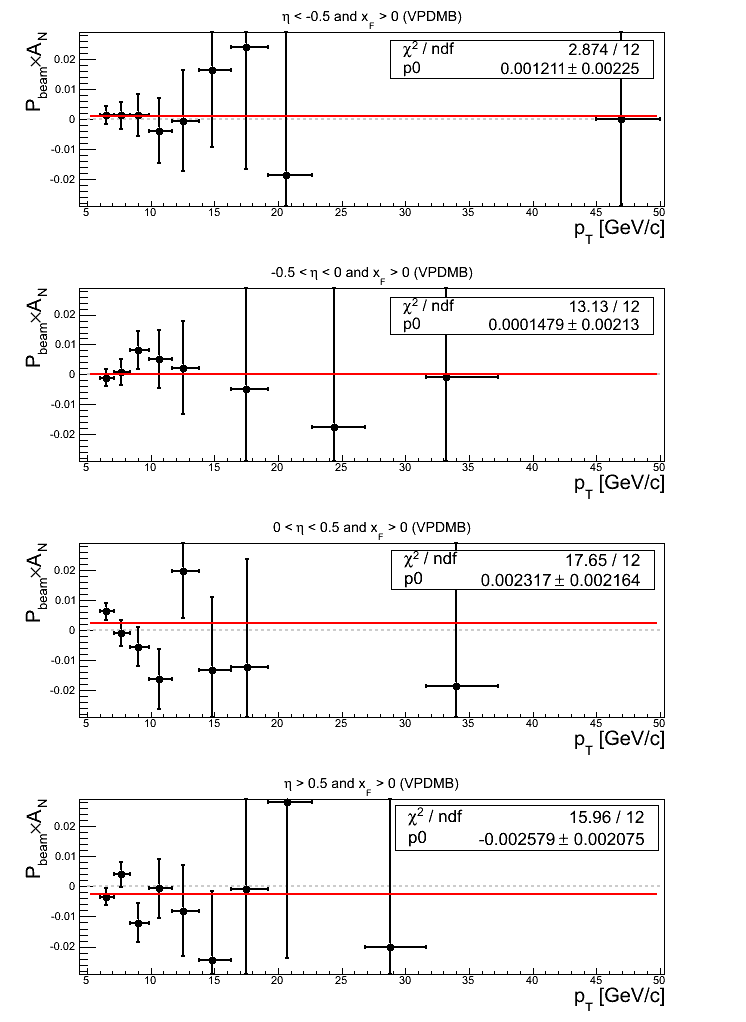
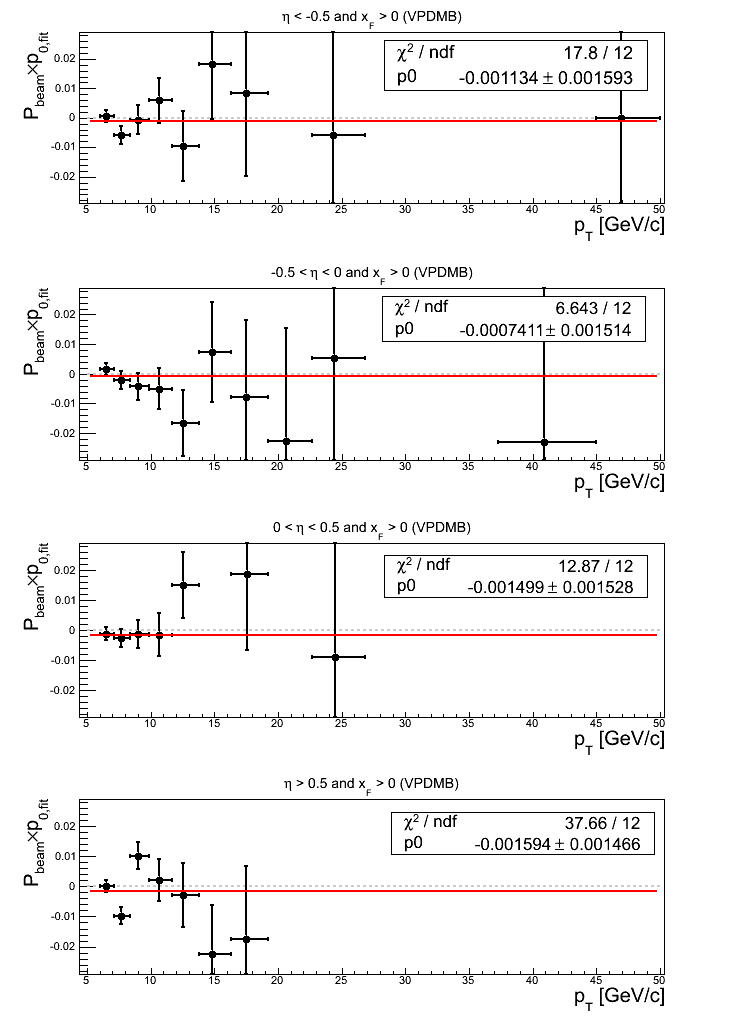
Note: click here and here for un-zoomed versions and click here and here for slightly zoomed versions. While fits to asymmetries for η < 0 are consistent with zero, fits to asymmetries for η > 0 show small offsets from zero. For 0 < η < 0.5, the fit shows a 1.07σ positive effect with χ2/ν = 1.47. The fluctuations appear to arise in large degree from bin-1, bin-12, and bin-13. I note that bin-12 and bin-13 both suffer from a severe lack of data and should be excluded. Fitting below bin-11 (also suffering from a lack of data) returns 0.00227373±0.00216406 (1.05σ) with χ2/ν = 11.7098/9 = 1.30. For η > 0.5 the fit shows a 1.24σ effect with χ2/ν = 1.33. The fluctuation appears to derive largely from bin-11, which suffers from a severe lack of data and should really be excluded. Fitting below bin-11 returns -0.00249998±0.00207484 (1.20σ) with χ2/ν = 6.49529/9.
Turning to p0's, constant fits are within 1σ of zero save for η > 0.5, which returns a 1.09σ negative effect. The fits also show a decent amount of fluctuation. For η < -0.5, the fluctuation appears largely due to bin-8 and bin-10. For 0 < η < 0.5 the fluctuation appears largely due to bin-6 and bin-8. For η > 0.5, the fluctuations appear largely due to bin-2, bin-3, bin-11, and bin-12. Bin-11 and bin-12 should be excluded due to severe lack of data. Fitting below bin-11 returns -0.00152339±0.00146572 (1.04σ) with χ2/ν = 21.3199/9 = 2.37.
xF < 0
Figure 18: All Triggers
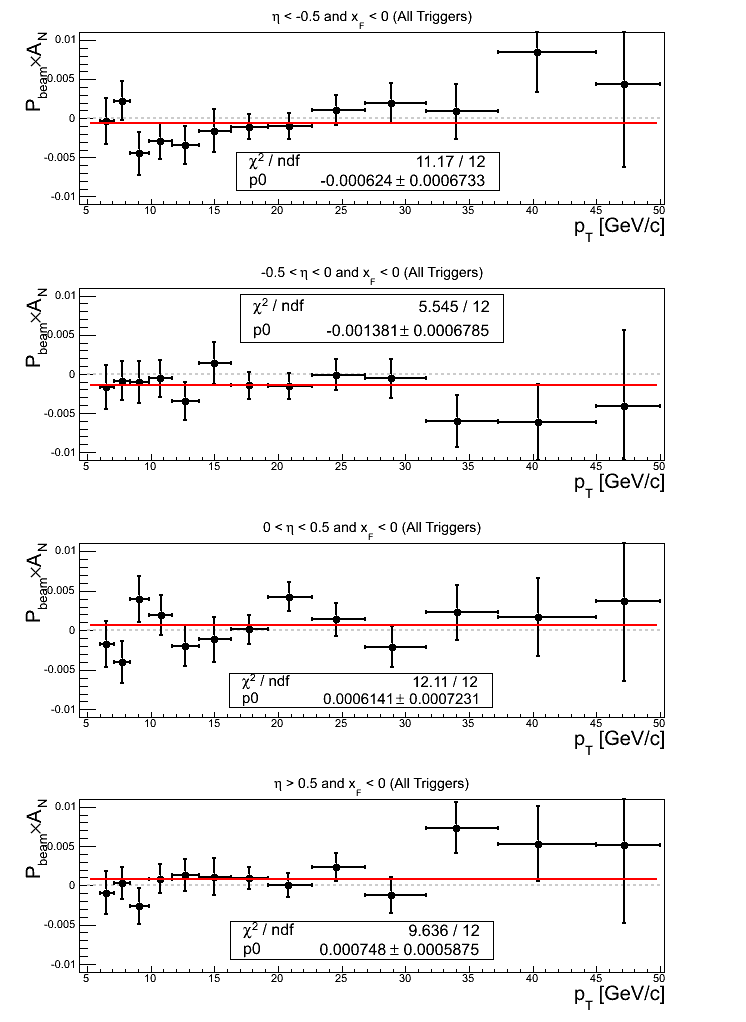
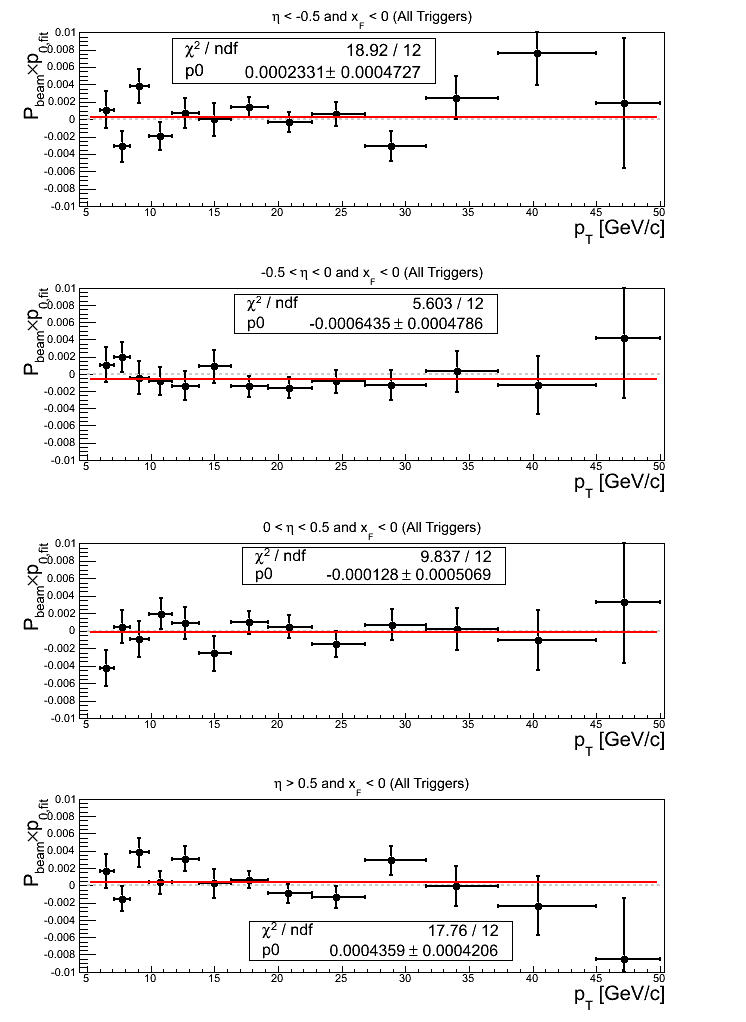
For the constant fits to the asymmetries, -0.5 < η < 0 and η > 0.5 exhibit offsets greater than 1σ. -0.5 < η < 0 exhibits a 2.04σ effect. η > 0.5 exhibits a 1.27σ effect. The fit quality is quite (too?) good.
For the constant fits to the p0's, the same two bins exhibit offsets from zero greater than 1σ. -0.5 < η < 0 exhibits a 1.34σ effect, while η > 0.5 exhibits a 1.04σ effect. The fits exhibit a bit of fluctuation for |η| > 0.5.
Figure 19: JP0 Triggers
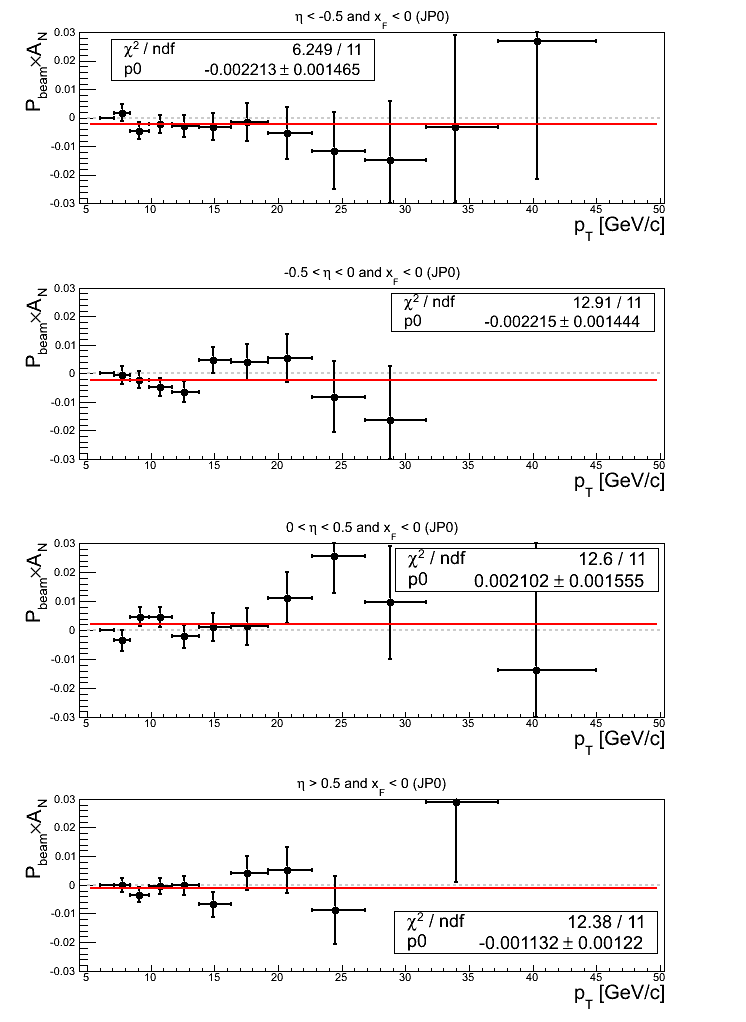
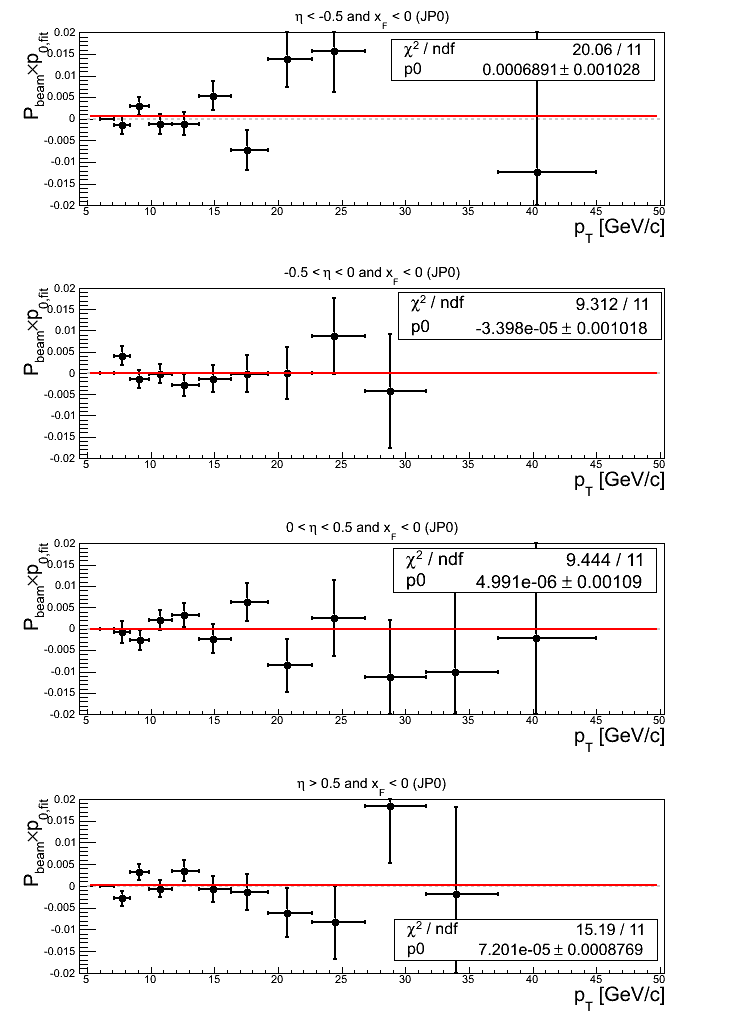
Note: click here and here for un-zoomed versions. Almost across the board, the asymmetry fits fluctuate from zero greater than 1σ. In general, the fits also exhibit χ2/ν > 1. On the other hand, the p0 fits are all within 1σ of zero. The p0 fits for |η| > 0.5 are not particularly good.
Figure 20: JP1 Triggers
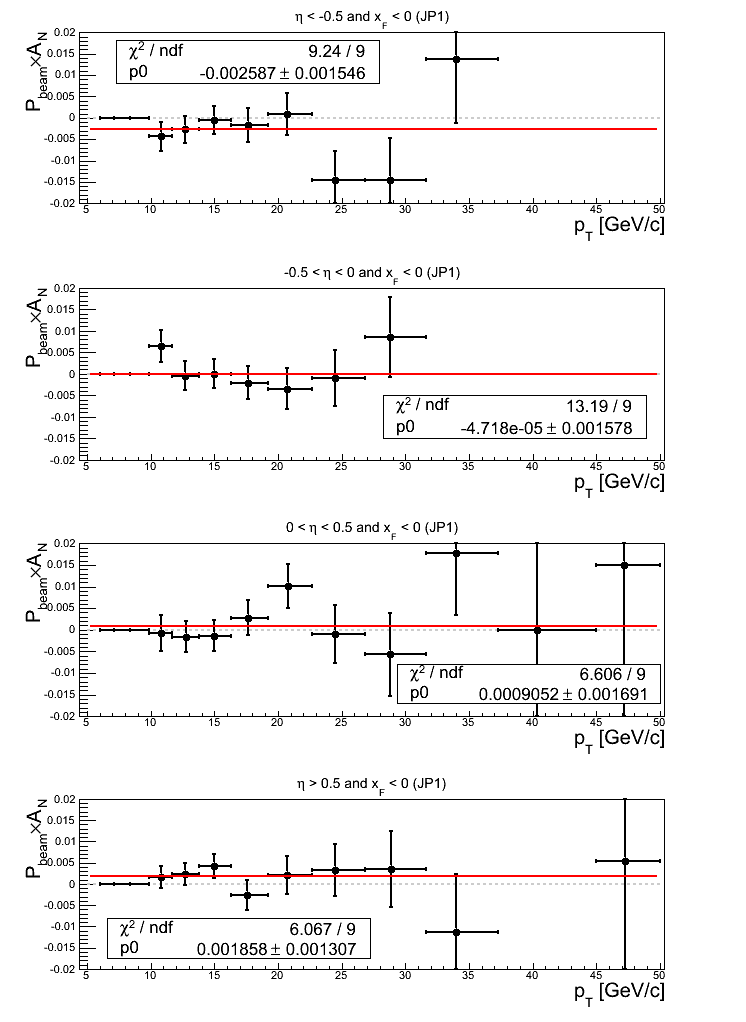
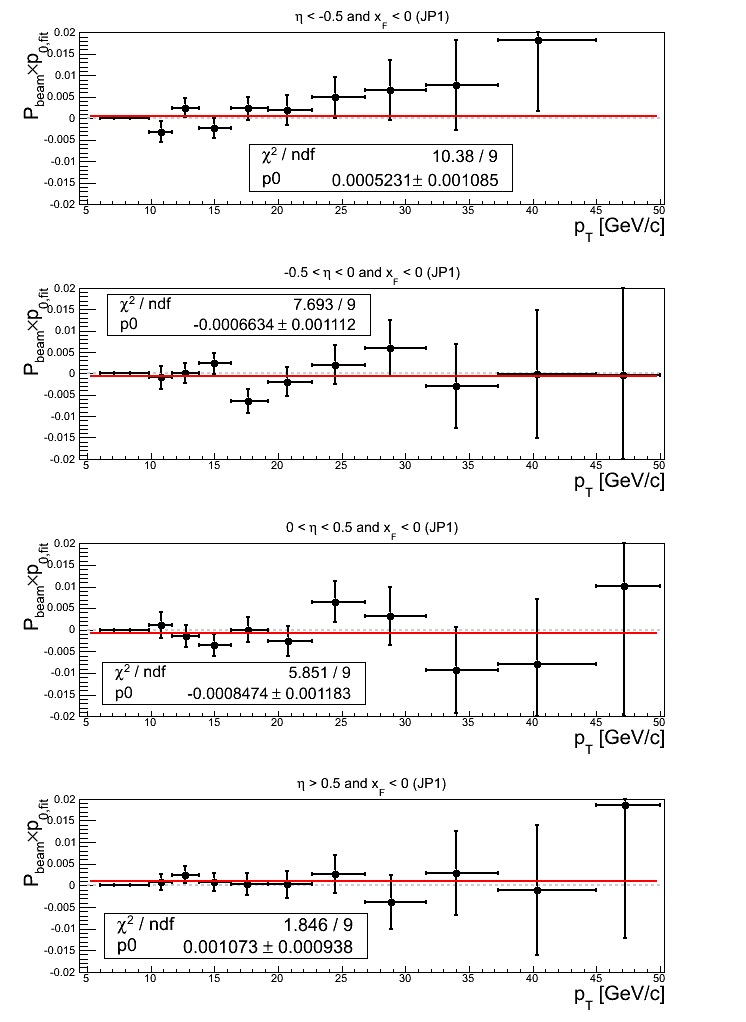
Note: click here and here for un-zoomed versions. The outermost asymmetry bins manifest offsets from zero greater than 1σ. The fit quality for -0.5 < η < 0 seems mostly affected by bin-4, bin-11, and bin-13.
Concerning the p0 fits, only for η > 0.5 is the offset greater than 1σ (1.14σ).
Figure 21: JP2 Triggers
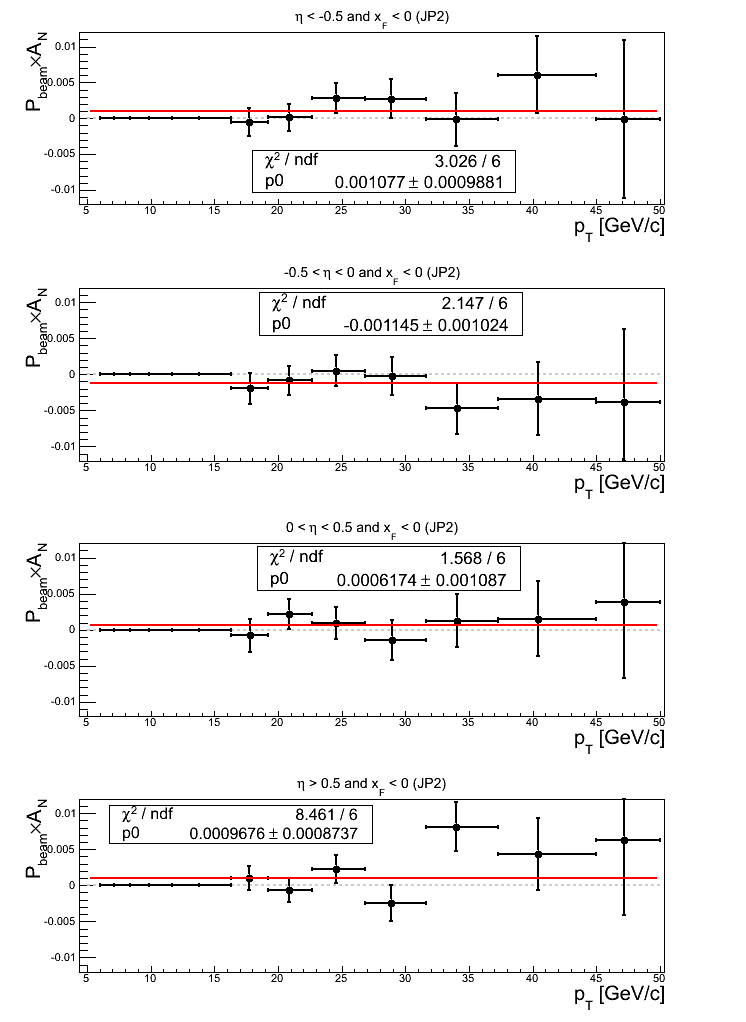
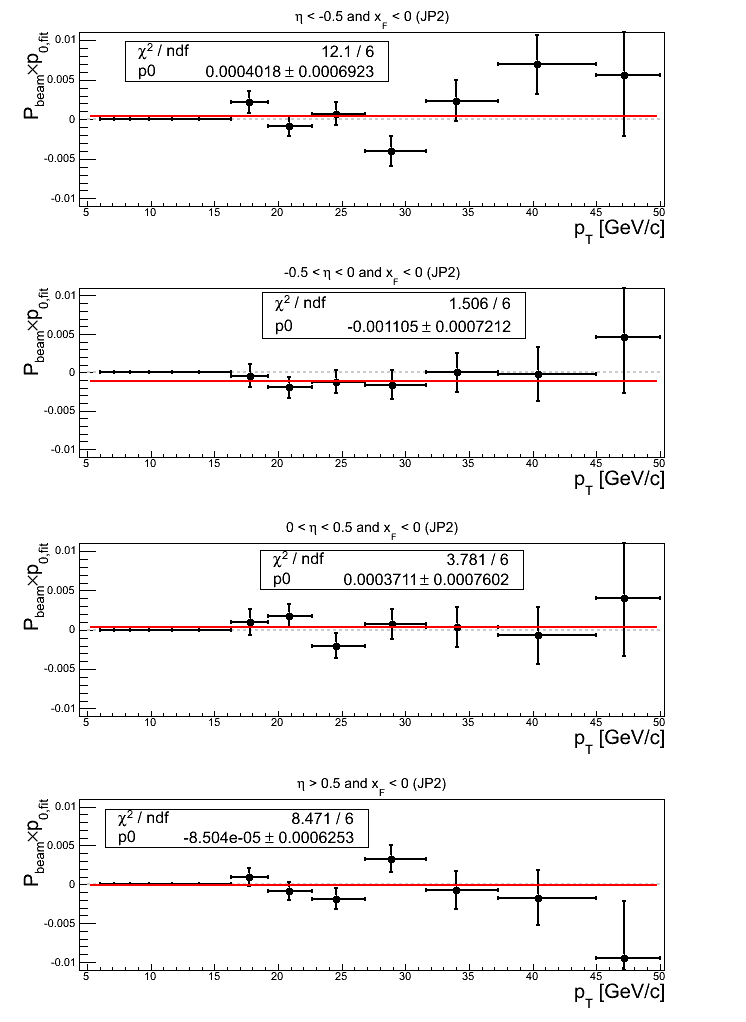
Again, almost across the board, the asymmetry fits return offsets greater than 1σ. Offsets return for η < -0.5, 1.09σ; for -0.5 < η < 0, 1.12σ; and for η > 0.5, 1.11σ. The constant fits are all too good save η > 0.5, which is largely affected by bin-11.
Concerning p0 fits, only -0.5 < η < 0 returns a value larger than 1σ from zero (1.53σ). The fit quality of η < -0.5 is not god, seemingly affected by bin-10 and bin-11. The fit for η > 0 returns χ2/ν = 1.41 seemingly affected by bin-10.
Figure 22: AJP Triggers
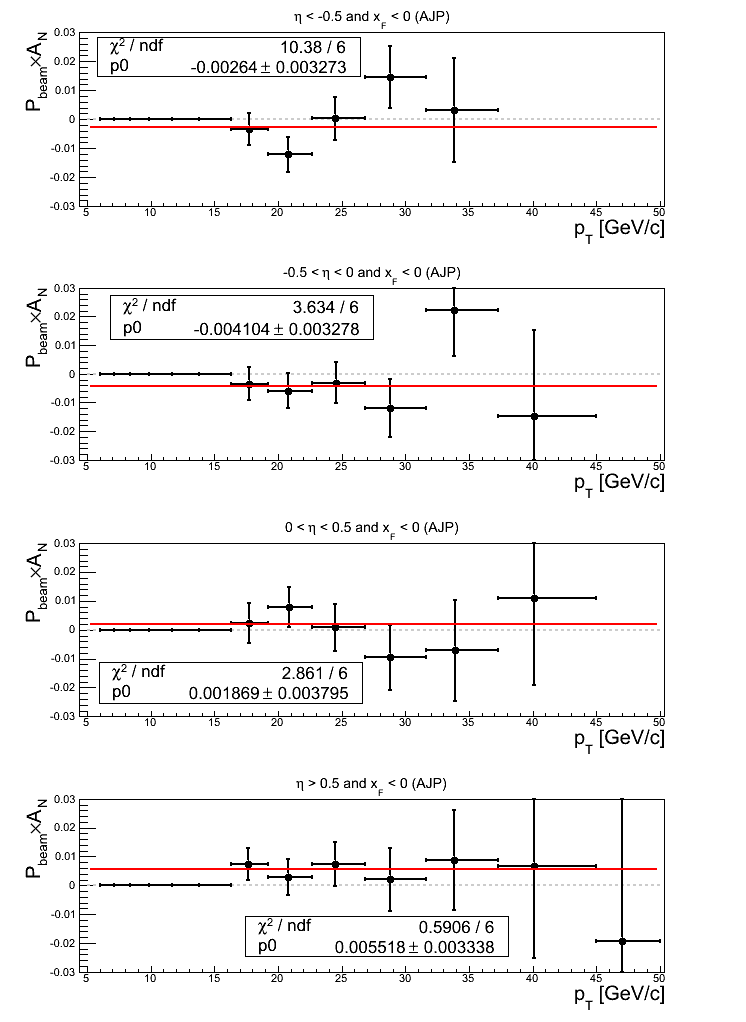
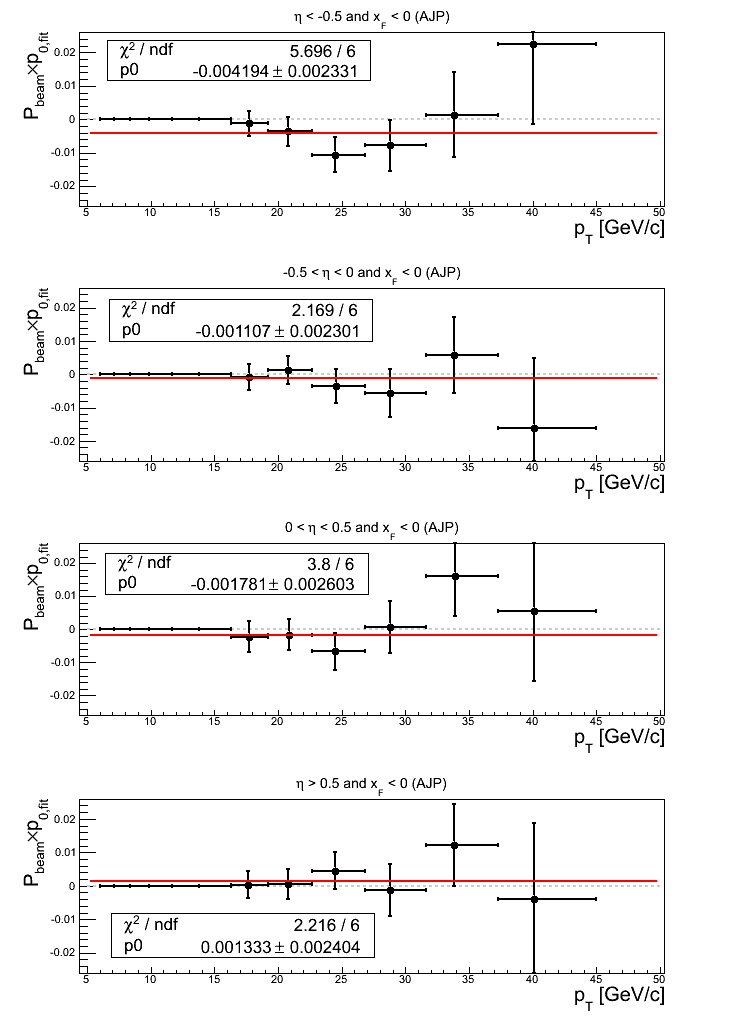
Note: click here and here for un-zoomed versions. Asymmetry fits return offsets from zero greater than 1σ for -0.5 < η < 0 (1.25σ) and &eta > 0.5 (1.65σ).
For p0 fits, only for η < -0.5 does the fit return an offset from zero greater than 1σ (1.80σ). The fits all return χ2/ν < 1.
Figure 23: VPDMB Triggers
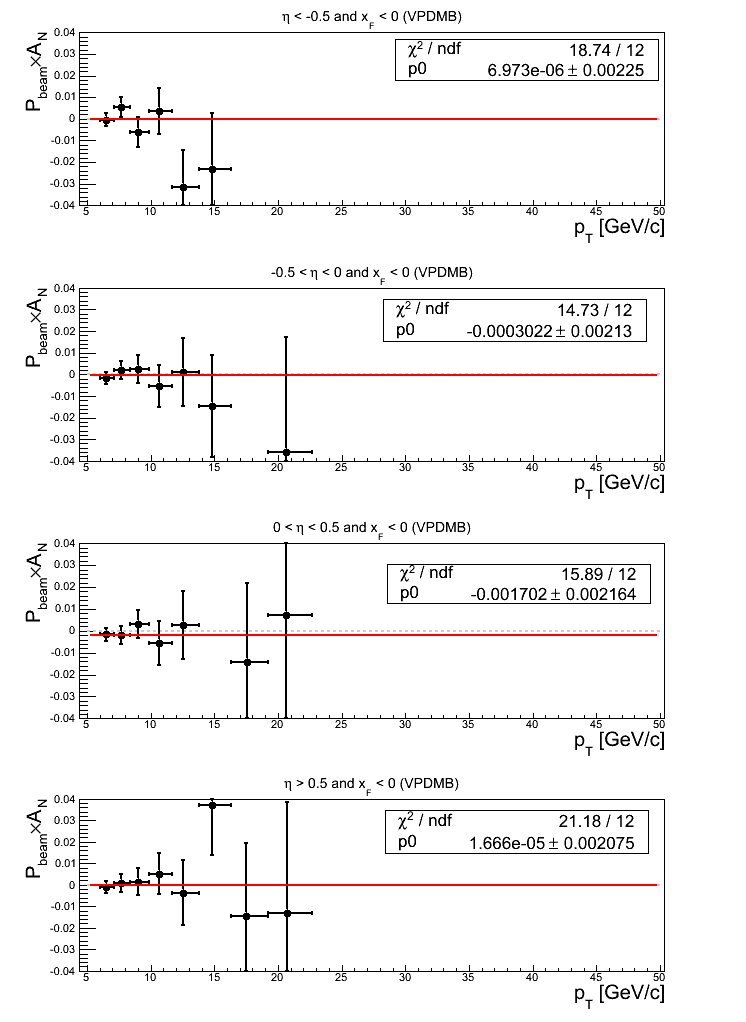
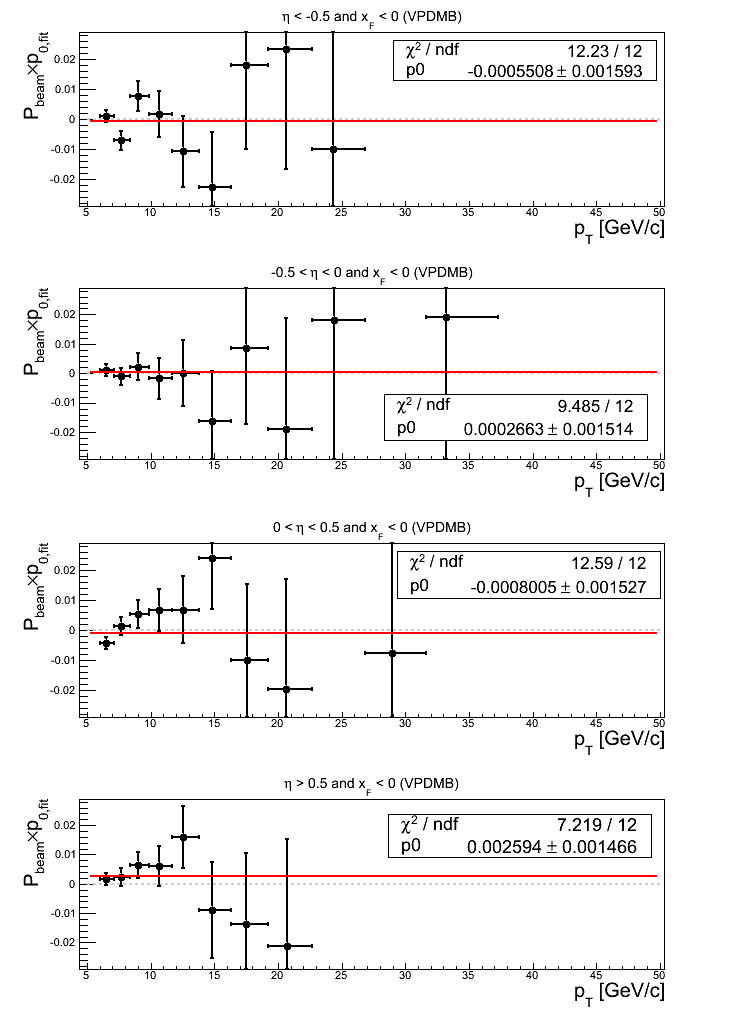
Note: click here and here for un-zoomed versions and click here and here for slightly zoomed versions. All asymmetry fits return values less than 1σ from zero, however, they also return values of χ2/ν > 1. For η < -0.5, only up to bin-9 do the distributions not suffer from severe lack of statistics. The fit through bin-9 returns χ2/ν = 10.33/8 = 1.29 (down from 1.56). For -0.5 < η < 0, bins 11-13 are statistics-limited. Bin-10, which contributes most to the χ2 appears not to be but exhibits an extreme acceptance asymmetry for a particular phi-bin. Fitting below bin-10 returns -0.000278885±0.00213094 and χ2/ν = 7.02188/8. Bin-10 appears to contribute most to the poor fit quality of the remaining η bins as well.
Turning to p0 fits, only η > 0.5 returns a value greater than 1σ from zero (1.77σ). In general, the fit quality is reasonable.
- drach09's blog
- Login or register to post comments
