- drach09's home page
- Posts
- 2022
- 2020
- June (1)
- 2019
- 2018
- 2017
- 2016
- 2015
- 2014
- December (13)
- November (2)
- October (5)
- September (2)
- August (8)
- July (9)
- June (7)
- May (5)
- April (4)
- March (4)
- February (1)
- January (2)
- 2013
- December (2)
- November (8)
- October (5)
- September (12)
- August (5)
- July (2)
- June (3)
- May (4)
- April (8)
- March (10)
- February (9)
- January (11)
- 2012
- 2011
- October (1)
- My blog
- Post new blog entry
- All blogs
Run-11 Transverse Jets: First Look at Collins-like vs. Track Relative Transverse Momentum (Full Statistics)
Following up on previous updates, I now show the sate of the Collins-like vs. jT analysis after integrating the full statistics. As before, this should in no way be considered final. Very few cuts have been implemented at this point, and hopefully this analysis will motivate a sensible set.
As before, each plot is fit with a constant. For negative xF and for p0 distributions, this is a sensible expectation. One may hope to see a signal for positive xF, and comparing to a constant may illuminate such a variation.
NOTE: Asymmetries are not corrected for polarization and error bars are statistical only.
Figure 1: Angular Coverage
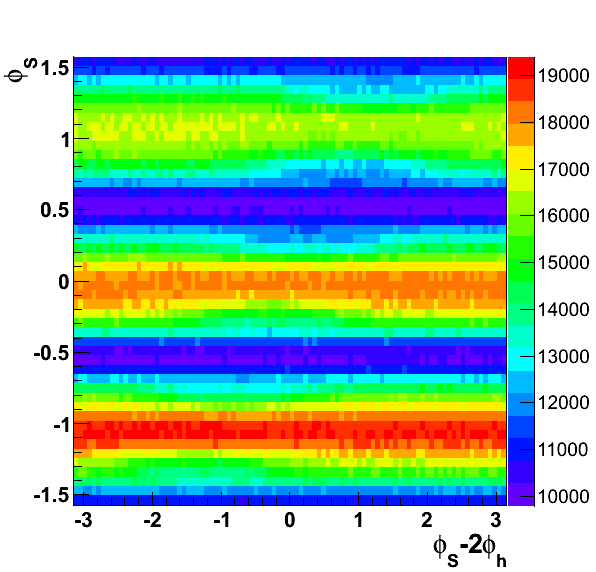
As a reminder, I show the angular coverage of φS vs. φS-2φh. One can see the coverage is rather similar to what one sees for the Collins angle.
Hemisphere Dependence
One useful check is to examine the asymmetries in the two hemispheres. All things being equal, the answers should be the same. However, I have not implemented a fiducial volume cut (e.g. |η| < 1), so the acceptance is different for the two hemispheres. Likely, I will need to implement such a cut in the near future.
Figure 2: Asymmetry (π+)
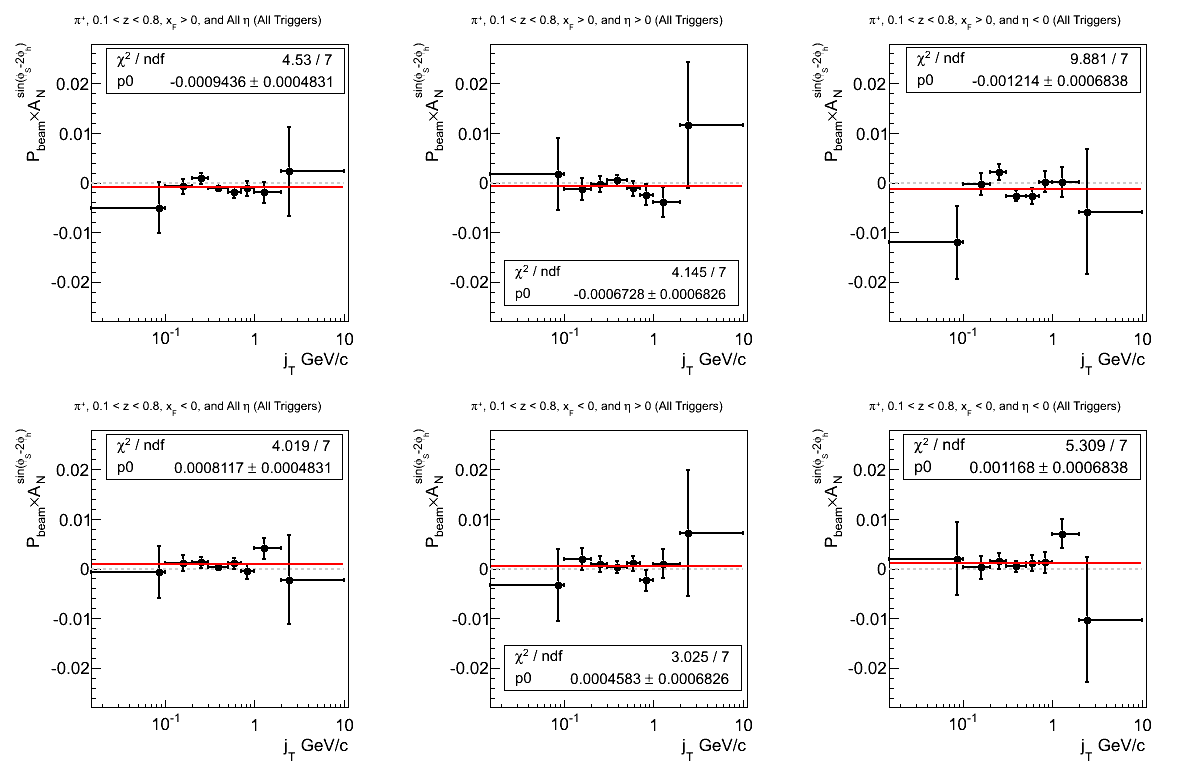
Earlier, we saw an offset of 2.65σ with respect to z in positive xF. Now, as we integrate over part of the z-range, we see a less significant offset (1.95σ). Only for negative η is the offset greater than 1σ (1.78σ). Additionally, one sees a 1.68σ positive offset for negative xF where one expects no physical asymmetry. Again, the offset seems relegated to negative η (1.71σ). So, again, I urge caution with drawing firm conclusions about the presence of effects at this early stage.
Figure 3: Asymmetry (π-)
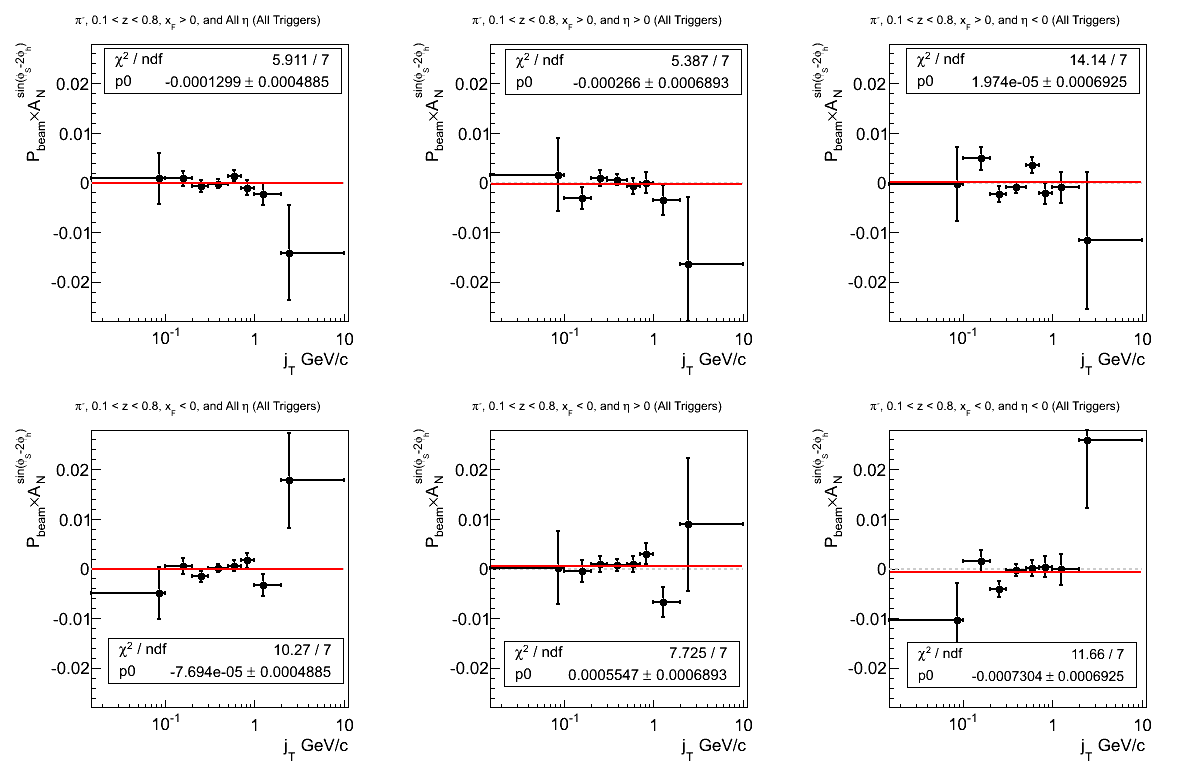
Again, the constant fits for π- all seem consistent with zero. However, the fit quality seems a bit worse than one might expect.
Figure 4: p0 from Fit (π+)
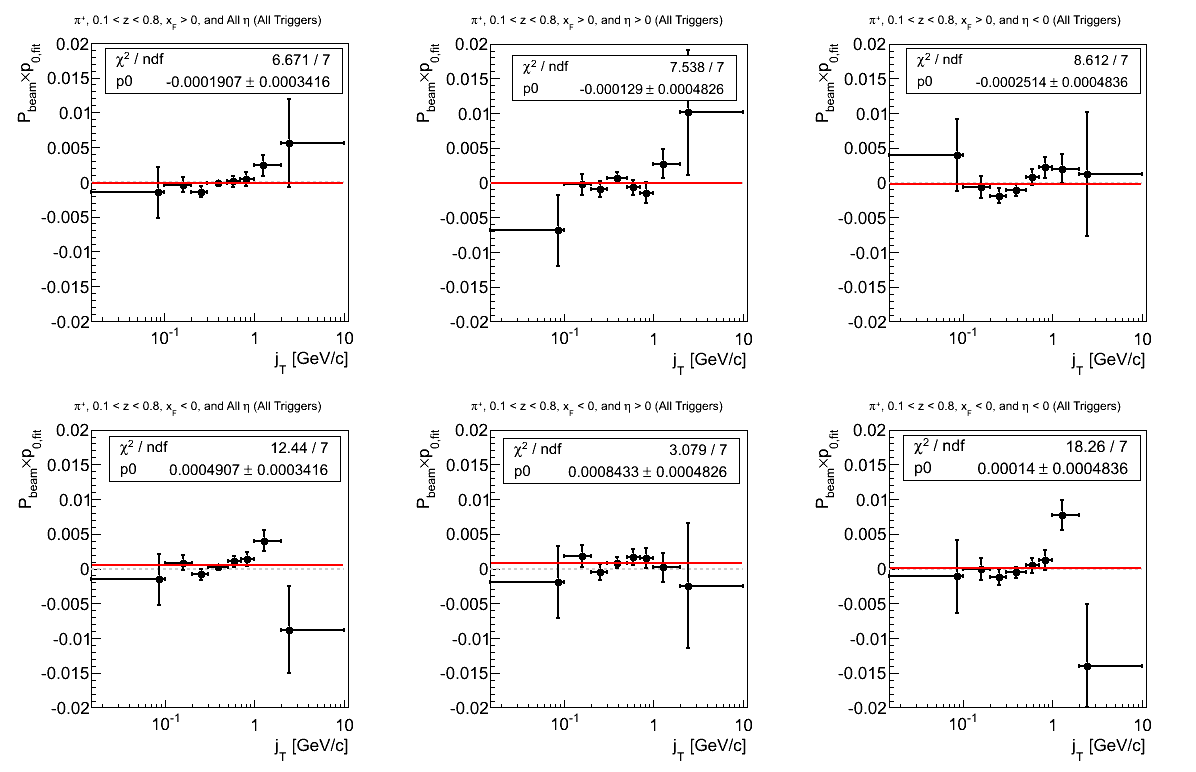
Again, the fit quality is not quite what one would hope, now, for p0's. For negative xF and positive η, the fits seems systematically high, while for negative η the fits simply look bad. For negative xF, this seems largely driven by the point near 1 GeV/c.
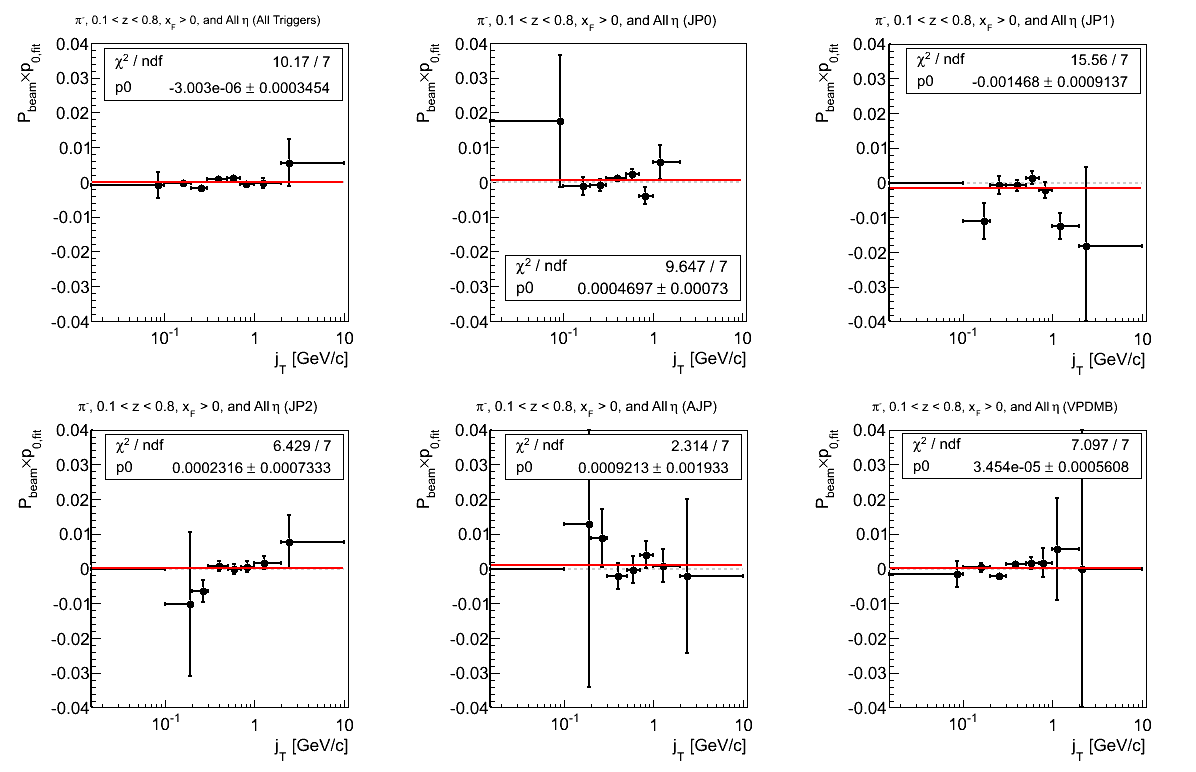
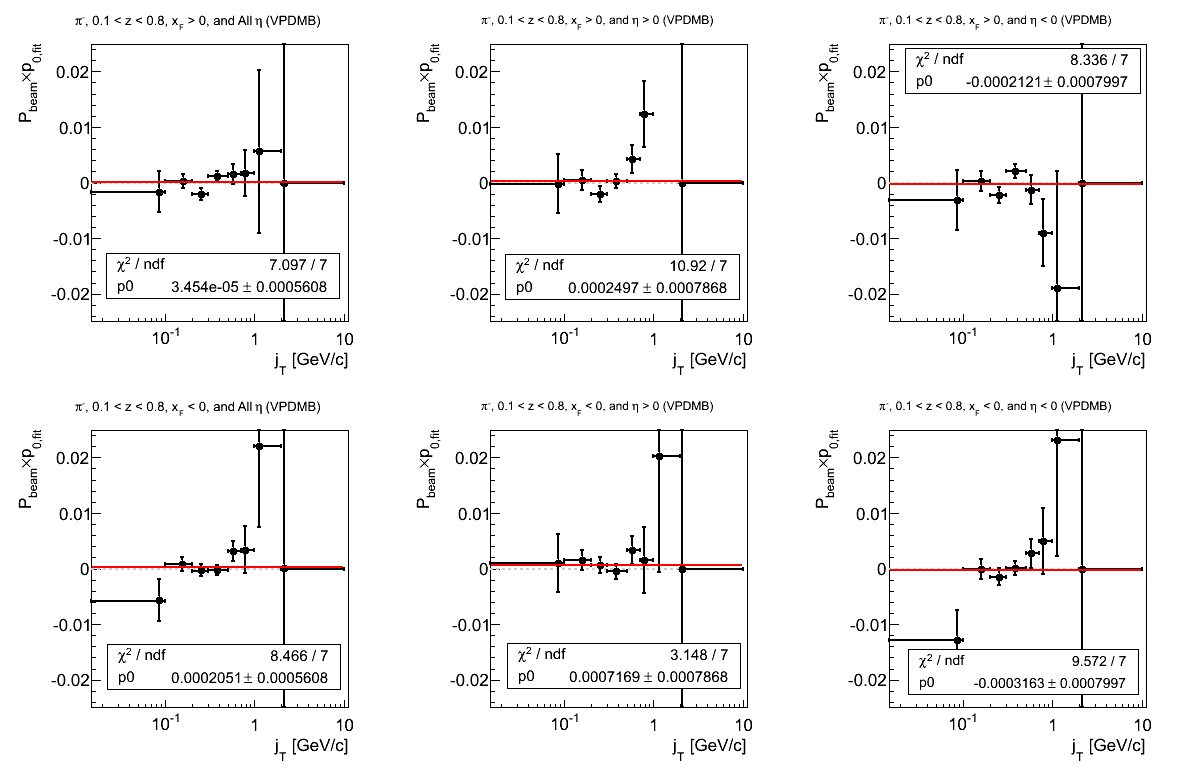
Figure 5: p0 from Fit (π-)
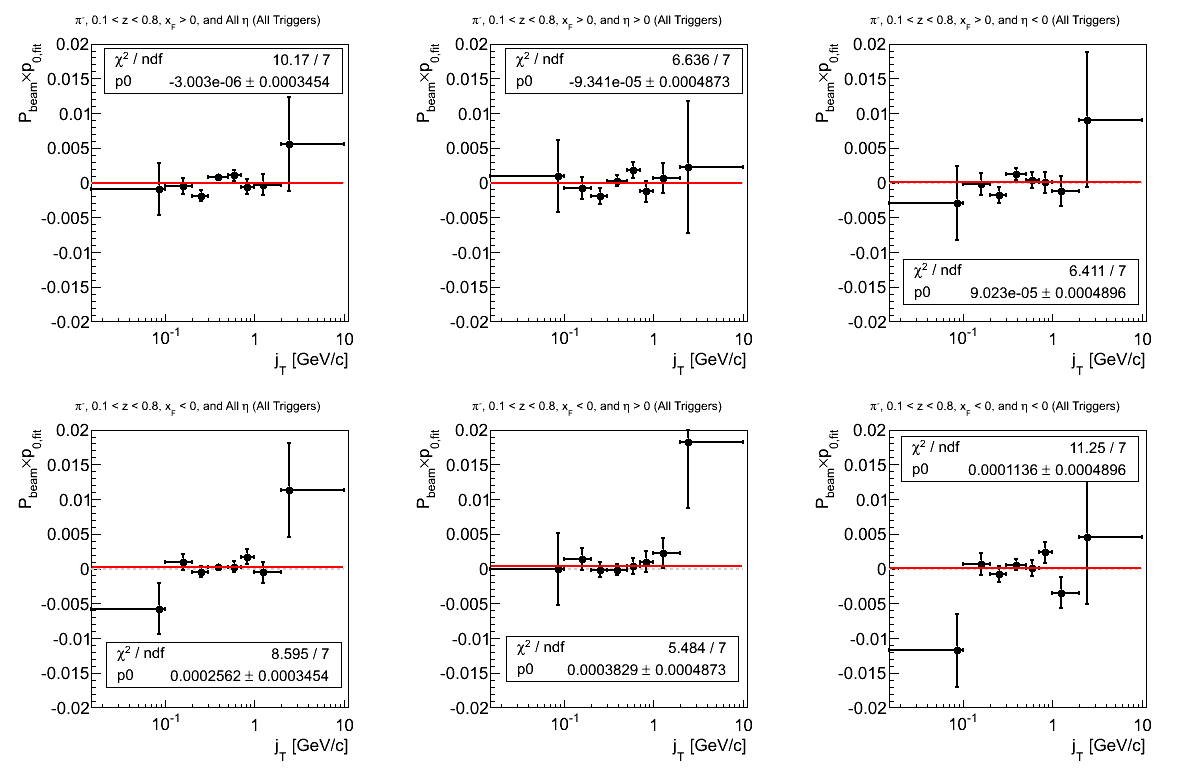
The story with π- is a bit better than that of Fig. 4. Again, there is a bit more fluctuation for negative xF and η. Some of this is due to the lowest bin, where undoubtedly we are bumping up against kinematic limits. Some rebinning may be in order.
Trigger Dependence
It is also useful to examine the calculations for the different triggers. One may expect consistent answers in overlap regions. Wide variations may signal systematic effects.
xF > 0
Figure 6: Asymmetry (π+)
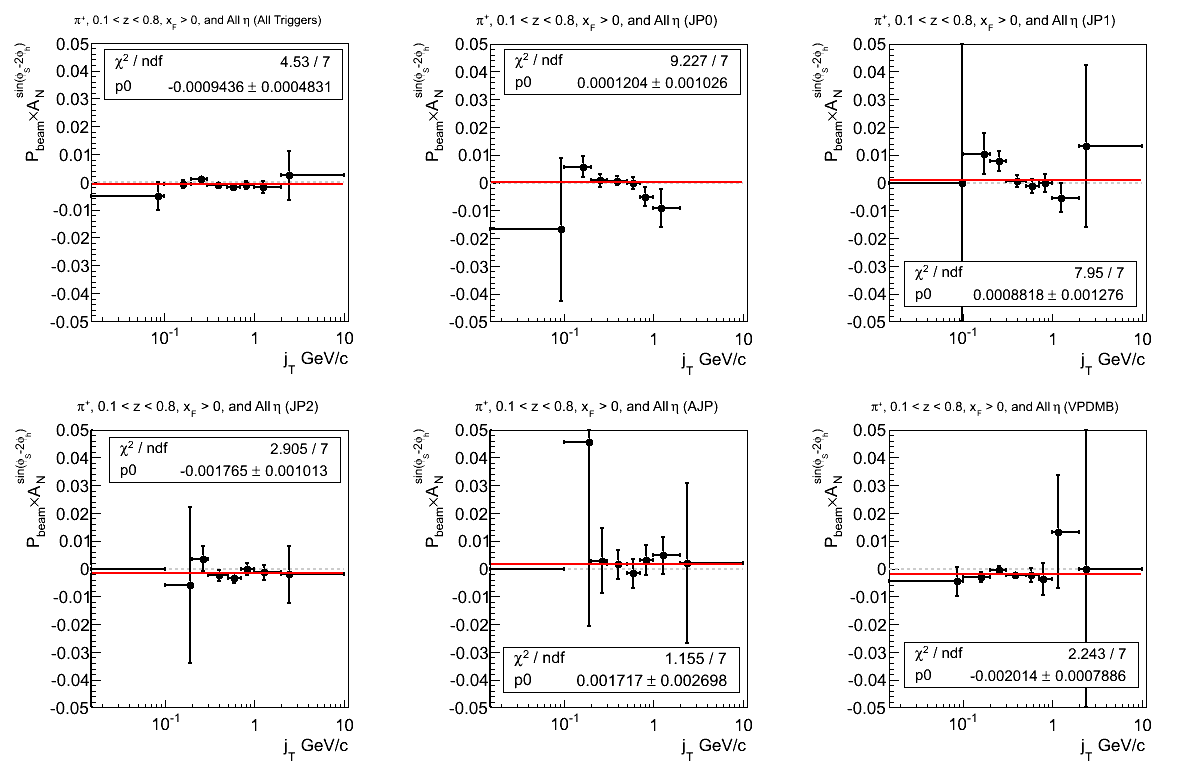
The offset tends to fluctuate in the various trigger contributions. A negative offset is reflected only in JP2 (1.74σ) and VPDMB (2.55σ). JP2 and VPDMB also suggested negative offsets with respect to z.
Figure 7: Asymmetry (π-)
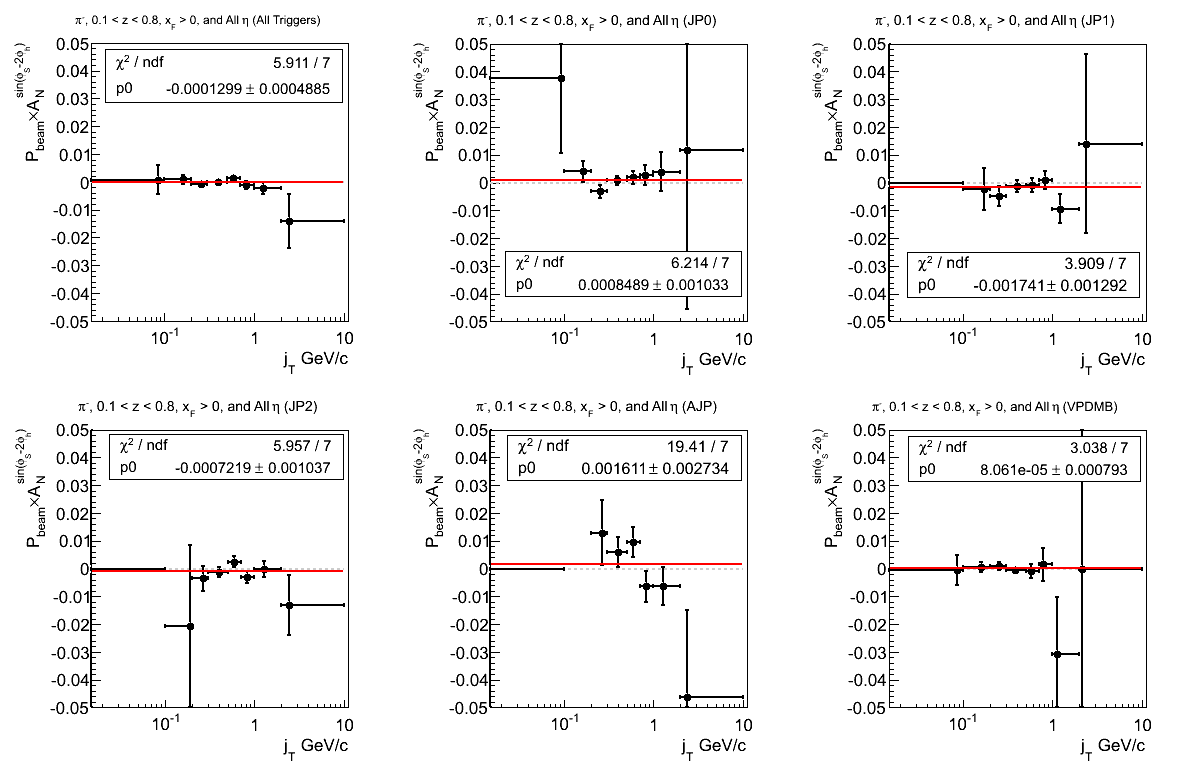
Again, no discernable effect is present. AJP does not at all look constant, however, some of this may be due to limited statistics at higher kinematics. Reexamining the individual fits may confirm this.
Figure 8: p0 (π+)
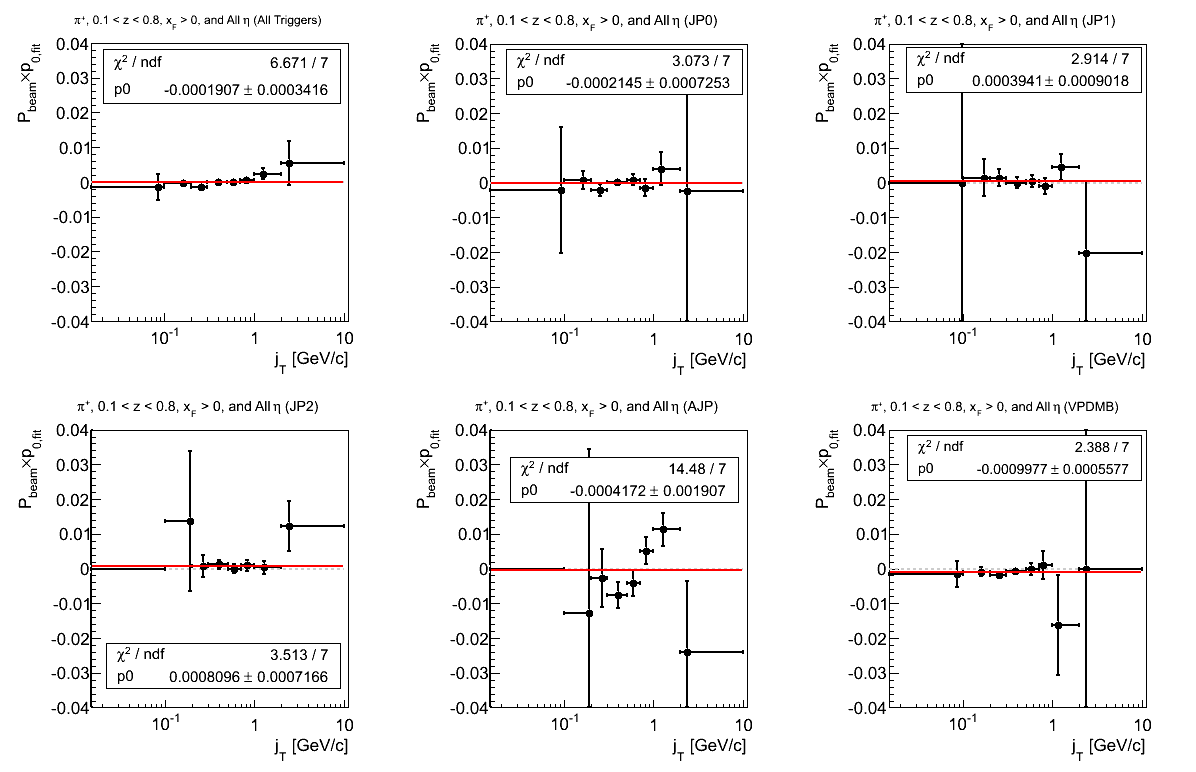
Generally, the p0 fits seem fine. The fit for AJP is, again, not very constant.
Figure 9: p0 (π-)
The fits for π- seem mostly driven by JP1.
xF < 0
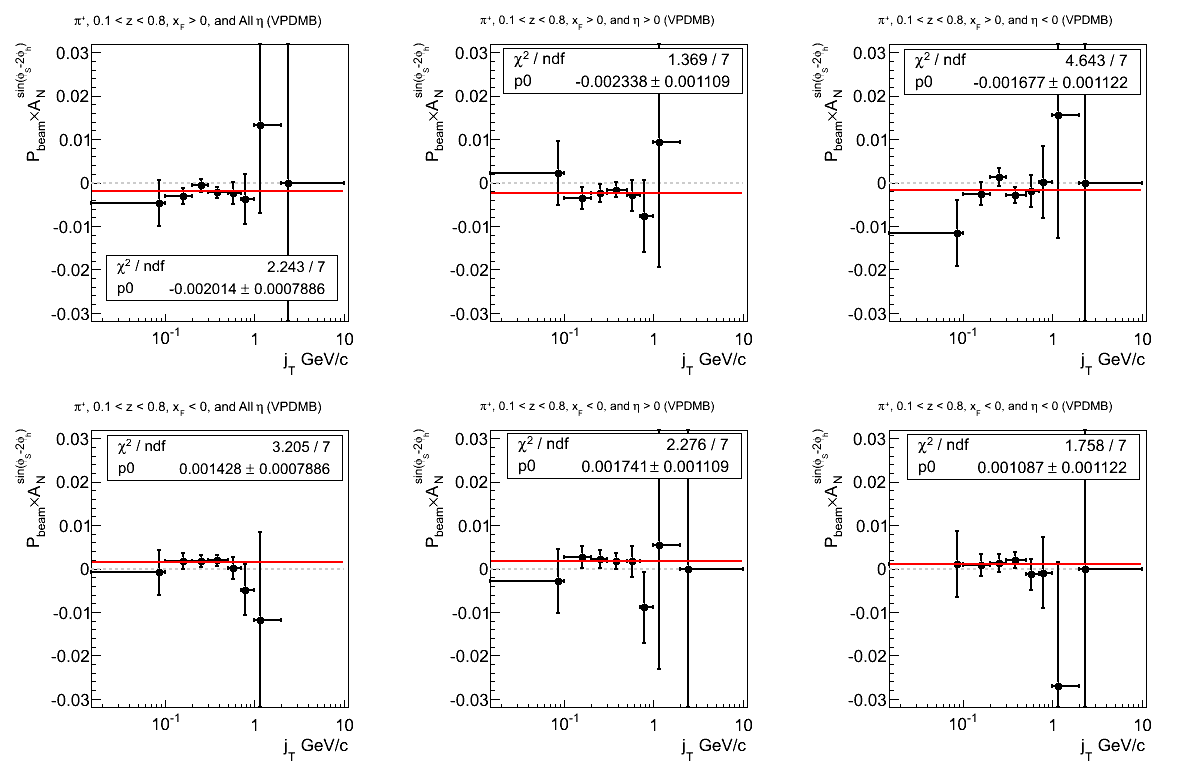
Figure 10: Asymmetry (π+)
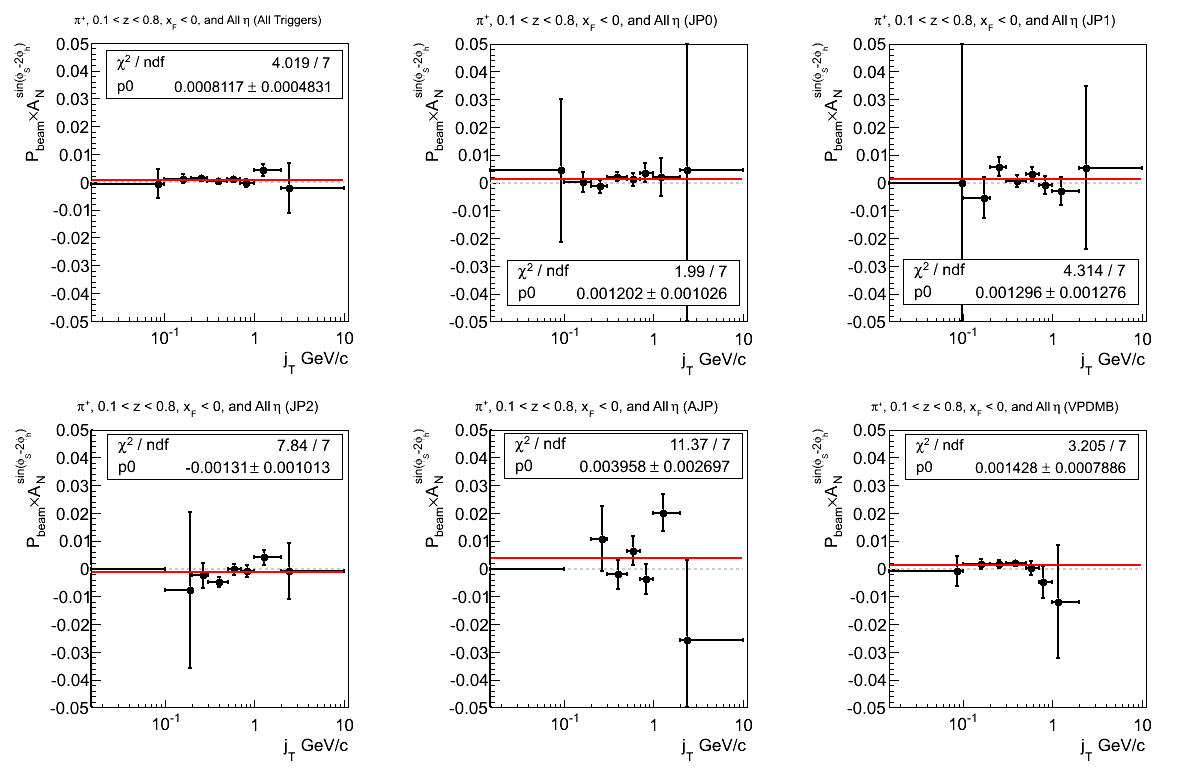
These fits seem systematically high across all trigger contributions, save JP2. In particular, VPDMB is high by 1.81σ.
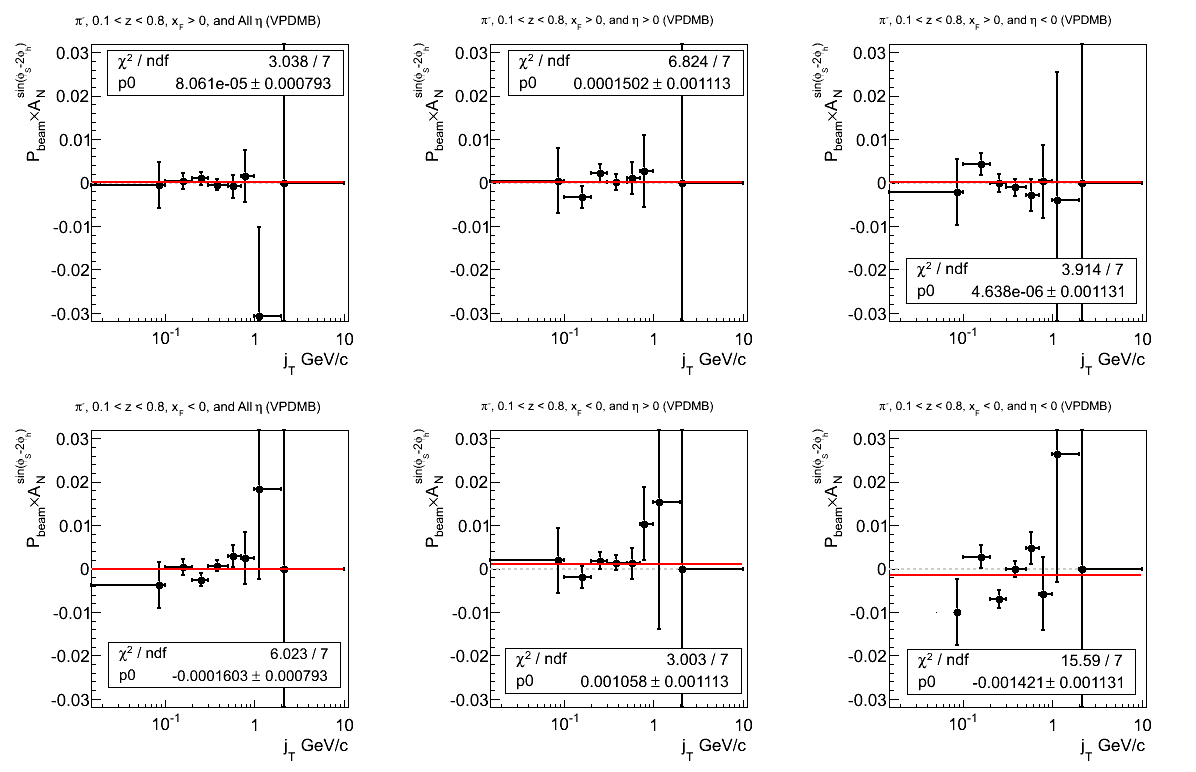
Figure 11: Asymmetry (π-)
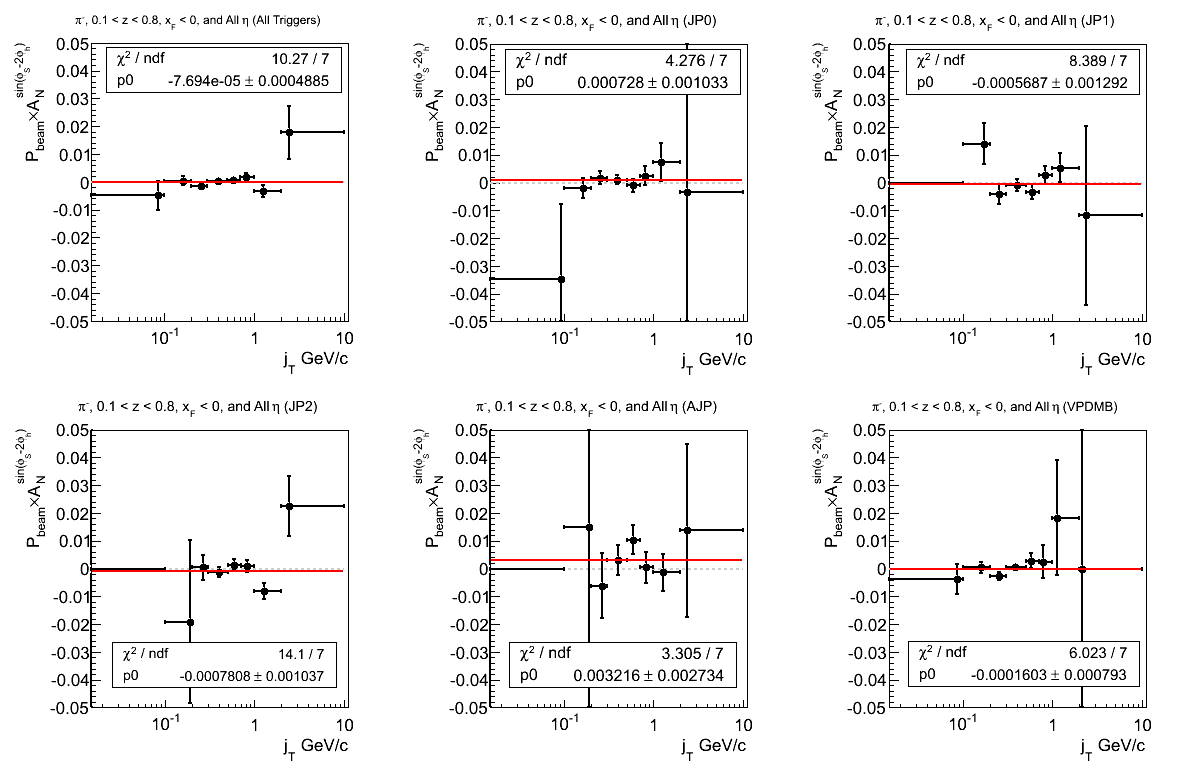
The π- distributions seem more well behaved than π+. The offsets seem reasonable. The fit for JP2 seems to fluctuate a bit.
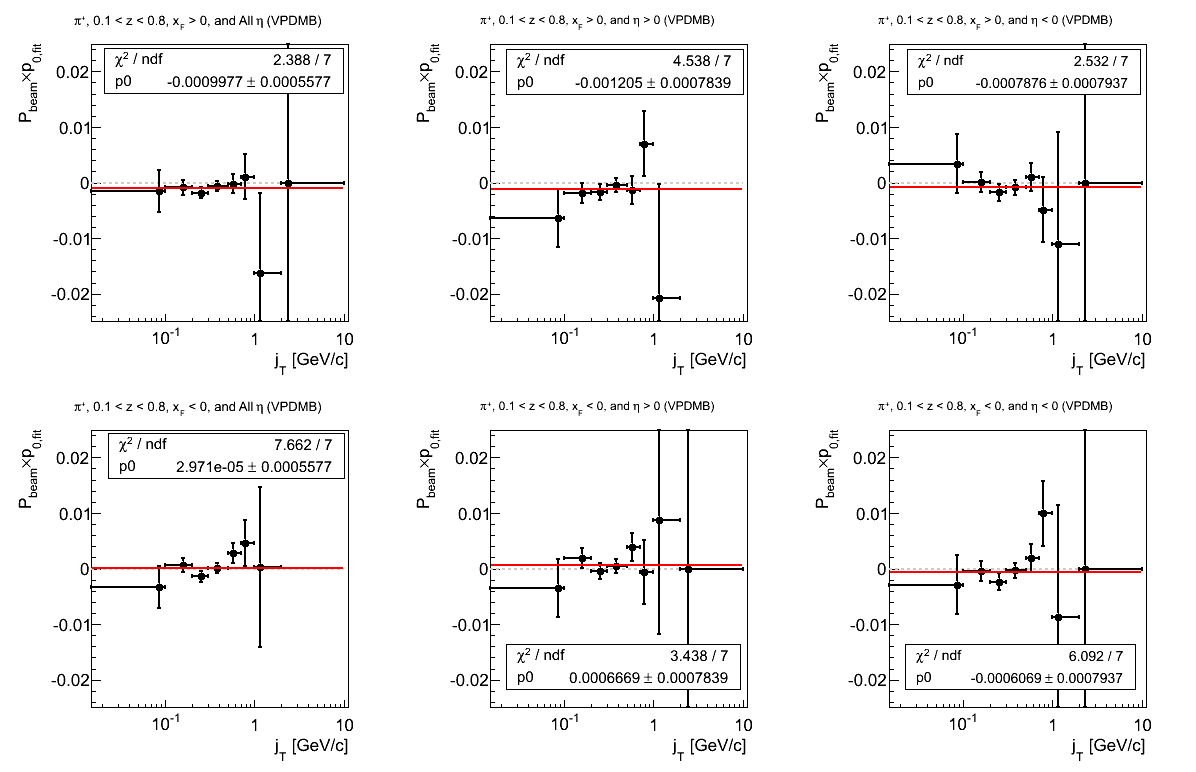
Figure 12: p0 (π+)
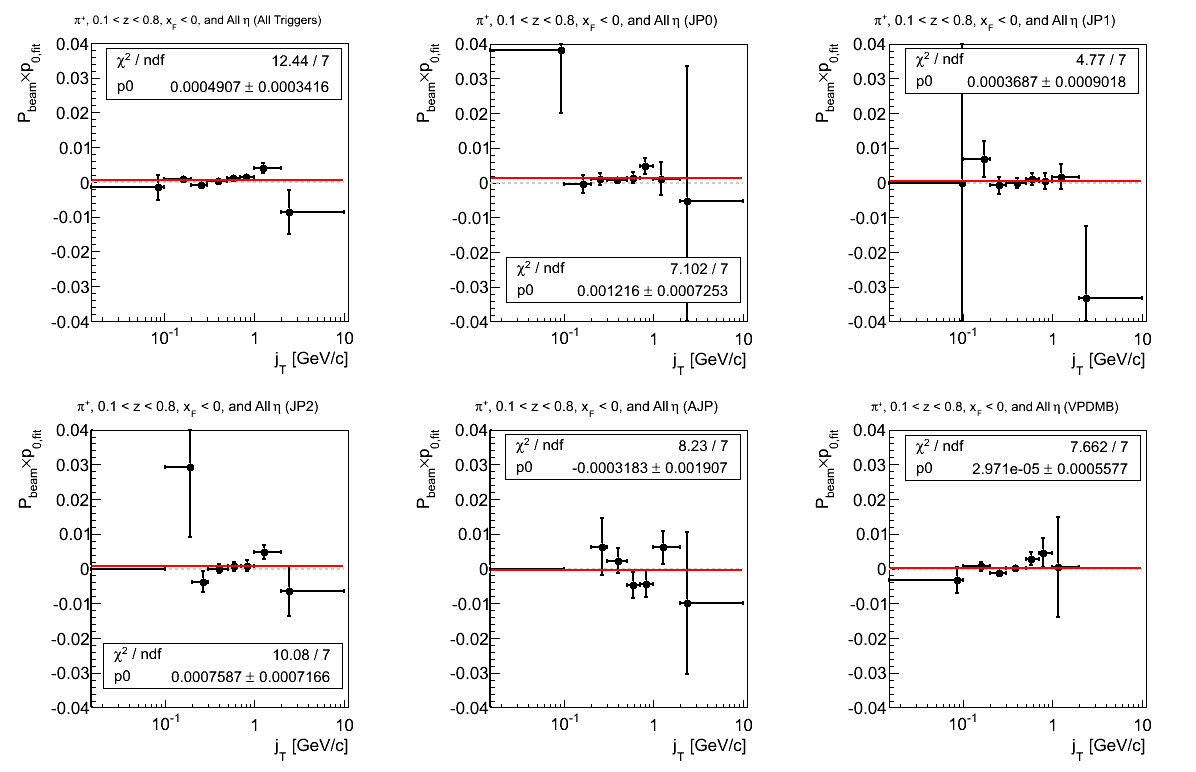
The distributions seem to be not quite as constant as one might like. The positive offset seems to derive mostly from JP0 and JP2.
Figure 13: p0 (π-)
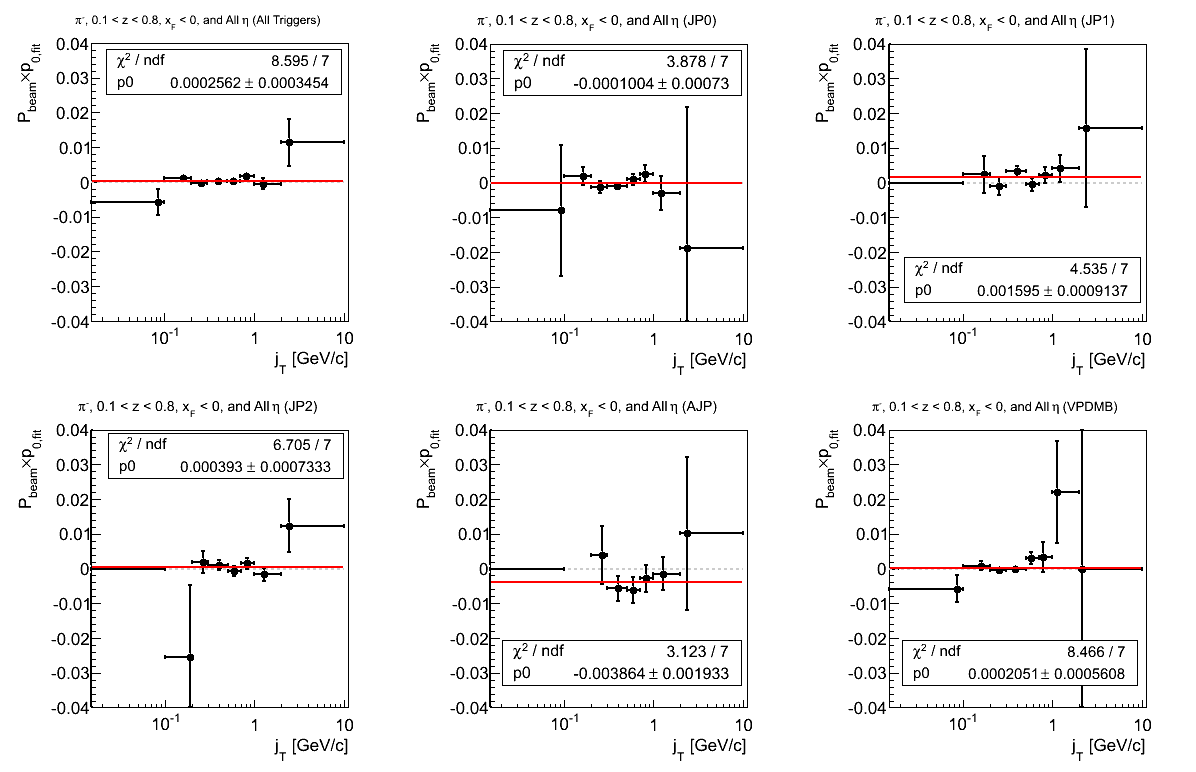
The fit quality seems driven, largely, by VDPMB.
Further Statistical Cross-checks
Figure 14: χ2-Distribution for Collins-like Fits
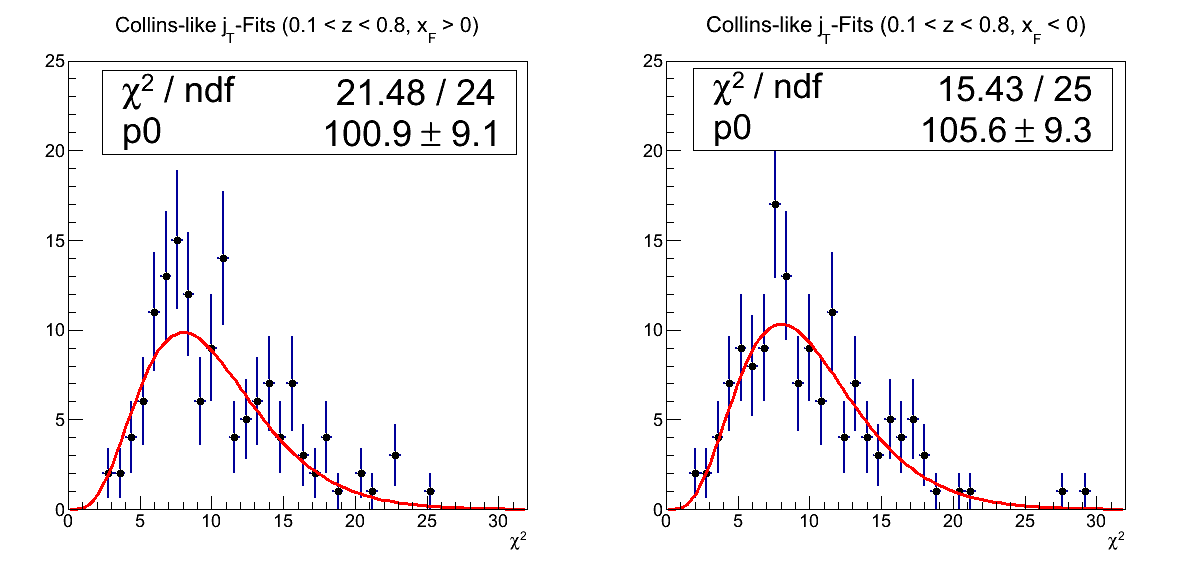
Figure 14 shows the χ2 distribution for the Collins-like fits (p0+p1×sin(φS-2φh)). In red is plotted the expected distribution for ν = 10. The agreement with expectation is quite good.
Distribution of Constant Fits
Figure 15: Asymmetry Fits
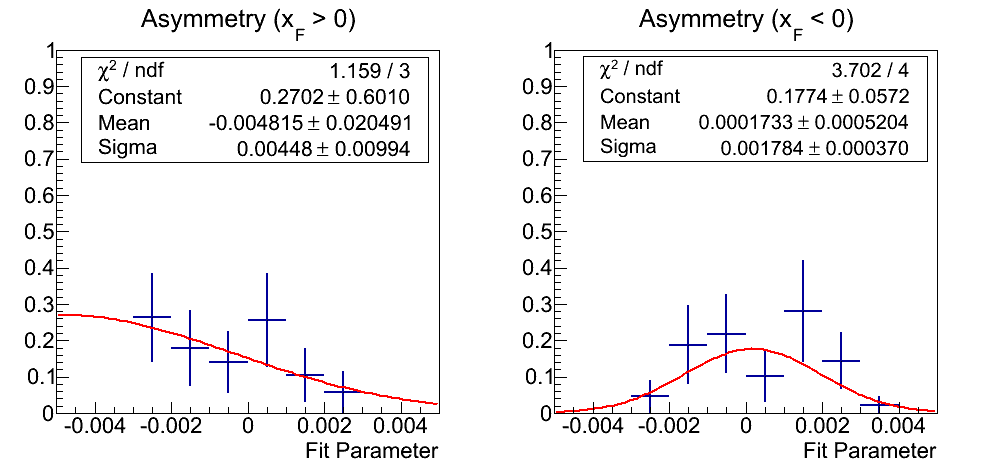
In Fig. 15 I show the distribution of constant fits to the asymmetries weighting the entries by 1/uncertainty. There simply are not many fits, thus, it is difficult to glean much information. The distributions are fit with a Gaussian. Again, the fit in positive xF is not at all informative. The fit for negative xF is decent, with a mean consistent with zero.
Figure 16: p0 Fits
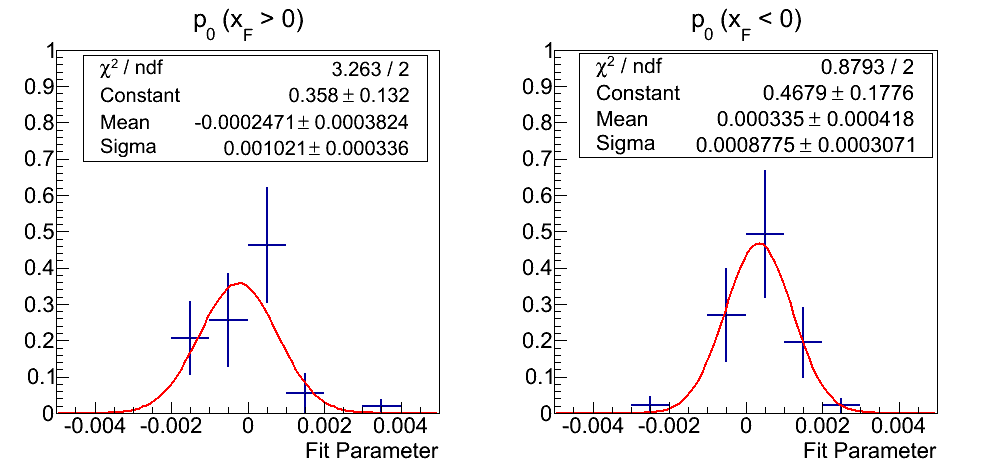
In Fig. 16, I show the weighted distribution for fits to the p0's. Again, there are not many fits from which to draw, but the distribution is much nicer than in Fig. 15. The fits appear decently Gaussian with means consistent with zero and similar widths.
Reduced χ2 of Constant Fits
With such a low number of fits with varying degrees of freedom, it is impossible to perform a χ2 study of the constant fits. However, we can examine the reduced χ2's for some information. The distribution for the asymmetries was simply too scattered for this study, so it has been excluded.
Figure 17: p0 Fits
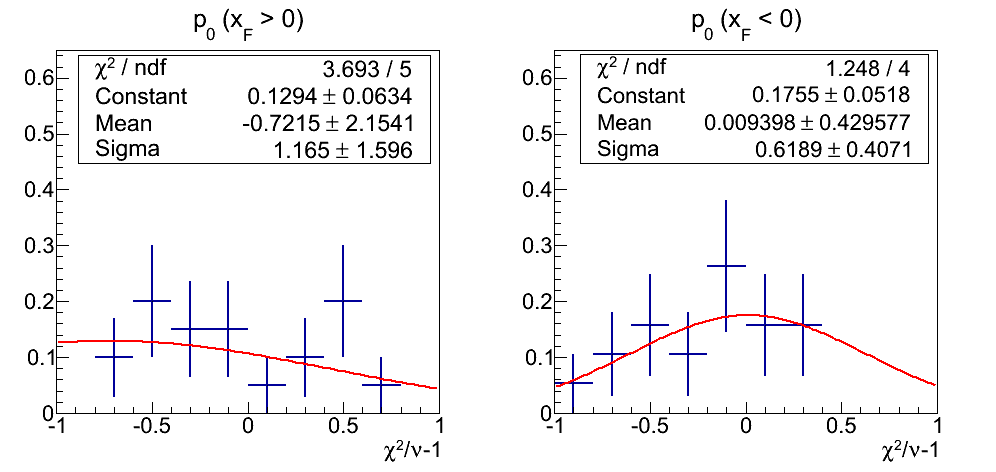
The distribution of fits to p0's is somewhat better than the asymmetries, though positive xF is still fairly scattered. The uncertainties are quite large, but the fitted means are consistent with zero.
η Dependence
The distributions in Fig. 15- Fig. 17 are taken from fits to the various triggers in different hemispheres. In Fig. 18-Fig. 22 I show the results of these fits.
π+
Figure 18: JP0 Triggers
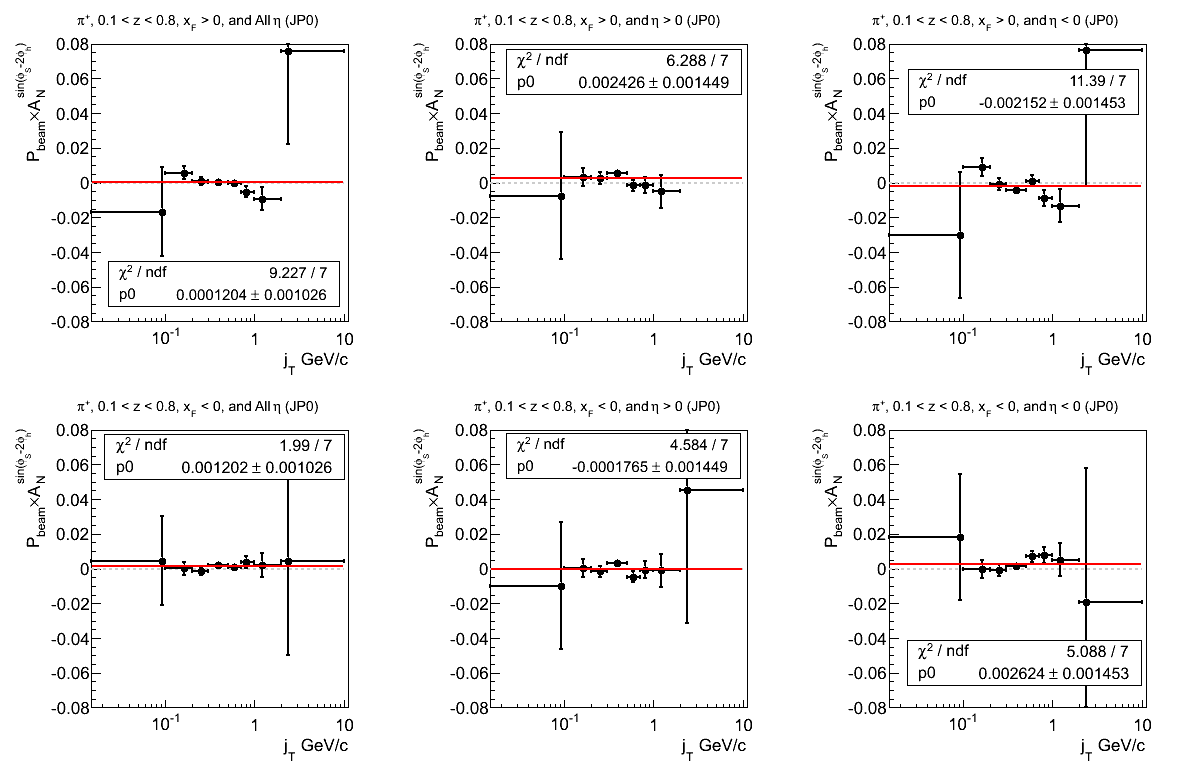
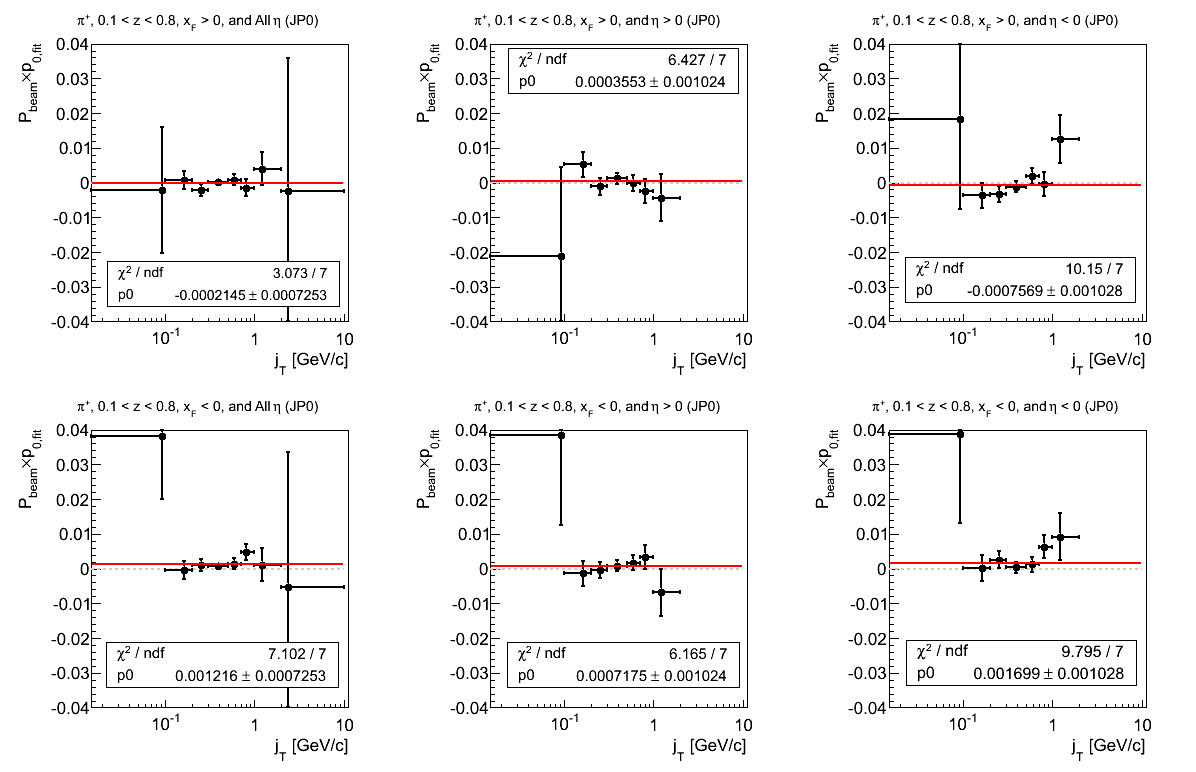
Figure 19: JP1 Triggers
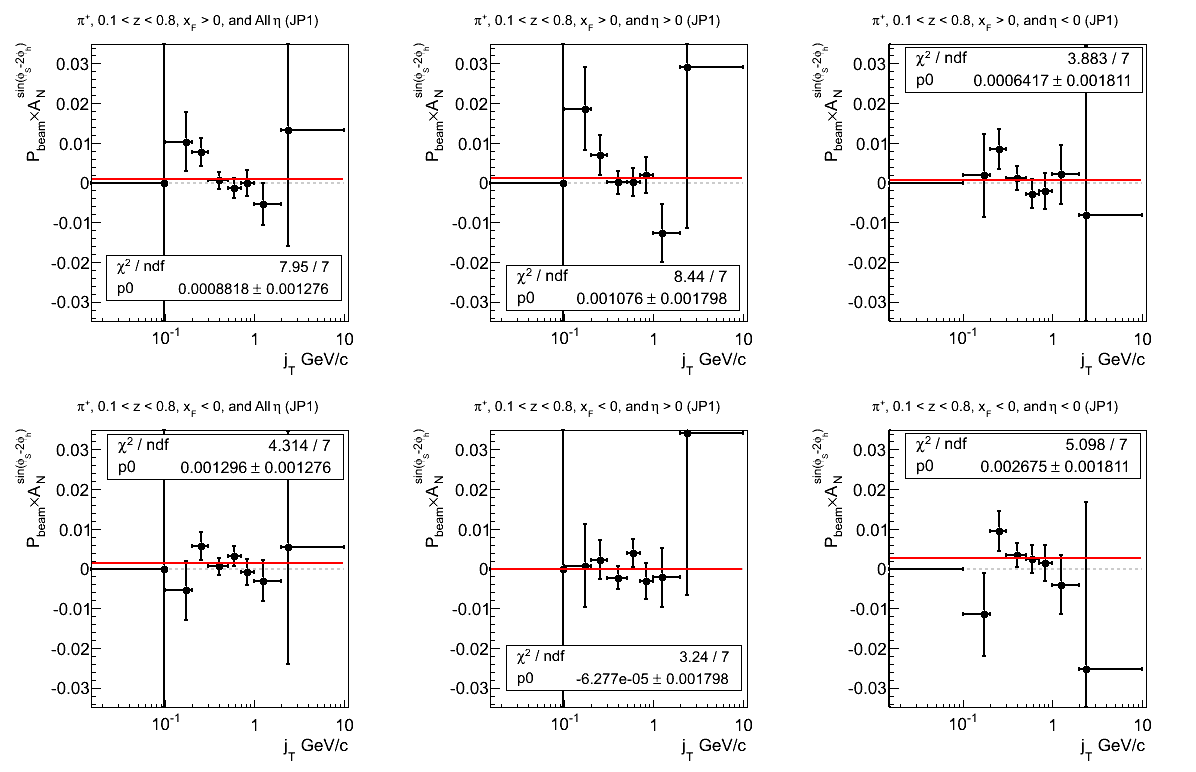
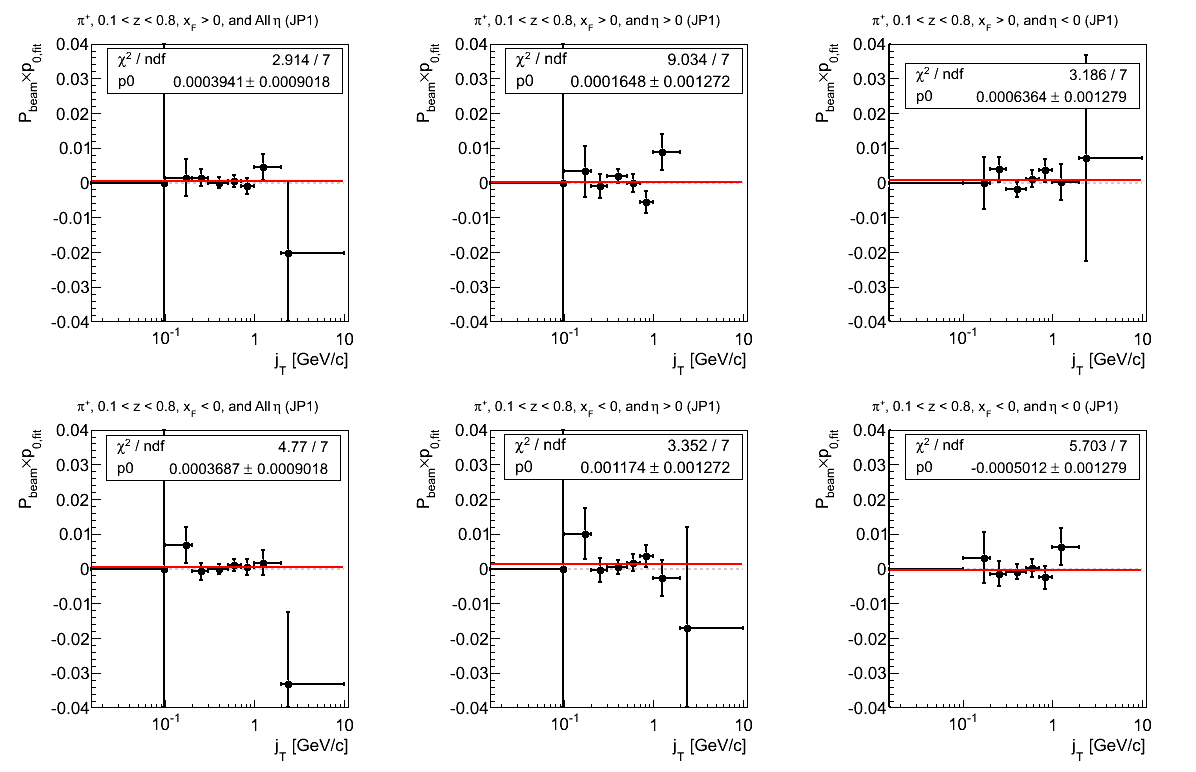
Figure 20: JP2 Triggers
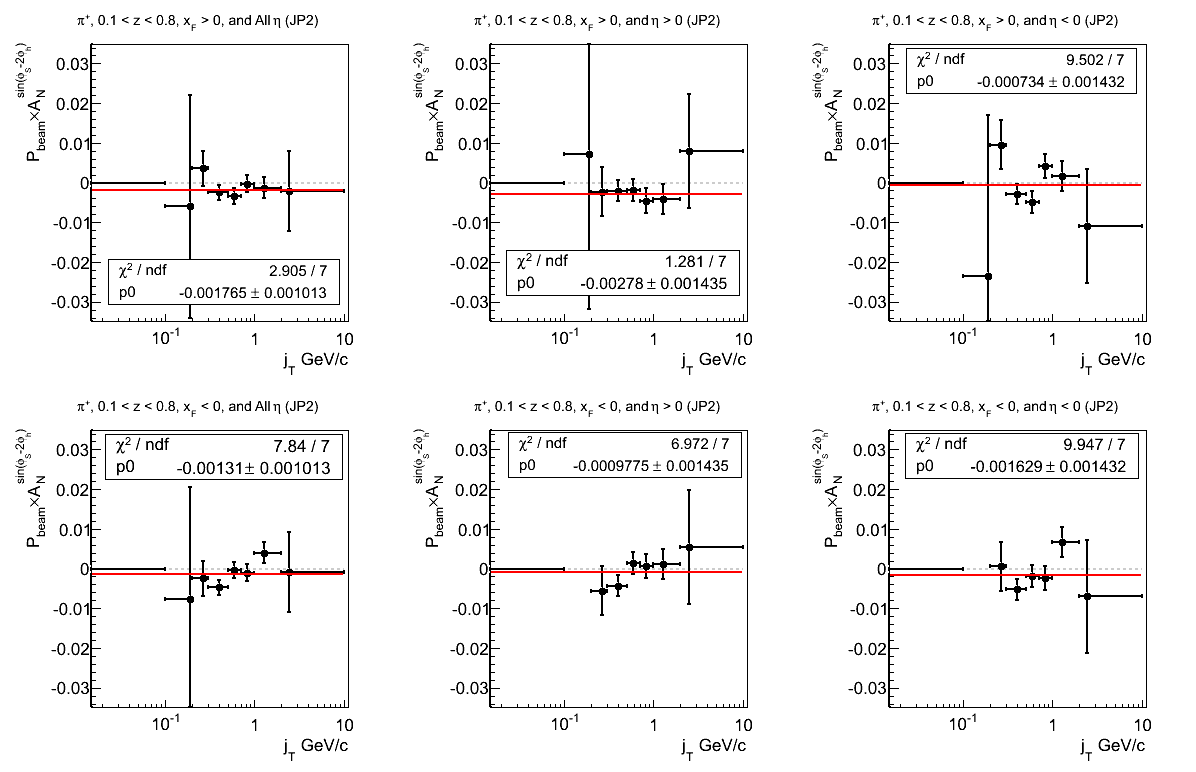
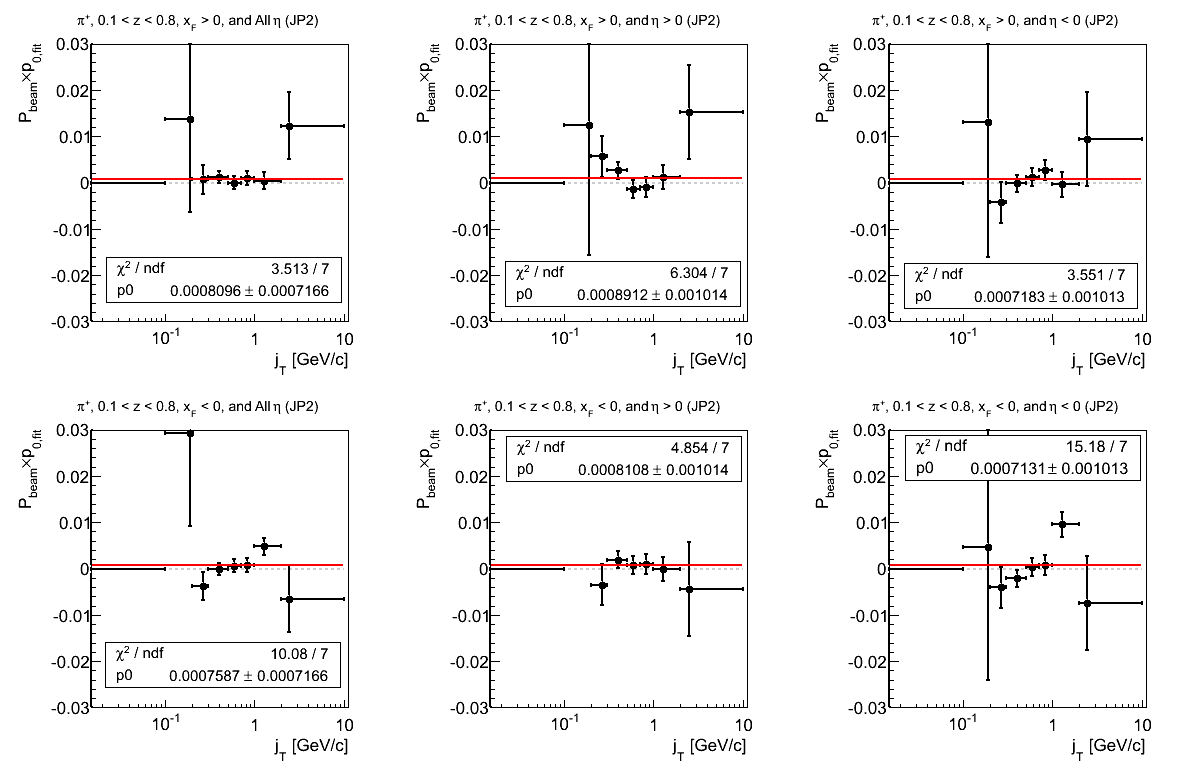
Figure 21: AJP Triggers
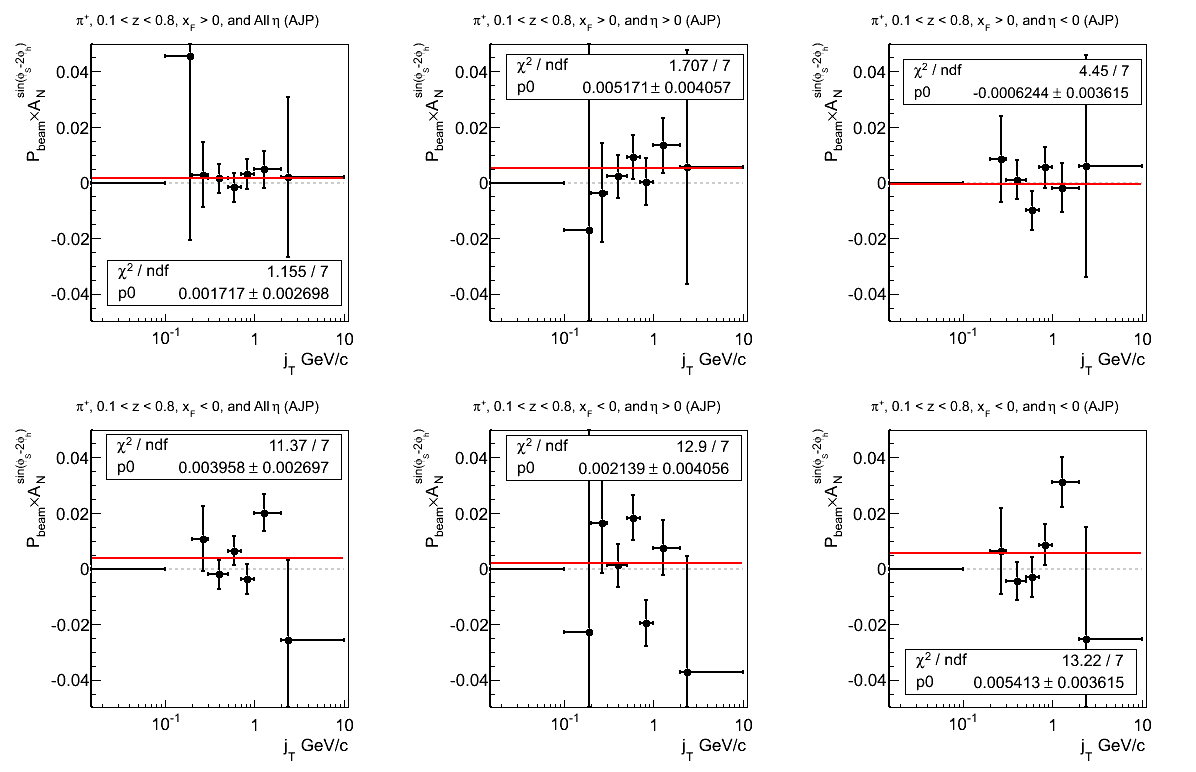
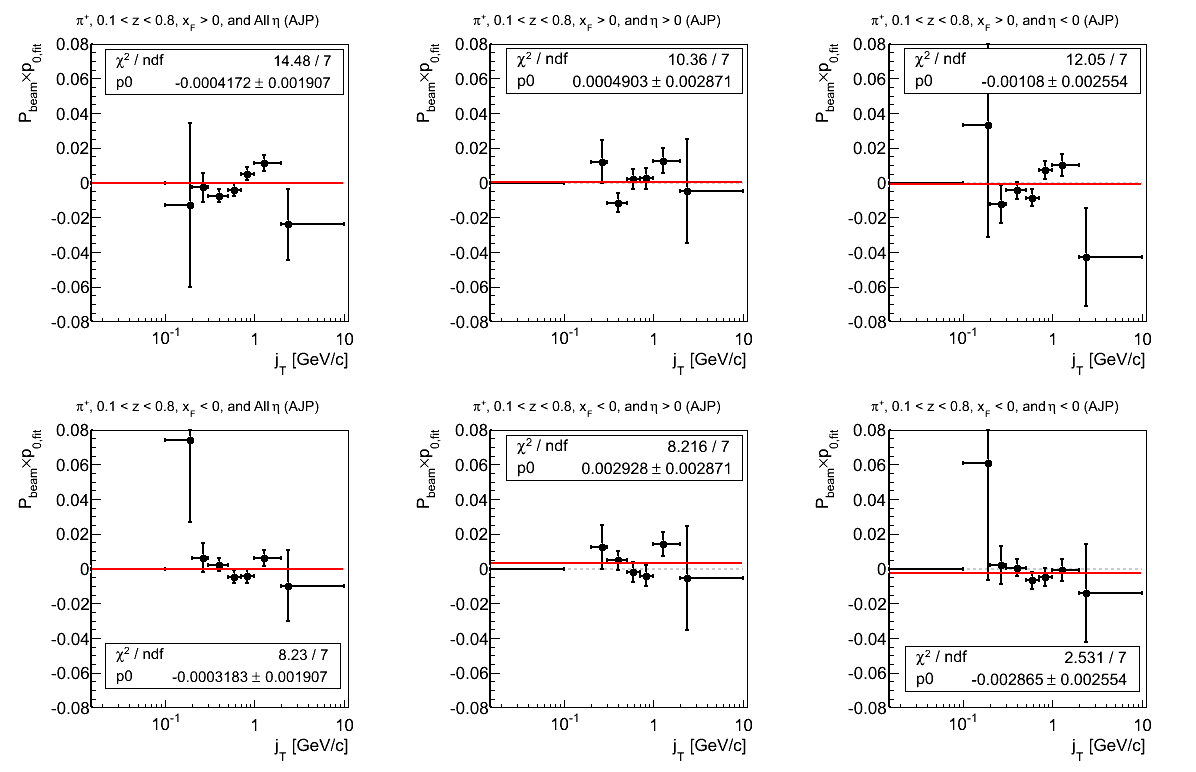
Figure 22: VPDMB Triggers
π-
Figure 18: JP0 Triggers
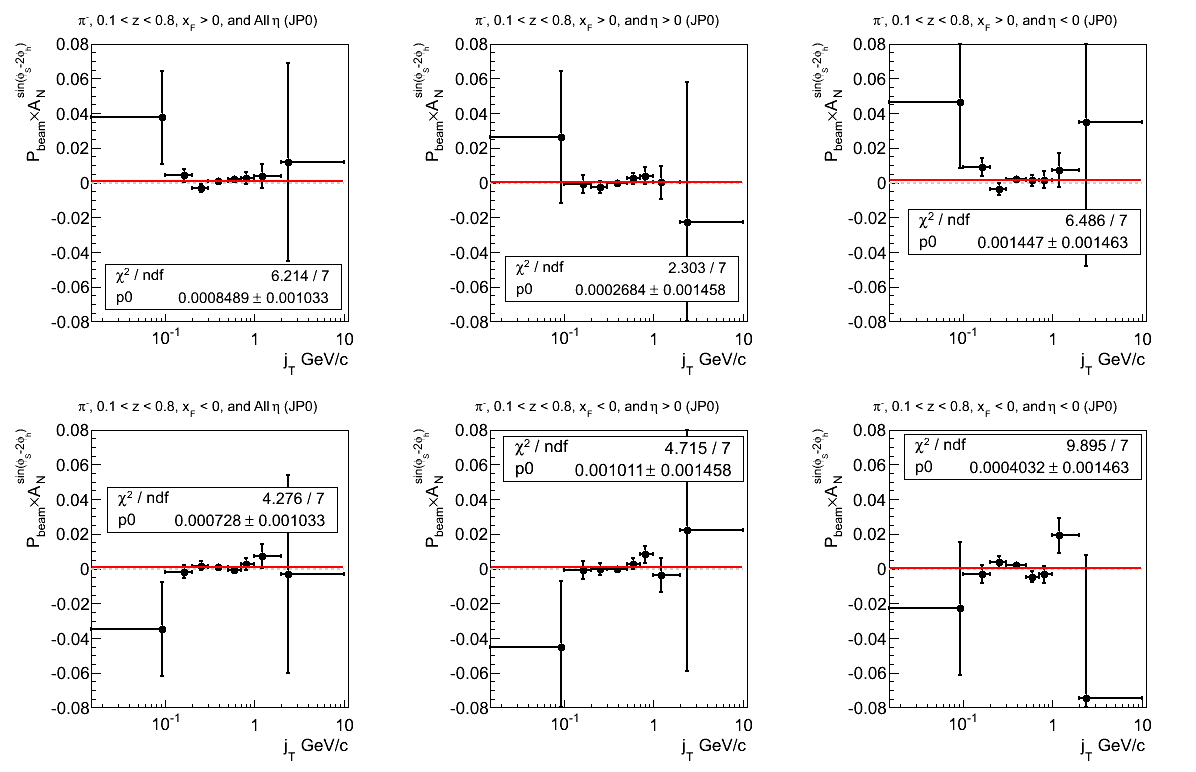
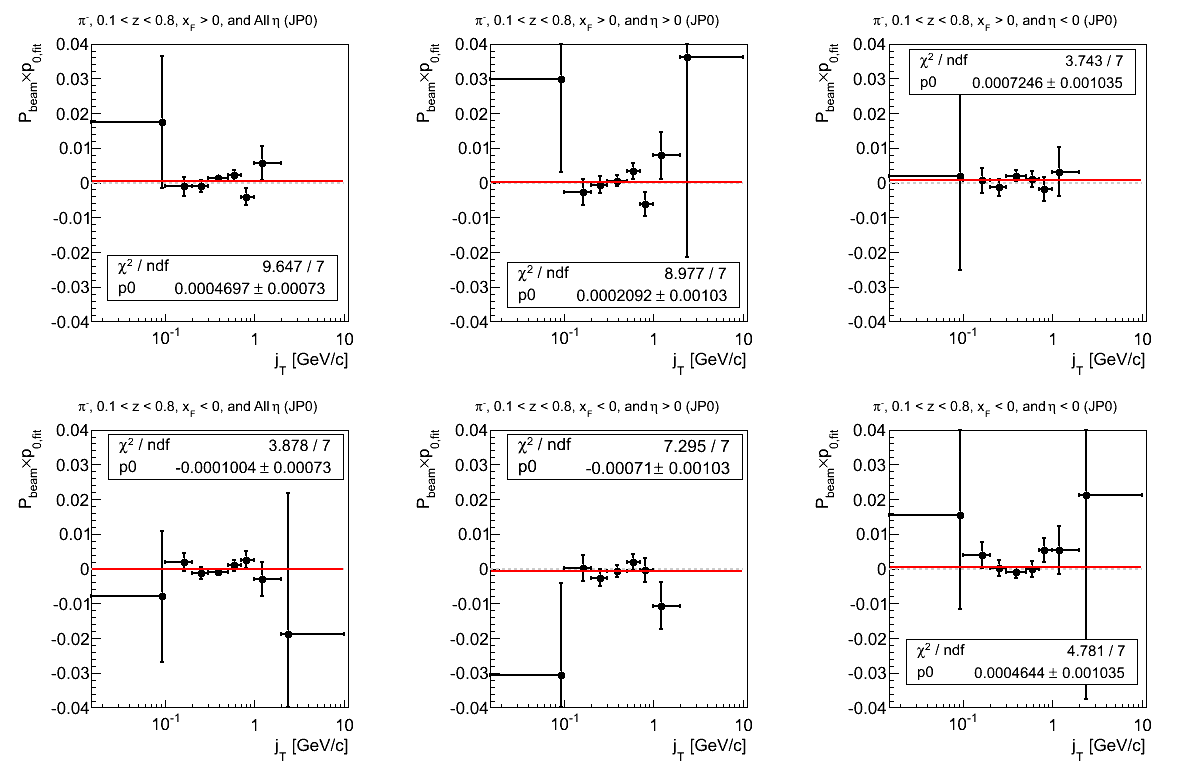
Figure 19: JP1 Triggers
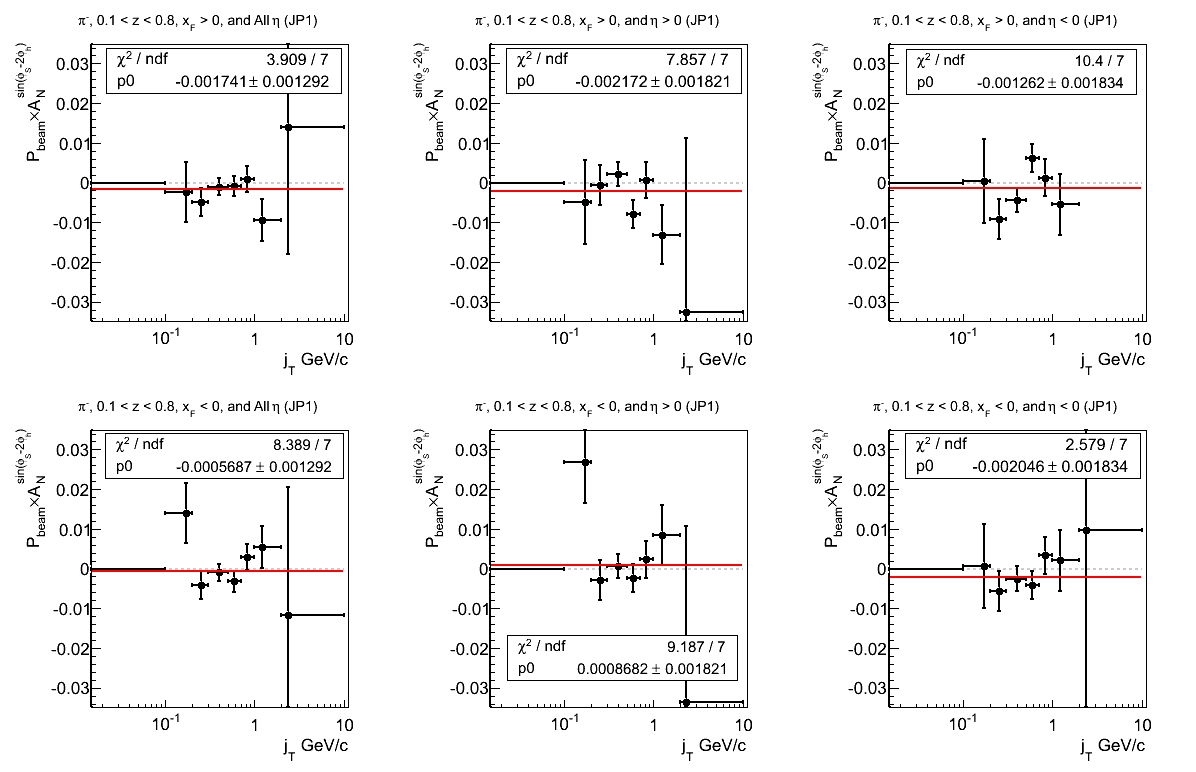
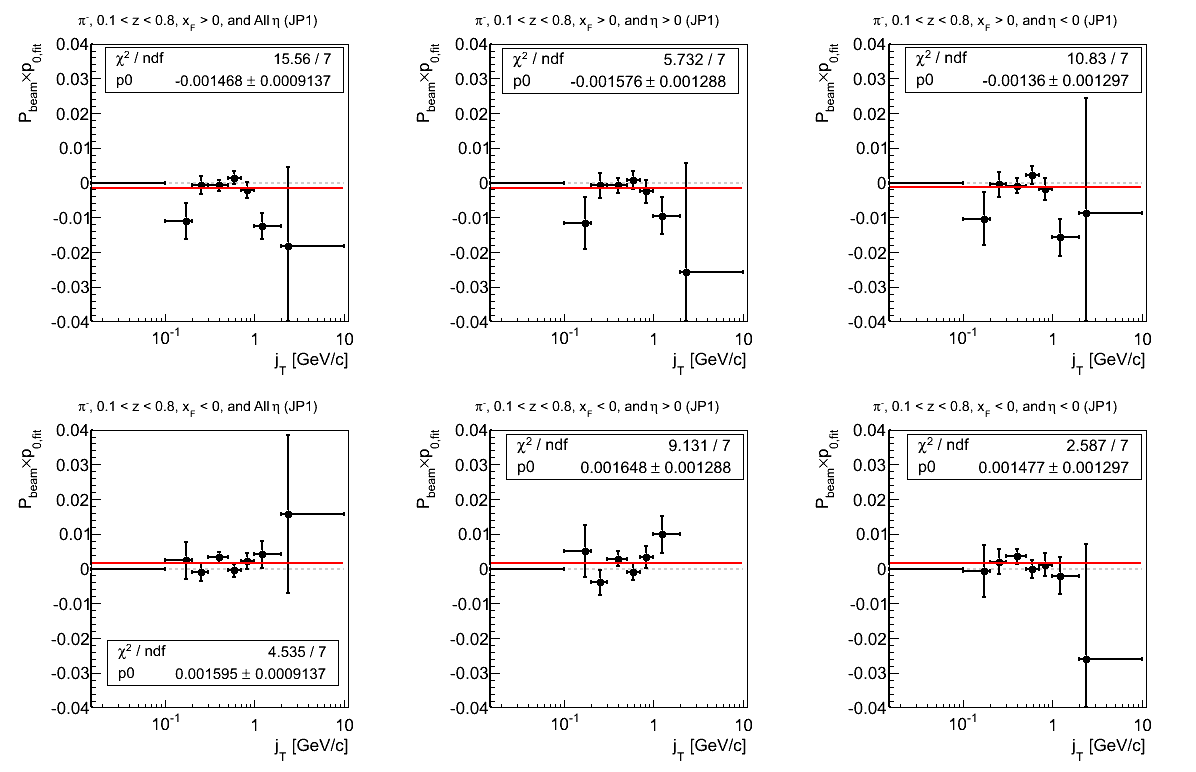
Figure 20: JP2 Triggers
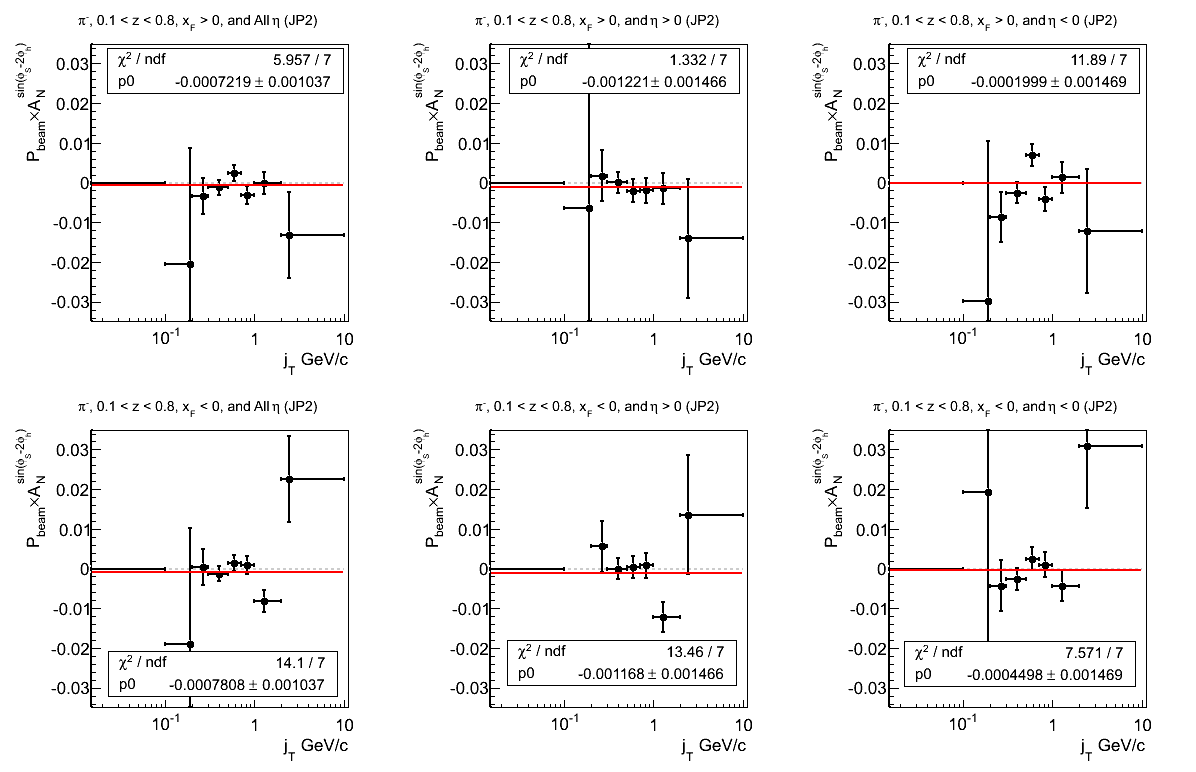
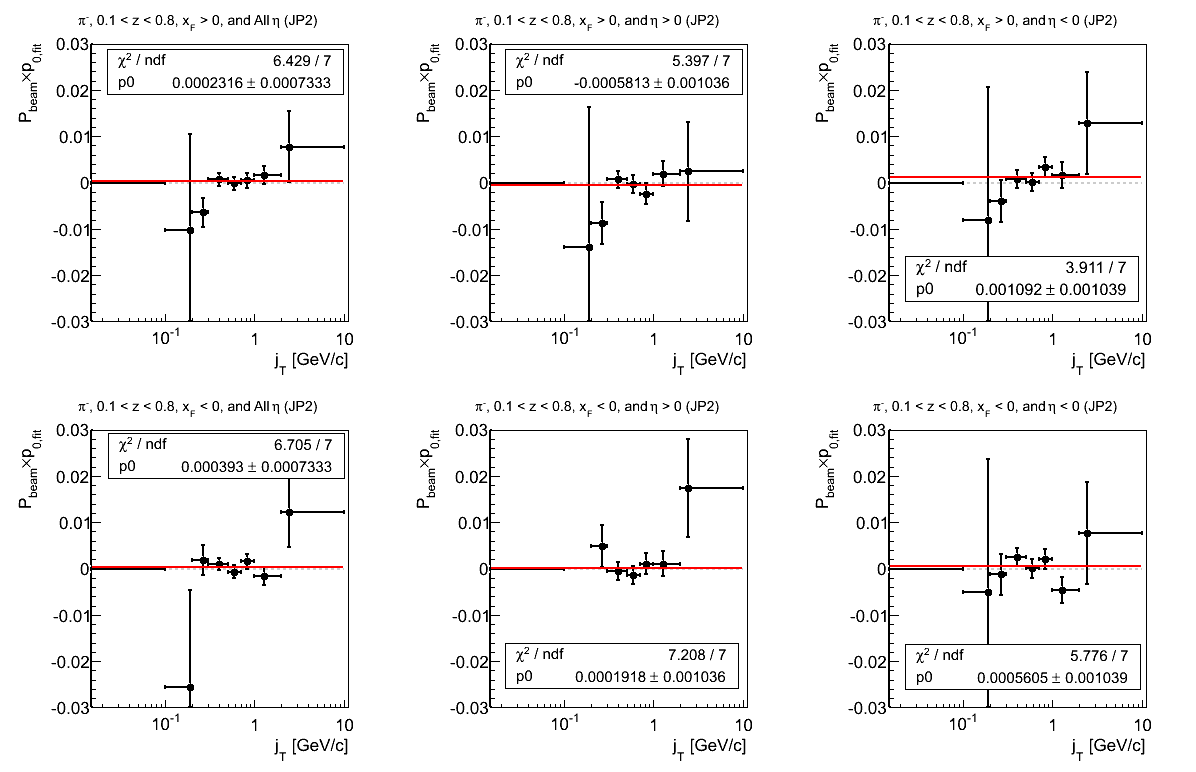
Figure 21: AJP Triggers
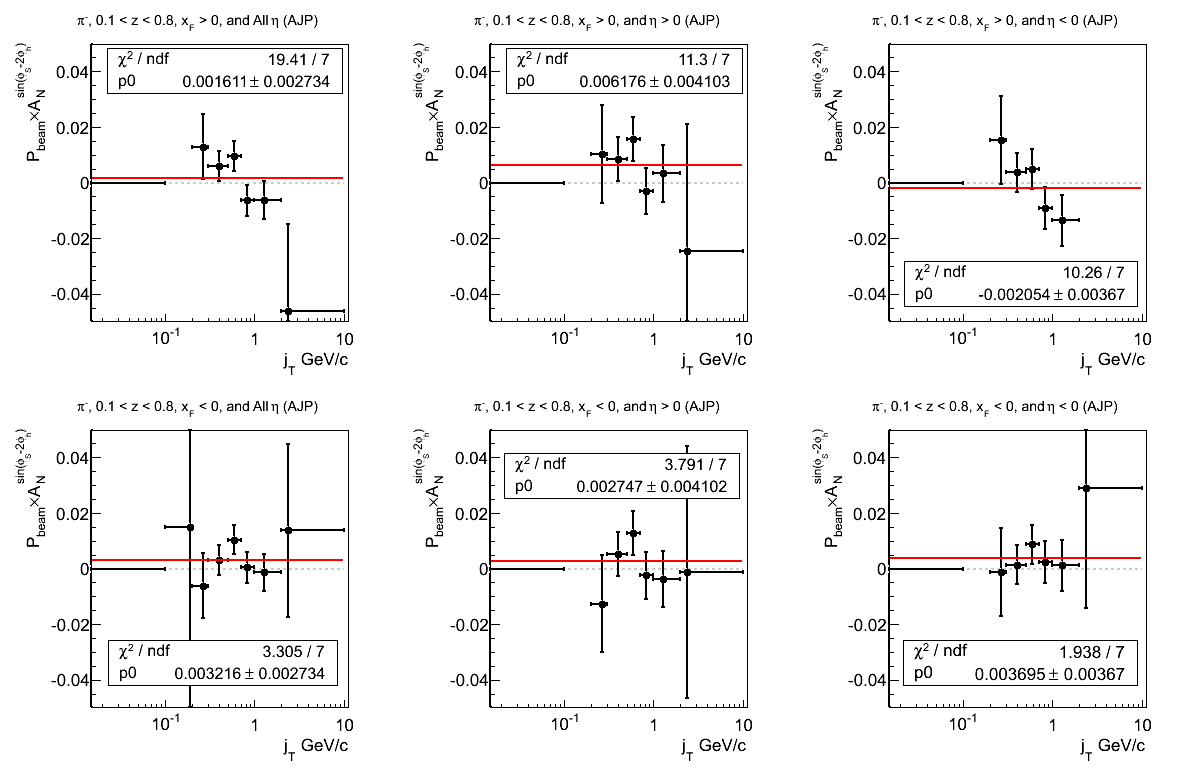
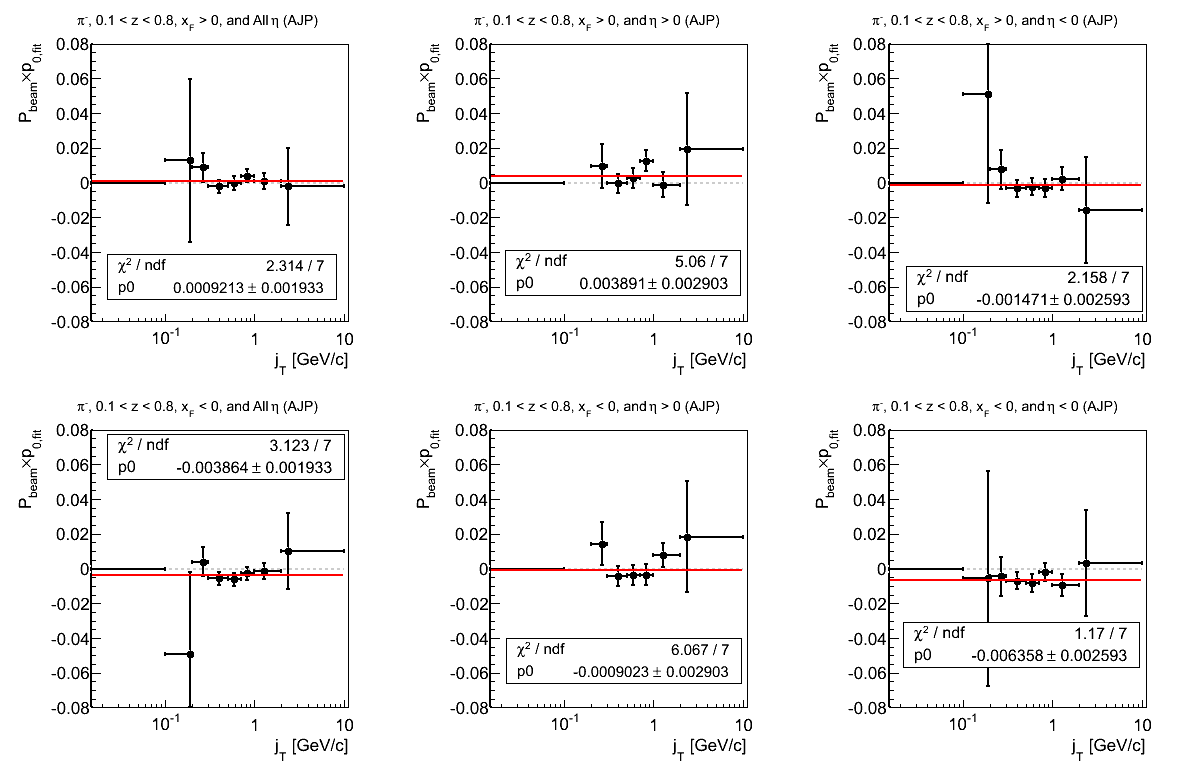
Figure 22: VPDMB Triggers
Groups:
- drach09's blog
- Login or register to post comments