- drach09's home page
- Posts
- 2022
- 2020
- June (1)
- 2019
- 2018
- 2017
- 2016
- 2015
- 2014
- December (13)
- November (2)
- October (5)
- September (2)
- August (8)
- July (9)
- June (7)
- May (5)
- April (4)
- March (4)
- February (1)
- January (2)
- 2013
- December (2)
- November (8)
- October (5)
- September (12)
- August (5)
- July (2)
- June (3)
- May (4)
- April (8)
- March (10)
- February (9)
- January (11)
- 2012
- 2011
- October (1)
- My blog
- Post new blog entry
- All blogs
2006 EEMC Neutral Pions: New Mass Fitting
I have, now, applied the new background fitting method which extends the range to 0 < mγγ < 0.3 GeV/c2. The systematics have also been recalculated.
Figure 1
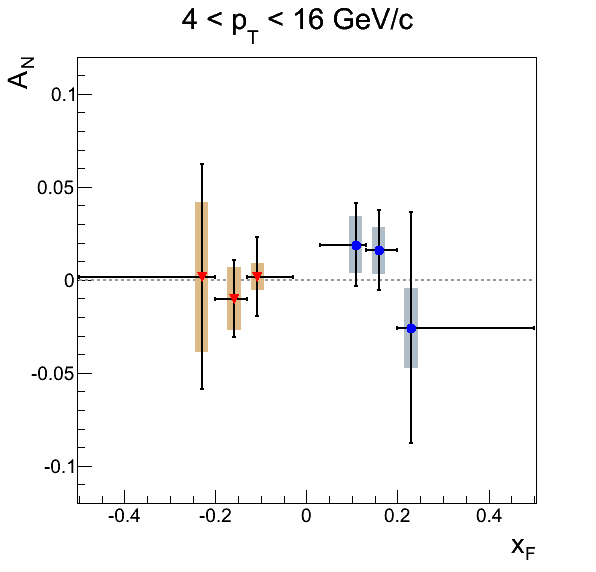
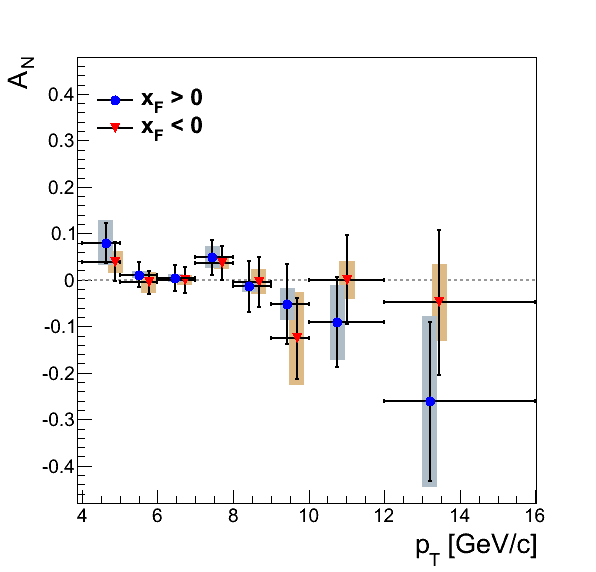
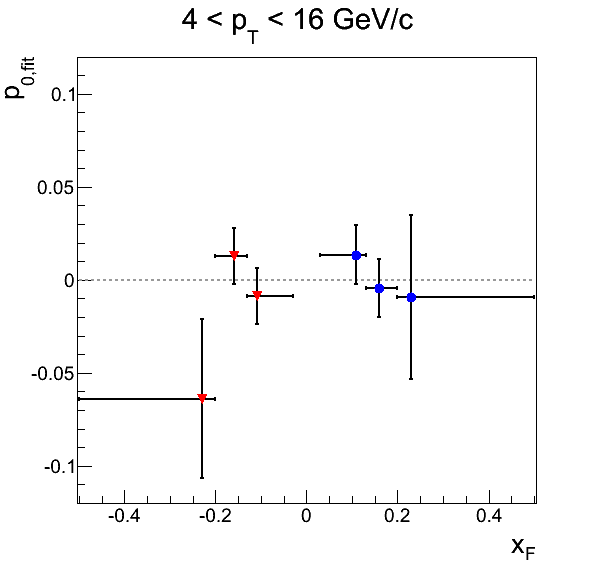
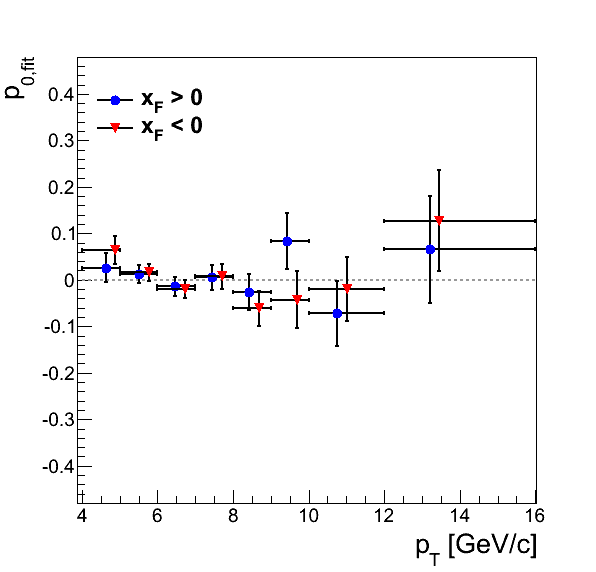
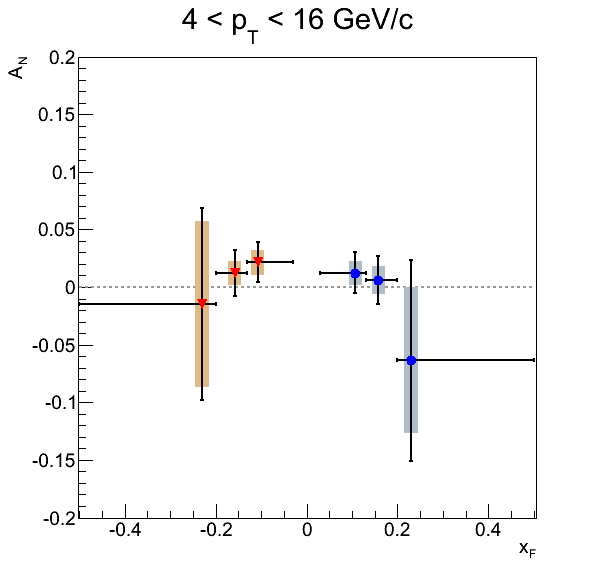
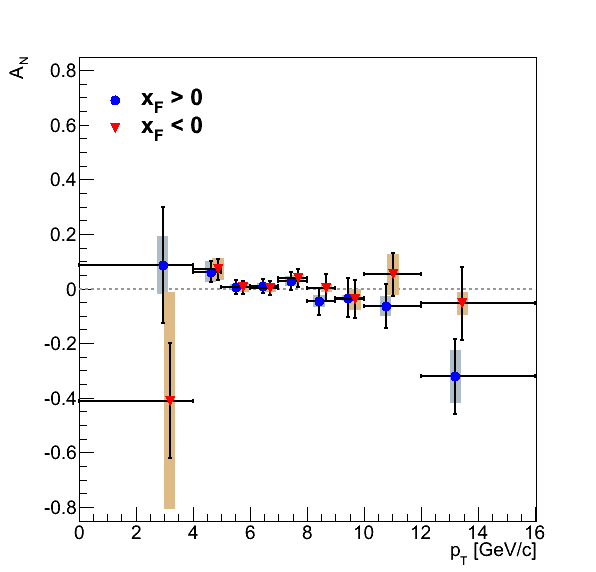
The new results look qualitatively similar to the previous measurements. I have dropped the lowest pT bin as we have much trouble getting the simulation to agree with data. Likely, this is due to the fact that few pions below 4 GeV/c can fire the trigger.
Figure 2
| New Fitting | Old Fitting (Expanded Run List) |
|---|---|
 |
 |
 |
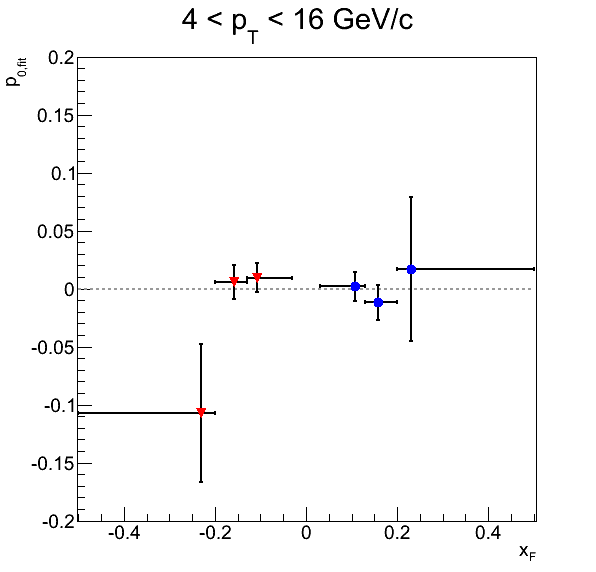 |
In Fig. 2 I compare the new results vs. xF with the old. Note: I have changed the vertical scale.
Figure 3
| New Fitting | Old Fitting (Expanded Run List) |
|---|---|
 |
 |
 |
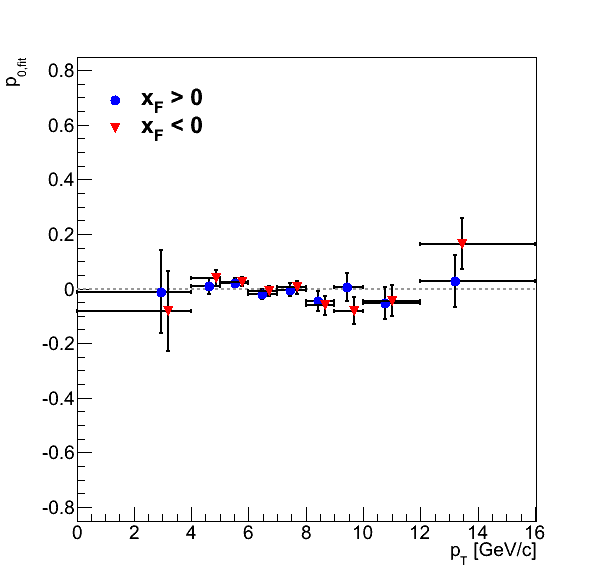 |
In Fig. 3 I compare the new results vs. pT with the old. Again, I have changed the vertical scale and dropped the lowest bin.
Table 1: New Fitting
| pT Blue | pT Yellow | xF Blue | xF Yellow | |
|---|---|---|---|---|
| χ2/ν | 5.31835/7 | 10.8541/7 | 0.747144/2 | 3.26338/2 |
| p0 | 0.00330197± 0.0105832 | 0.0029089±0.0102665 | 0.00349719±0.0106989 | -0.00151564±0.0103378 |
Here I have fit the p0 distirbutions with a constant. The fits are nicely consistent with 0 with χ2/ν not entirely ridiculous.
Table 2: Old Fitting (Expanded Run List)
| pT Blue | pT Yellow | xF Blue | xF Yellow | |
|---|---|---|---|---|
| χ2/ν | 5.35085/8 | 14.0435/8 | 0.607805/2 | 3.6786/2 |
| p0 | -0.00272623±0.00973172 | 0.00339444±0.00942069 | -0.00346015±0.00958788 | 0.00498536±0.00926762 |
Here I show the fits for the old mass-fitting technique for comparison.
Table 3: Expanded Run List (xF > 0)
| AN | δAN Stat | δAN Total Syst | δAN B.g. Asym Syst | δAN Sig. Fit Param. Syst | δAN Sig. Frac. Syst | δAN Mass Window Syst | δAN Non-coll. Bg. Syst | |
|---|---|---|---|---|---|---|---|---|
| xF Bin 1 | 0.0189 | 0.0222 | 0.0155 | 0.0056 | 0.0023 | 0.0091 | 0.0108 | 0.0020 |
| xF Bin 2 | 0.0158 | 0.0215 | 0.0126 | 0.0059 | 0.0023 | 0.0073 | 0.0078 | 0.0020 |
| xF Bin 3 | -0.0258 | 0.0620 | 0.0215 | 0.0163 | 0.0077 | 0.0040 | 0.0108 | 0.0020 |
| pT Bin 2 | 0.0796 | 0.0432 | 0.0487 | 0.0012 | 0.0078 | 0.0478 | 0.0043 | 0.0020 |
| pT Bin 3 | 0.0109 | 0.0264 | 0.0072 | 0.0037 | 0.0016 | 0.0051 | 0.0022 | 0.0020 |
| pT Bin 4 | 0.0039 | 0.0280 | 0.0082 | 0.0062 | 0.0011 | 0.0028 | 0.0041 | 0.0020 |
| pT Bin 5 | 0.0487 | 0.0377 | 0.0238 | 0.0087 | 0.0076 | 0.0122 | 0.0166 | 0.0020 |
| pT Bin 6 | -0.0142 | 0.0545 | 0.0113 | 0.0099 | 0.0015 | 0.0014 | 0.0047 | 0.0020 |
| pT Bin 7 | -0.0525 | 0.0857 | 0.0339 | 0.0109 | 0.0185 | 0.0024 | 0.0260 | 0.0020 |
| pT Bin 8 | -0.0918 | 0.0968 | 0.0812 | 0.0113 | 0.0306 | 0.0141 | 0.0730 | 0.0020 |
| pT Bin 9 | -0.2615 | 0.1708 | 0.1846 | 0.0075 | 0.1121 | 0.0988 | 0.1081 | 0.0020 |
Table 4: Expanded Run List (xF < 0)
| AN | δAN Stat | δAN Total Syst | δAN B.g. Asym Syst | δAN Sig. Fit Param. Syst | δAN Sig. Frac. Syst | δAN Mass Window Syst | δAN Non-coll. Bg. Syst | |
|---|---|---|---|---|---|---|---|---|
| xF Bin 1 | 0.0017 | 0.0214 | 0.0072 | 0.0036 | 0.0001 | 0.0006 | 0.0059 | 0.0020 |
| xF Bin 2 | -0.0101 | 0.0207 | 0.0170 | 0.0040 | 0.0010 | 0.0033 | 0.0160 | 0.0020 |
| xF Bin 3 | 0.0016 | 0.0606 | 0.0402 | 0.0106 | 0.0007 | 0.0012 | 0.0388 | 0.0020 |
| pT Bin 2 | 0.0385 | 0.0419 | 0.0235 | 0.0008 | 0.0035 | 0.0216 | 0.0084 | 0.0020 |
| pT Bin 3 | -0.0057 | 0.0256 | 0.0222 | 0.0027 | 0.0005 | 0.0013 | 0.0219 | 0.0020 |
| pT Bin 4 | -0.0003 | 0.0273 | 0.0103 | 0.0041 | 0.0000 | 0.0003 | 0.0092 | 0.0020 |
| pT Bin 5 | 0.0364 | 0.0361 | 0.0124 | 0.0052 | 0.0050 | 0.0094 | 0.0030 | 0.0020 |
| pT Bin 6 | -0.0042 | 0.0535 | 0.0273 | 0.0058 | 0.0009 | 0.0012 | 0.0265 | 0.0020 |
| pT Bin 7 | -0.1261 | 0.0870 | 0.1003 | 0.0063 | 0.0513 | 0.0069 | 0.0856 | 0.0020 |
| pT Bin 8 | 0.0001 | 0.0956 | 0.0412 | 0.0096 | 0.0000 | 0.0007 | 0.0400 | 0.0020 |
| pT Bin 9 | -0.0488 | 0.1553 | 0.0838 | 0.0062 | 0.0215 | 0.0123 | 0.0798 | 0.0020 |
In tables 3 and 4 I print the data for the various plots. Note, I have included the non-collision systematic for good measure. Additionally, I have included the alternate mass fitting method which we may not need with the improved Monte Carlo template fitting.
- drach09's blog
- Login or register to post comments
