- drach09's home page
- Posts
- 2022
- 2020
- June (1)
- 2019
- 2018
- 2017
- 2016
- 2015
- 2014
- December (13)
- November (2)
- October (5)
- September (2)
- August (8)
- July (9)
- June (7)
- May (5)
- April (4)
- March (4)
- February (1)
- January (2)
- 2013
- December (2)
- November (8)
- October (5)
- September (12)
- August (5)
- July (2)
- June (3)
- May (4)
- April (8)
- March (10)
- February (9)
- January (11)
- 2012
- 2011
- October (1)
- My blog
- Post new blog entry
- All blogs
2006 EEMC Neutral Pions: New Mass Fitting (Near-final Run List)
NOTE: the trees were made with the wrong L2 thresholds and will need to be remade. Update following, shortly.
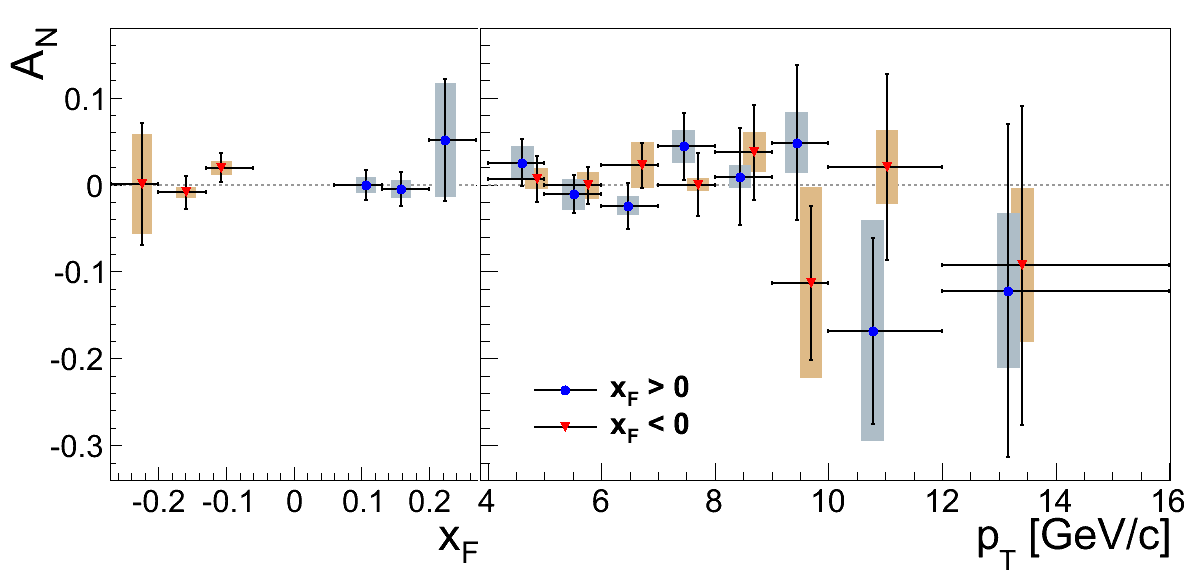
Steve has helped me remake the trees for the new run list. They, now, include additional information, such as, vertex rank and number of min-bias triggers. Here, I post near-preliminary figures, having recalculated the asymmetries and systematics for 342 runs. Trees are made for 92 more runs, however, I do not yet have polarization information for these runs. Steve has proposed new binning and new formattng of the money plots, both of which I have implemented.
Figure 1

Things look similar to before. It appears the statistical uncertainties are a bit smaller. A check of the files shows that the new sample contains 27% more pion candidates. Additionally, it appears the signal fractions are improved at lower kinematics. It will be worth checking that I have not left out a cut.
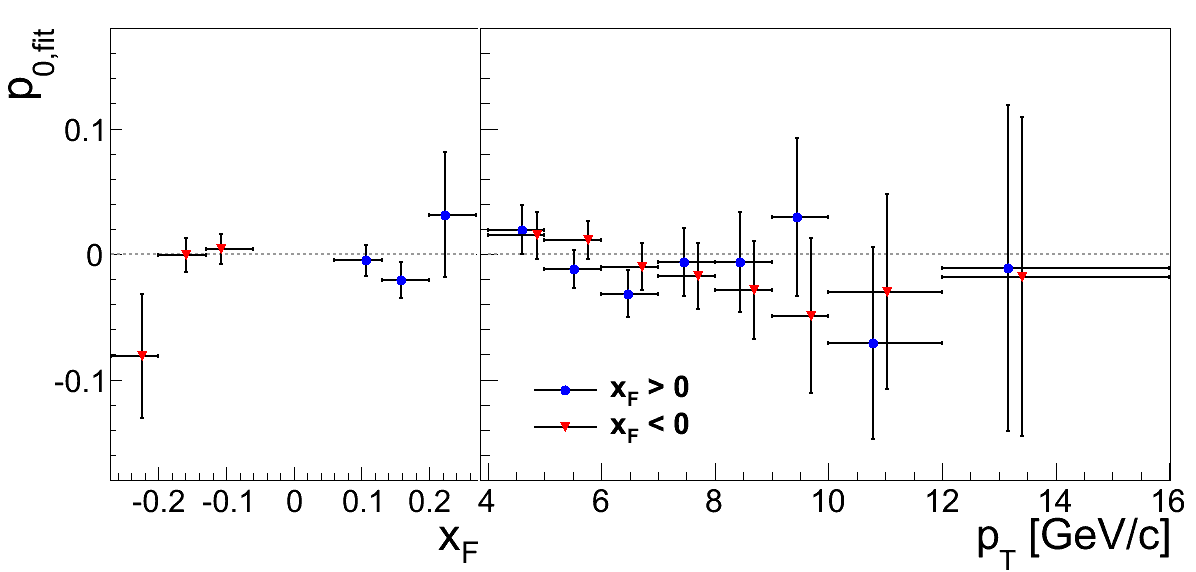
Figure 2

Table 1
| pT Blue | pT Yellow | xF Blue | xF Yellow | |
|---|---|---|---|---|
| χ2/ν | 4.62672/7 | 3.25558/7 | 1.40317/2 | 2.80999/2 |
| p0 | -0.00863651± 0.00907581 | -0.0000597341±0.00885016 | -0.0101762±0.00909157 | -0.000724428±0.00887082 |
Here I have fit the p0 distirbutions with a constant. The fits are nicely consistent with 0 with χ2/ν perhaps too good.
Table (xF > 0)
| AN | δAN Stat | δAN Total Syst | δAN B.g. Asym Syst | δAN Sig. Fit Param. Syst | δAN Sig. Frac. Syst | δAN Mass Window Syst | δAN Non-coll. Bg. Syst | |
|---|---|---|---|---|---|---|---|---|
| xF Bin 1 | -0.0006 | 0.0170 | 0.0094 | 0.0038 | 0.0004 | 0.0020 | 0.0081 | 0.0020 |
| xF Bin 2 | -0.0053 | 0.0198 | 0.0099 | 0.0065 | 0.0002 | 0.0006 | 0.0072 | 0.0020 |
| xF Bin 3 | 0.0511 | 0.0704 | 0.0656 | 0.0176 | 0.0388 | 0.0080 | 0.0492 | 0.0020 |
| pT Bin 2 | 0.0252 | 0.0269 | 0.0195 | 0.0003 | 0.0050 | 0.0186 | 0.0021 | 0.0020 |
| pT Bin 3 | -0.0110 | 0.0214 | 0.0178 | 0.0042 | 0.0004 | 0.0010 | 0.0171 | 0.0020 |
| pT Bin 4 | -0.0245 | 0.0264 | 0.0110 | 0.0076 | 0.0024 | 0.0040 | 0.0061 | 0.0020 |
| pT Bin 5 | 0.0440 | 0.0384 | 0.0192 | 0.0098 | 0.0101 | 0.0114 | 0.0060 | 0.0020 |
| pT Bin 6 | 0.0092 | 0.0554 | 0.0134 | 0.0115 | 0.0047 | 0.0013 | 0.0045 | 0.0020 |
| pT Bin 7 | 0.0483 | 0.0892 | 0.0353 | 0.0111 | 0.0311 | 0.0074 | 0.0099 | 0.0020 |
| pT Bin 8 | -0.1681 | 0.1071 | 0.1267 | 0.0139 | 0.0852 | 0.0265 | 0.0889 | 0.0020 |
| pT Bin 9 | -0.1220 | 0.1919 | 0.0889 | 0.0136 | 0.0734 | 0.0382 | 0.0294 | 0.0020 |
Currently, only one bin has systematic errors larger than the statistical uncertainties. In this bin the systematics are dominated by the fit parameters and the mass window. I currently still count the fit parameter errors in both the systematics and statistical uncertainties. The mass window leads for five bins, while the background asymmetry, fit parameter, and signal fraction each lead for two bins. Nowhere does the non-collision systematic lead, as discussed at the collaboration meeting. It is possible that the signal fraction systematic is no longer neede, in light of improved fitting and correctly propagated errors. I note that wherever the signal fraction systematic leads, the fit parameter systematic is the second leading contribution. It is also possible we may be able to improve the mass window systematic by taking multiple ranges and exctracting something like a normalized width of the distribution.
Table (xF < 0)
| AN | δAN Stat | δAN Total Syst | δAN B.g. Asym Syst | δAN Sig. Fit Param. Syst | δAN Sig. Frac. Syst | δAN Mass Window Syst | δAN Non-coll. Bg. Syst | |
|---|---|---|---|---|---|---|---|---|
| xF Bin 1 | 0.0190 | 0.0167 | 0.0081 | 0.0024 | 0.0013 | 0.0062 | 0.0040 | 0.0020 |
| xF Bin 2 | -0.0091 | 0.0192 | 0.0059 | 0.0044 | 0.0009 | 0.0027 | 0.0020 | 0.0020 |
| xF Bin 3 | 0.0008 | 0.0699 | 0.0577 | 0.0115 | 0.0006 | 0.0028 | 0.0565 | 0.0020 |
| pT Bin 2 | 0.0065 | 0.0263 | 0.0121 | 0.0004 | 0.0010 | 0.0037 | 0.0113 | 0.0020 |
| pT Bin 3 | -0.0009 | 0.0209 | 0.0156 | 0.0028 | 0.0001 | 0.0002 | 0.0152 | 0.0020 |
| pT Bin 4 | 0.0223 | 0.0258 | 0.0262 | 0.0050 | 0.0030 | 0.0051 | 0.0249 | 0.0020 |
| pT Bin 5 | -0.0001 | 0.0365 | 0.0073 | 0.0063 | 0.0000 | 0.0004 | 0.0032 | 0.0020 |
| pT Bin 6 | 0.0371 | 0.0548 | 0.0232 | 0.0077 | 0.0108 | 0.0061 | 0.0179 | 0.0020 |
| pT Bin 7 | -0.1129 | 0.0885 | 0.1096 | 0.0082 | 0.0636 | 0.0149 | 0.0876 | 0.0020 |
| pT Bin 8 | 0.0200 | 0.1068 | 0.0425 | 0.0119 | 0.0106 | 0.0036 | 0.0392 | 0.0020 |
| pT Bin 9 | -0.0928 | 0.1836 | 0.0888 | 0.0084 | 0.0593 | 0.0230 | 0.0615 | 0.0020 |
For xF < 0, the mass window leads 8 bins, while the background asymmetry leads 2 and the signal fraction leads 1. It is definitely worth revisiting the mass window systematic for the paper.
- drach09's blog
- Login or register to post comments
