- drach09's home page
- Posts
- 2022
- 2020
- June (1)
- 2019
- 2018
- 2017
- 2016
- 2015
- 2014
- December (13)
- November (2)
- October (5)
- September (2)
- August (8)
- July (9)
- June (7)
- May (5)
- April (4)
- March (4)
- February (1)
- January (2)
- 2013
- December (2)
- November (8)
- October (5)
- September (12)
- August (5)
- July (2)
- June (3)
- May (4)
- April (8)
- March (10)
- February (9)
- January (11)
- 2012
- 2011
- October (1)
- My blog
- Post new blog entry
- All blogs
Run-11 Transverse Jets: VPDMB Transverse Momentum Investigation (Part I)
In a previous blog I noticed an odd bump in the VPDMB pT spectrum (Fig. 1). Carl and Renee suggested it looked like a hot tower issue. Here I show some plots investigating the cause of this issue.
Figure 1
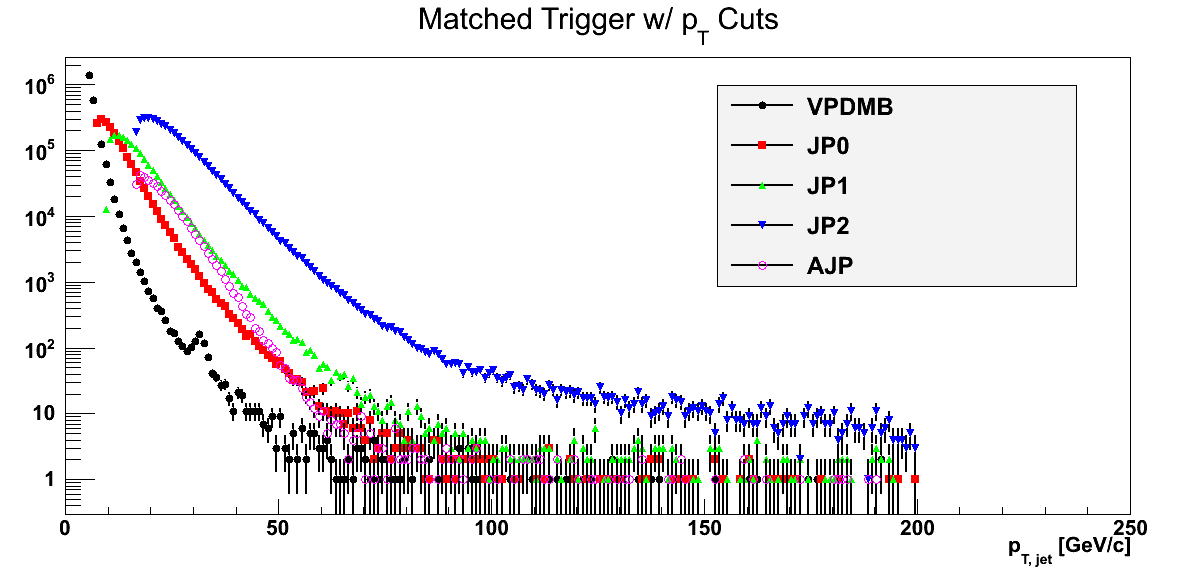
It appears there is evidence of hot towers in the VPDMB data, however, not isolated to a particular fill or run. There are several fills, e.g., 15154, 15155, 15160, 15163, 15170, 15172, and 15380, which demonstrate what appears to be a hot tower at (η,φ) = (0.5,-1). It does not appear that within these fills the tower is isolated to a particular run. Further, it is not clear that the spike in pT is correlated to these hot towers. Removing the aforementioned fills from the spectrum does not appear to have a qualitative effect on the spectrum.
Figure 2: Fill 15160
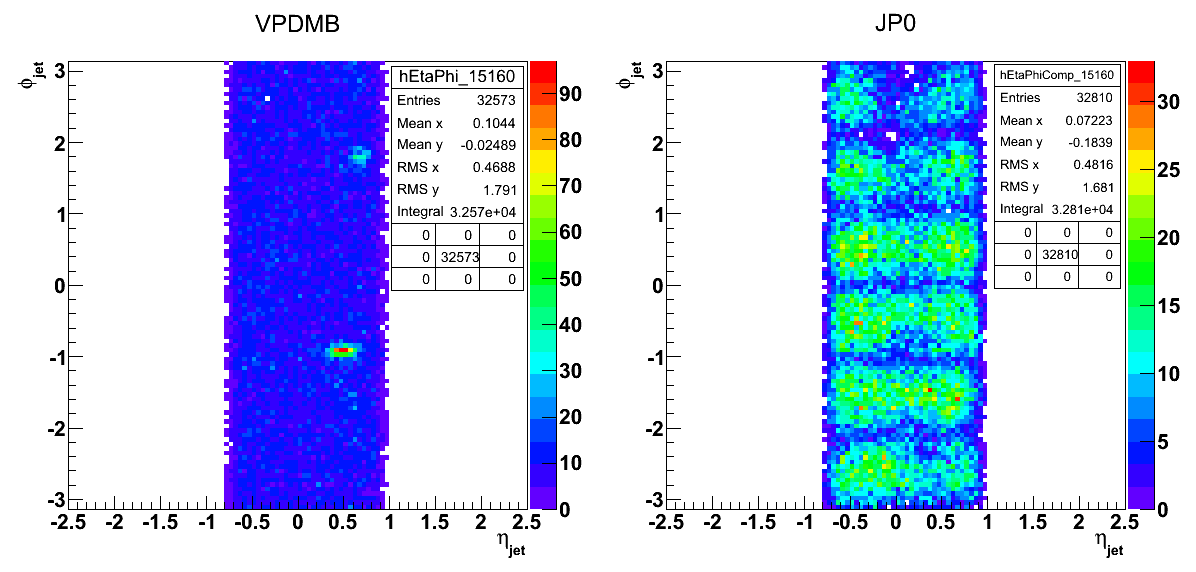
Figure 1 shows the η-φ scatter plots for VPDM and JP0 for fill 15160. In VPDMB there appears to be a hot tower at (0.5,-1) and perhaps also at (0.7,1.8), while simultaneously no such sign in JP0.
Figure 3: Total vs. Fills 15154, 15155, 15160, 15163, 15170, 15172, and 15380

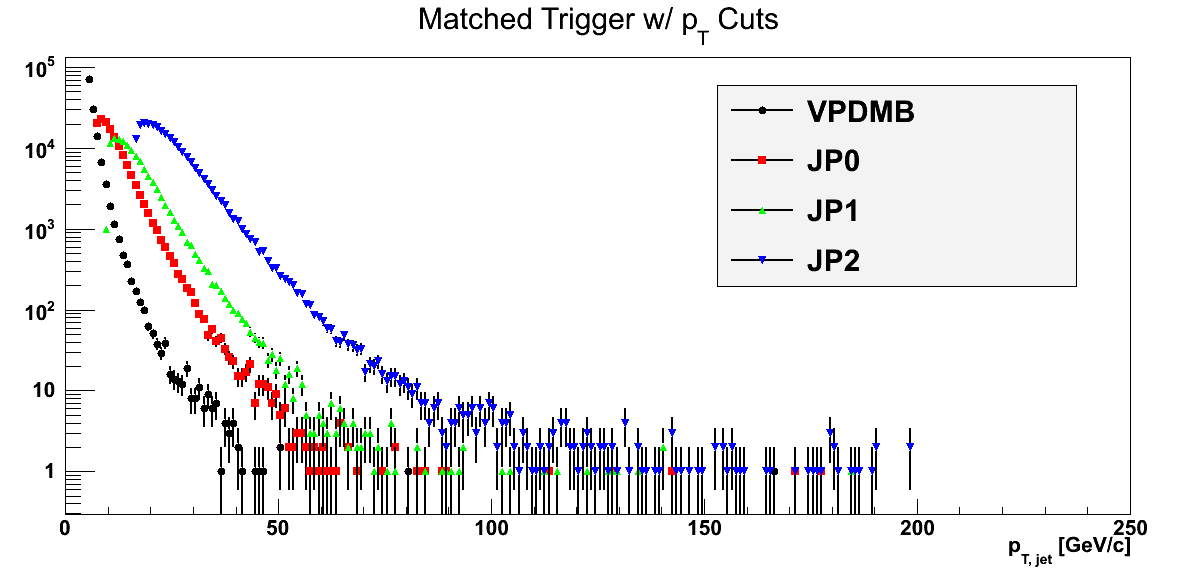
Figure 2 shows the pT spectra for the listed fills (right) in comparison to the total spectra (left) (note, I now group AJP in with JP2). Were the spike in pT correlated with the hot tower at (0.5,-1) I would expect the vast majority of yield around 30 GeV to occur in the specified fills. One can see this is not the case.
Figure 4: Fill 15324
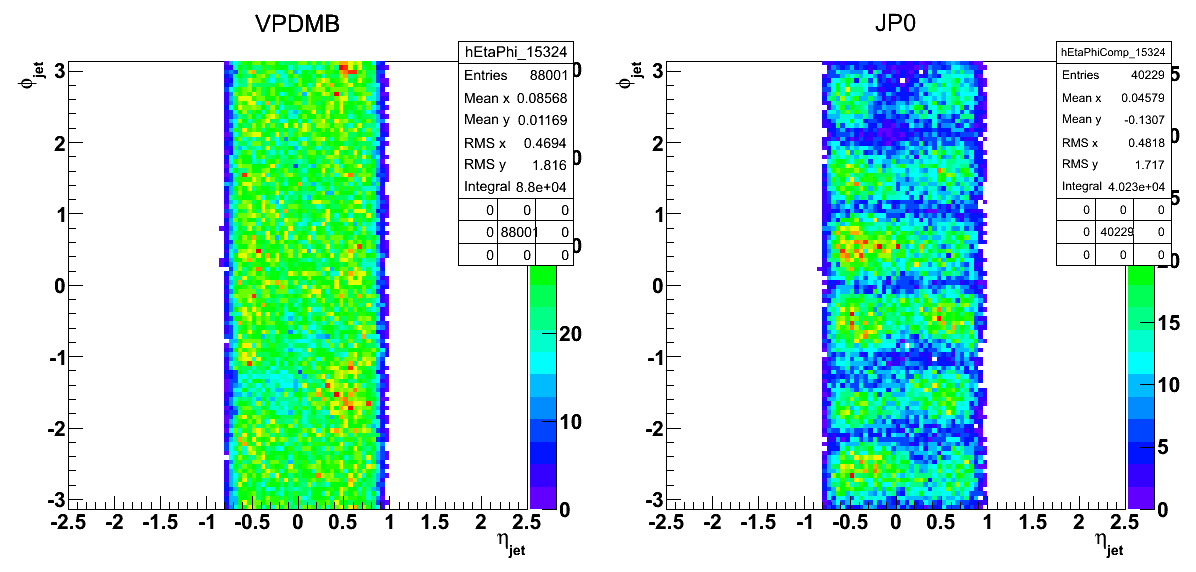
There is also some sign of something occuring around (0.5,-1.5) (and possibly at (0.5,3)). In Fig. 2, I show the scatter plot for fill 15324. There appears to be a patch of higher multiplicity in VPDMB around the two aforementioned regions. Again, there is no sign of this in JP0. The patch at (0.5,1.5) is more visible in fill 15337 (see attached PDF) at which point the hot tower at (0.5,3) appears to be gone.
To investigate this further I have submitted a pass over all trees isolating events with VPDMB triggers and 29 < pT,jet < 34 GeV/c. This should help isolate the region or regions correlated to the spike in pT.
Figure 5
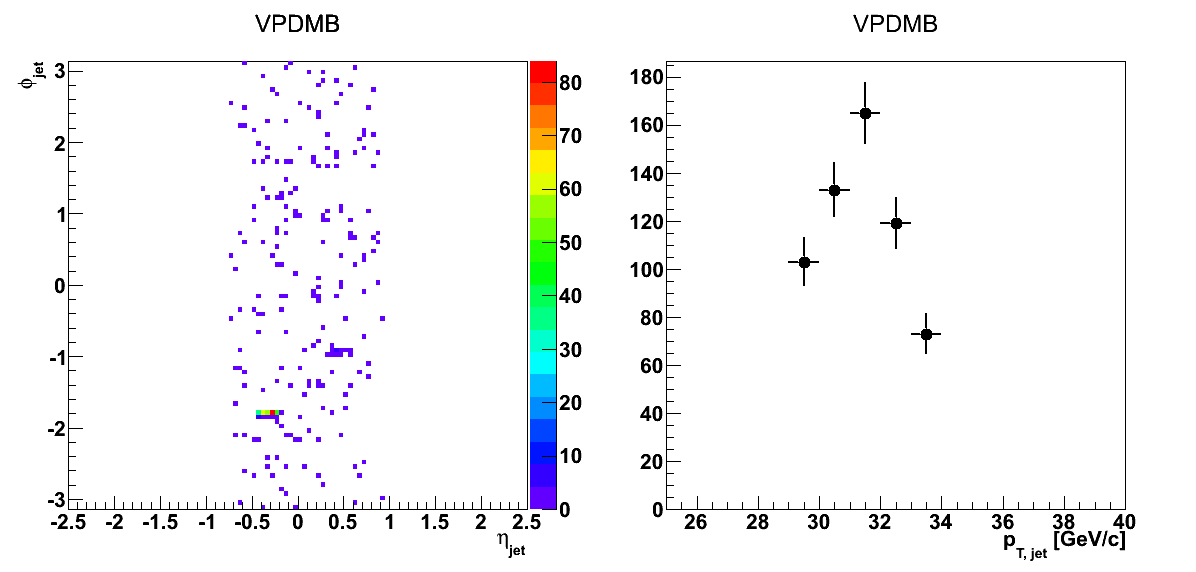
Figure 4 shows the scatter plot for VPDMB jets with 29 < pT < 34. It does appear these jets correlate somewhat with a localized region of (η,φ) = (-0.3,-1.8). About 48% of the jets within this pT range fall within -0.45 < η < 0.15 and -1.82 < φ < -1.76. This seems to mesh with a naïve approximation of the jet yield in the "peak" above the falling pT continuum.
Summary
Figure 6
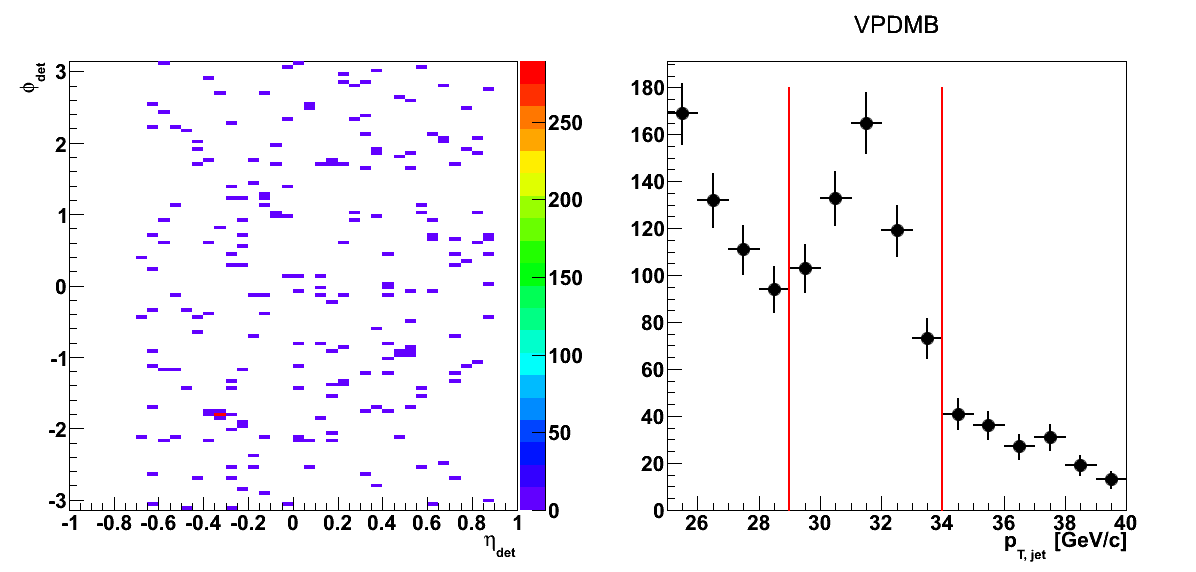
In Fig. 6 I plot the scatter plot from Fig. 5 rebinned and in terms of "detector-η," ηdet. The hot tower around (-0.3,-1.8) appears to account for the non-physical portion of the pT spectrum. This tower appears to be BEMC tower 3407 which is masked out in L0.
Figure 7
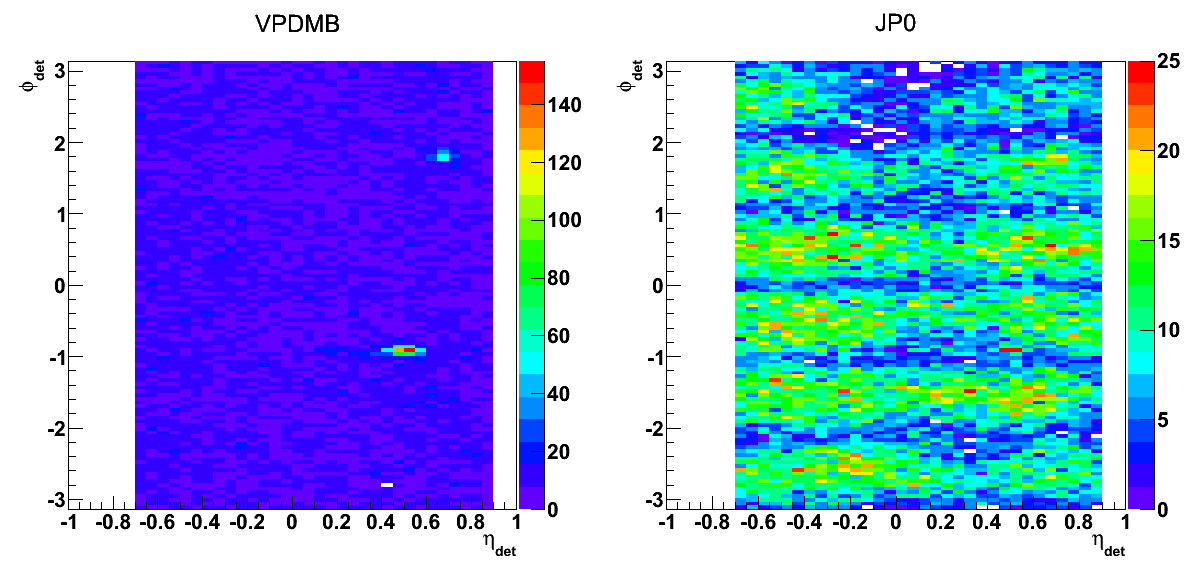
In Fig. 7 I plot the scatter plots from Fig. 2 rebinned and in terms of "detector-η," ηdet. A hot tower appears in VPDMB around (0.5,-1) and possibly another at (0.6,1.8), but neither yet appear to affect the pT spectrum. The most prominent tower (0.5,-1) is BEMC tower 851, and the secondary tower appears to be BEMC tower 2214. Both are masked in L0.
Figure 8
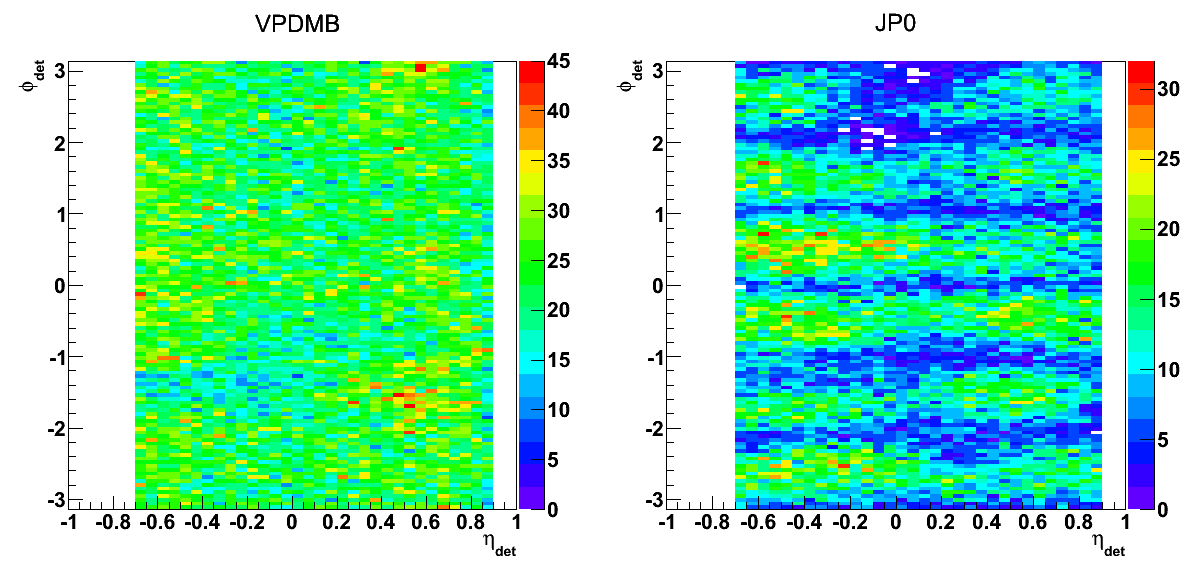
In Fig. 8 I plot the scatter plot from Fig. 4 rebinned and in terms of "detector-η," ηdet. There appears to be a potential hot tower around (0.5,3) and a splatter of stuff around (0.5,-1.5), but so far no effect appears in the pT spectrum.
Figure 9
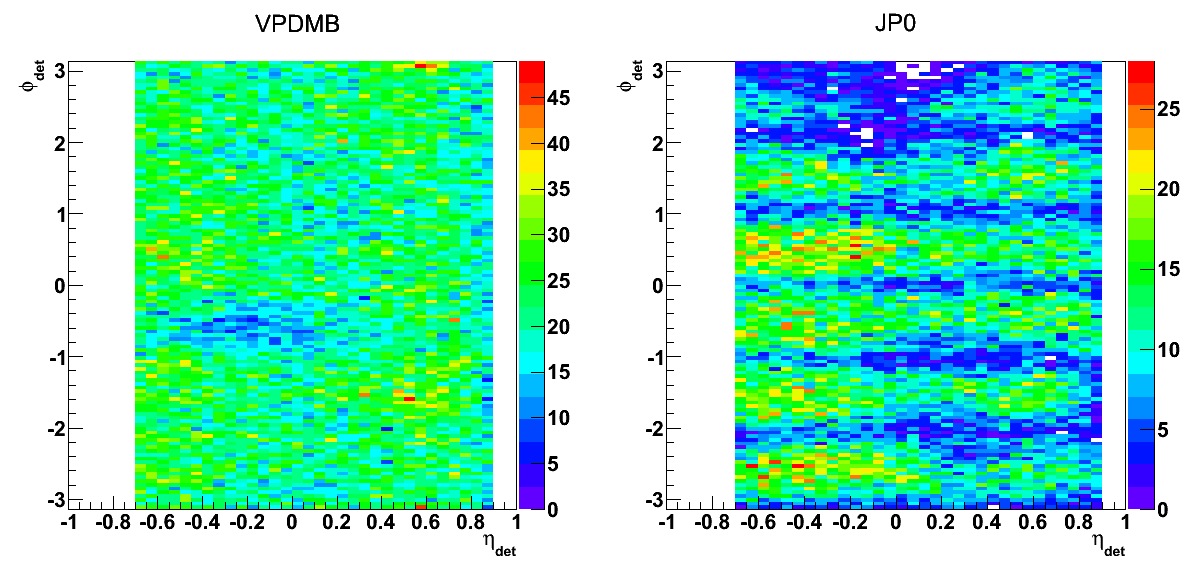
In Fig. 9 I plot the scatter plots for fill 15338 in terms of ηdet. The hot tower around (0.5,3) appears to be present, again; and the high-multiplicity region appears possibly to be more focused around a tower near (0.5,-1.6). This does not appear to be conclusive, but it could indicate the high-multiplicity region is tied to another hot tower. We shall see.
- drach09's blog
- Login or register to post comments
