- drach09's home page
- Posts
- 2022
- 2020
- June (1)
- 2019
- 2018
- 2017
- 2016
- 2015
- 2014
- December (13)
- November (2)
- October (5)
- September (2)
- August (8)
- July (9)
- June (7)
- May (5)
- April (4)
- March (4)
- February (1)
- January (2)
- 2013
- December (2)
- November (8)
- October (5)
- September (12)
- August (5)
- July (2)
- June (3)
- May (4)
- April (8)
- March (10)
- February (9)
- January (11)
- 2012
- 2011
- October (1)
- My blog
- Post new blog entry
- All blogs
Run-12 Transverse Jets: Collins in Eta Bins
I found that in my previous updates I used about 50 or so more runs than did Kevin in his measurement. This should account for much of the uncertainty difference we see. I have, now, removed those runs from my list for a more direct comparison. The results, here, still include the geometric trigger which will grow my statistical uncertainties relative to Kevin's. Additionally, I now examine the effect of binning in pseudorapidity. I use the same bins as for the Sivers measurement: |η| < 0.5 and 0.5 < |η| < 1. Now, the asymmetries are calculated fill-by-fill and the weighted averages are performed over fill, trigger, beam, and eta. This will add an additional increase to the over-all uncertainty, since I will lose a few events from splicing the data and requiring all 12 azimuthal bins be filled for each detector half and each spin state.
pT > 9.9 GeV/c
The higher pT jets are more sensitive to quark effects. Thus, one expects the largest Collins signal to come from the high-pT jets. I have chose 9.9 to correlate with my definition of jet-pT bin edges. This is also a slight departure from Kevin's analysis where he places the cut-off at the more nicely round number of 10 GeV/c.
Figure 1: Total Range of Pseudorapidity
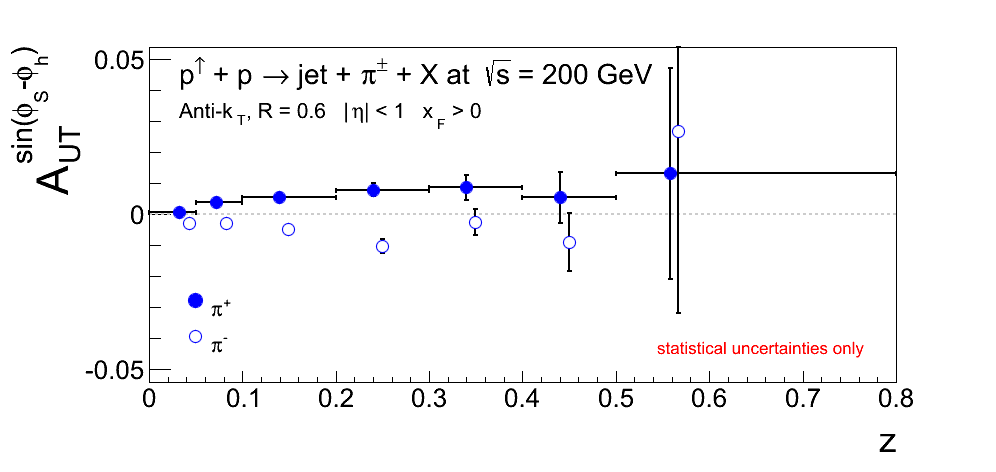
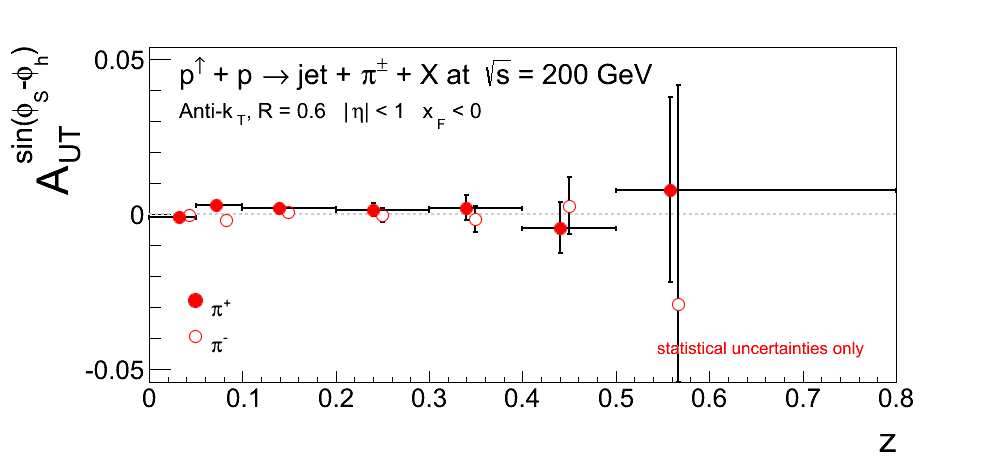
Figure 2: |η| < 0.5
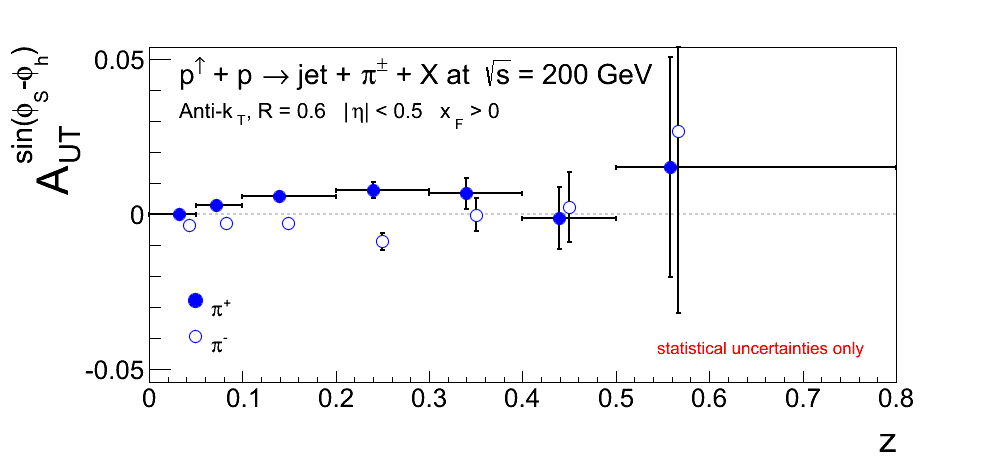
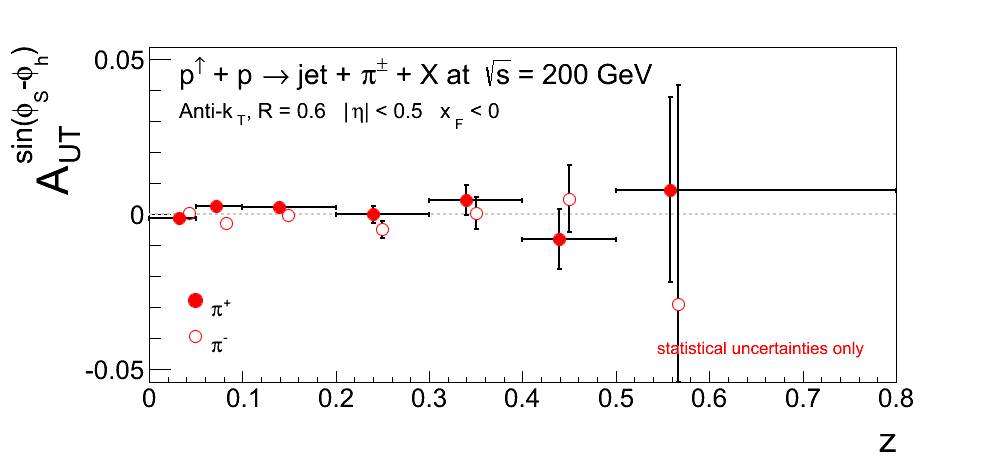
Figure 3: 0.5 < |η| < 1
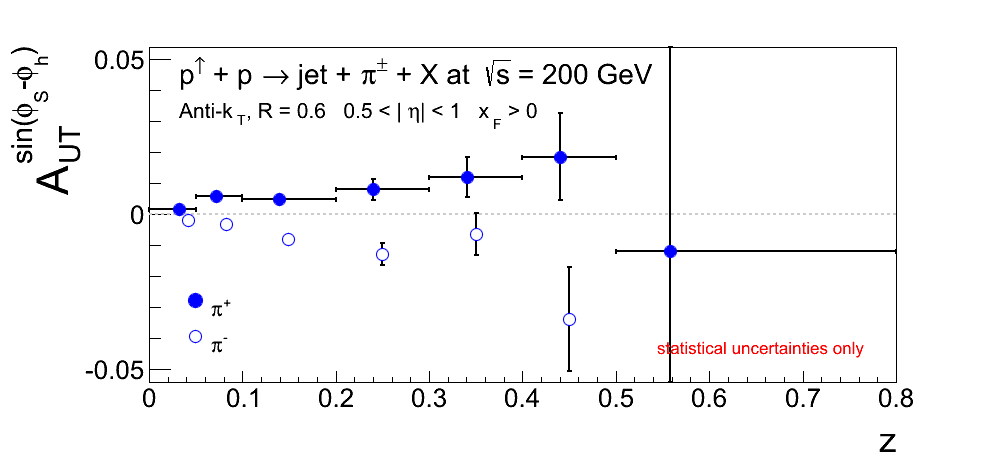
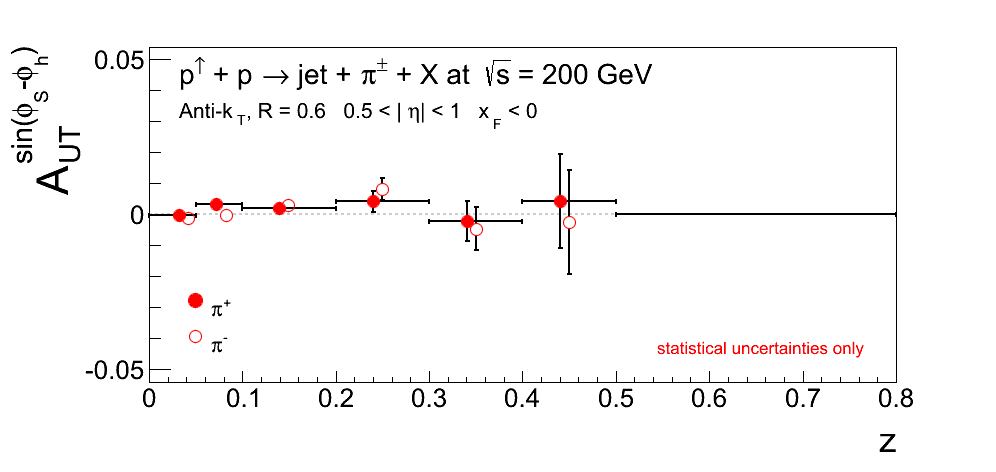
Table 1: π+
| xF > 0 | xF < 0 | |||||||||||
| η Range | Linear Fit | Uncertainty | χ2/ν | Constant Fit | Uncertainty | χ2/ν | Linear Fit | Uncertainty | χ2/ν | Constant Fit | Uncertainty | χ2/ν |
| |η| < 1 | 0.0357 | 0.00458 | 5.430/5 | 0.00368 | 0.000537 | 19.34/6 | 0.0119 | 0.00457 | 8.510/5 | 0.00134 | 0.000537 | 9.095/6 |
| |η| < 0.5 | 0.0324 | 0.00573 | 5.036/5 | 0.00317 | 0.000673 | 14.76/6 | 0.0105 | 0.00566 | 7.393/5 | 0.00113 | 0.000666 | 7.962/6 |
| 0.5 < |η| < 1 | 0.0415 | 0.00760 | 4.441/5 | 0.00457 | 0.000891 | 7.961/6 | 0.0146 | 0.00776 | 3.357/5 | 0.00173 | 0.000907 | 3.273/6 |
Table 2: π-
| xF > 0 | xF < 0 | |||||||||||
| η Range | Linear Fit | Uncertainty | χ2/ν | Constant Fit | Uncertainty | χ2/ν | Linear Fit | Uncertainty | χ2/ν | Constant Fit | Uncertainty | χ2/ν |
| |η| < 1 | -0.0335 | 0.00476 | 10.02/5 | -0.00375 | 0.000546 | 12.27/6 | -0.00206 | 0.00475 | 5.163/5 | -0.000510 | 0.000546 | 4.477/6 |
| |η| < 0.5 | -0.0248 | 0.00595 | 10.60/5 | -0.00327 | 0.000684 | 5.149/6 | -0.0101 | 0.00588 | 6.650/5 | -0.00110 | 0.000677 | 6.960/6 |
| 0.5 < |η| < 1 | -0.0489 | 0.00794 | 3.309/4 | -0.00461 | 0.000908 | 15.54/5 | 0.0131 | 0.00806 | 6.075/5 | 0.000590 | 0.000924 | 8.314/6 |
The numbers for the full η range are very similar to those I had before. The linear fits are quite reasonable. The magnitudes are consistent for π+ and π- with opposite charge-sign. The slopes are of 7.8σ and 7.1σ significance, respectively. For the η bins, the asymmetries are also consistent in magnitude with opposite sign between the two charge-states. For central pseudorapidity I find an asymmetry of 6.8σ and 6.9σ, respectively. There is a hint of increase in the z-dependence as one moves forward in η, but the statistical significance is quite small (< 1σ for π+ and 2.43σ for π-). Similarly, when one integrates over all bins one finds hints--but nothing more--of an increase in the asymmetry as one moves forward in η (1.25σ for π+ and 1.18σ for π-).
pT < 9.9 GeV/c
While low-pT jets are more sensitive to gluonic subprocesses we benefit from a tremendous amount of statistics. Additionally, they may be quite useful in comparison to the Run-11 results. Kevin has already posted low-pT Collins asymmetries; and I, now, post my independent analysis.
Figure 4: |η| < 1
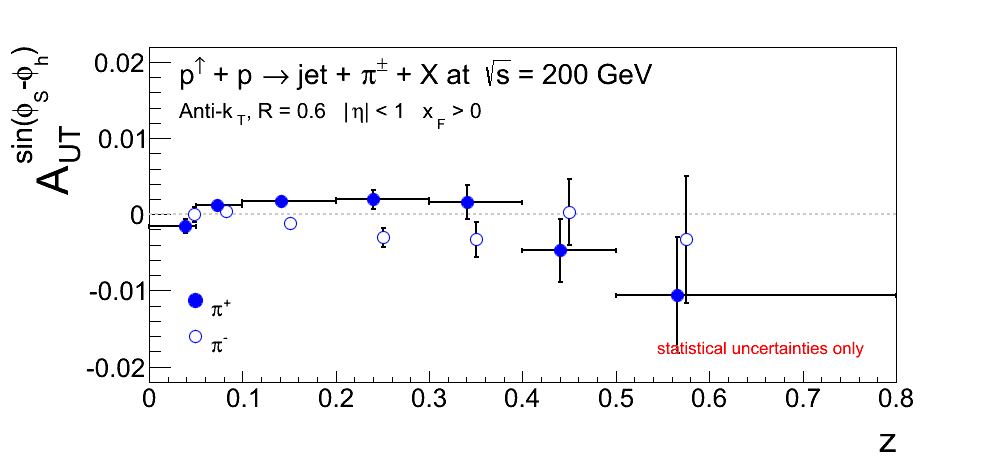
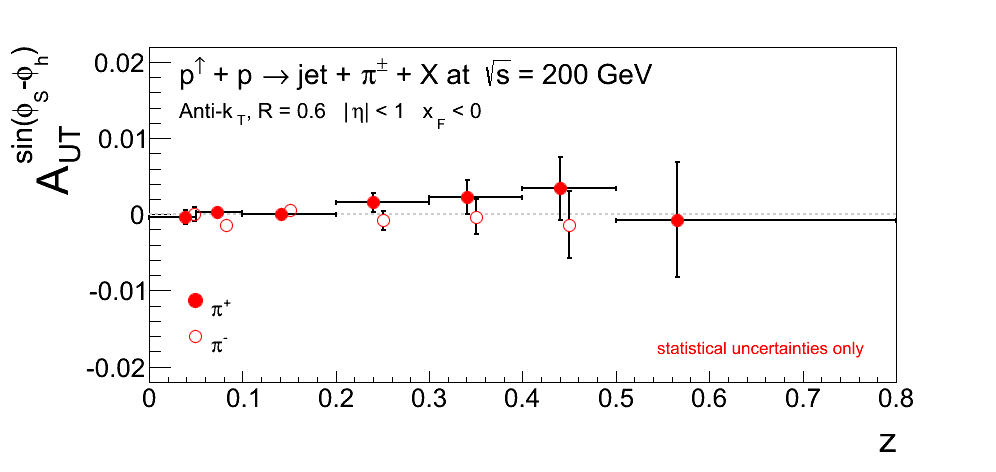
Figure 5: |η| < 0.5
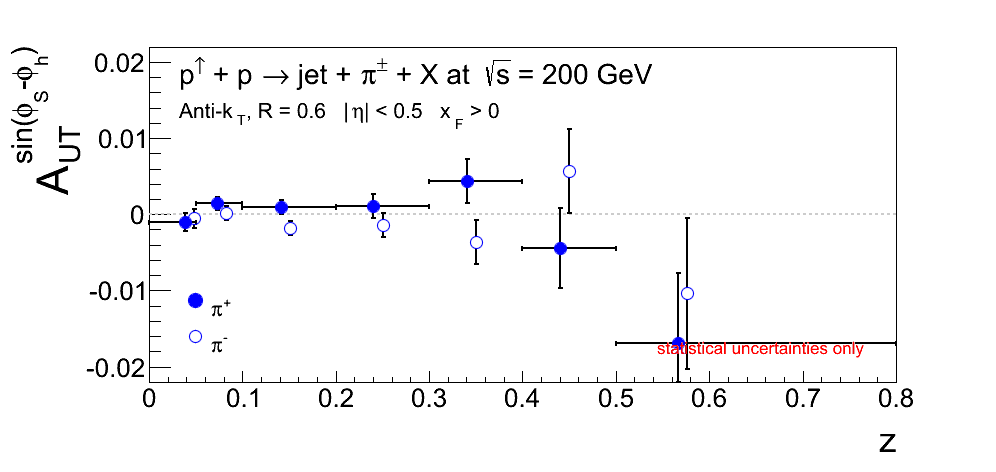
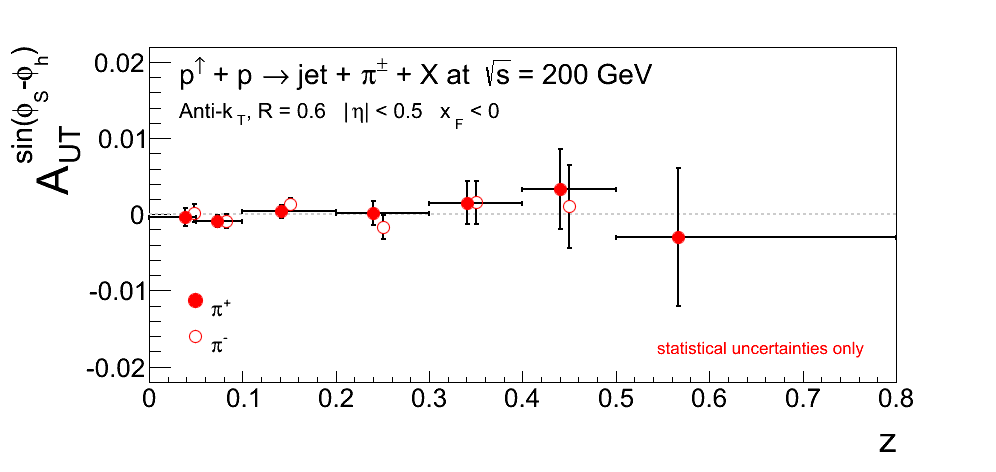
Figure 6: 0.5 < |η| < 1
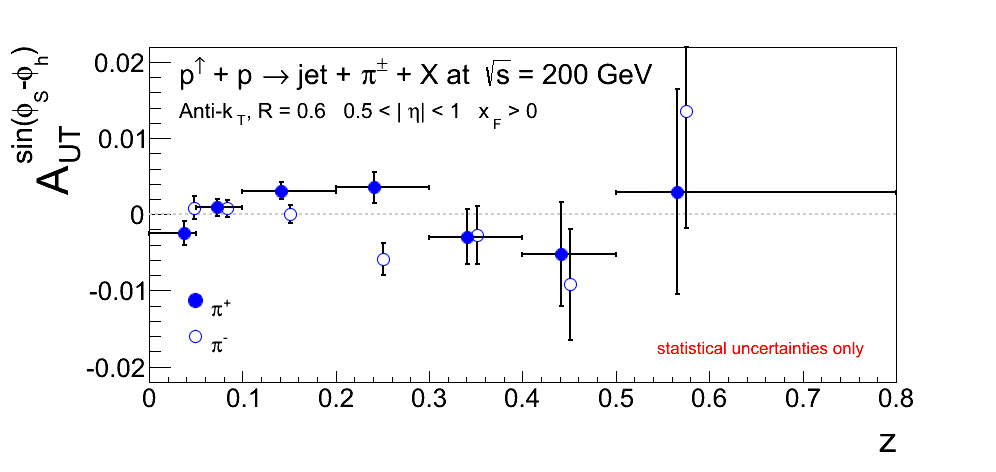
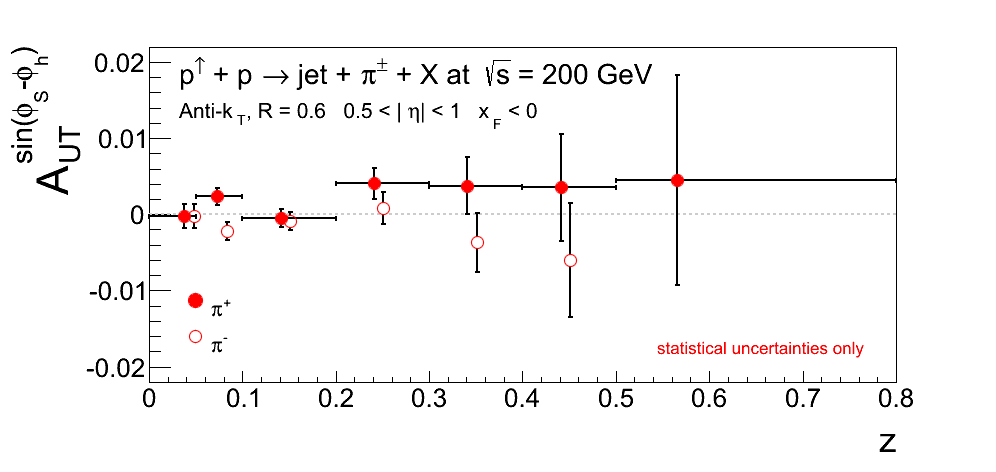
Table 3: π+
| xF > 0 | xF < 0 | |||||||||||
| η Range | Linear Fit | Uncertainty | χ2/ν | Constant Fit | Uncertainty | χ2/ν | Linear Fit | Uncertainty | χ2/ν | Constant Fit | Uncertainty | χ2/ν |
| |η| < 1 | 0.00629 | 0.00276 | 13.26/5 | 0.000908 | 0.000401 | 13.31/6 | 0.00401 | 0.00276 | 1.497/5 | 0.000320 | 0.000400 | 2.972/6 |
| |η| < 0.5 | 0.00474 | 0.00348 | 9.694/5 | 0.000793 | 0.000506 | 9.092/6 | 0.00102 | 0.00343 | 2.076/5 | -0.000159 | 0.000499 | 2.062/6 |
| 0.5 < |η| < 1 | 0.00892 | 0.00455 | 10.92/5 | 0.00110 | 0.000658 | 11.97/6 | 0.00944 | 0.00462 | 5.446/5 | 0.00118 | 0.000667 | 6.500/6 |
Table 4: π-
| xF > 0 | xF < 0 | |||||||||||
| η Range | Linear Fit | Uncertainty | χ2/ν | Constant Fit | Uncertainty | χ2/ν | Linear Fit | Uncertainty | χ2/ν | Constant Fit | Uncertainty | χ2/ν |
| |η| < 1 | -0.00761 | 0.00283 | 3.581/5 | -0.000670 | 0.000408 | 8.111/6 | -0.00392 | 0.00282 | 16.83/5 | -0.000473 | 0.000406 | 17.41/6 |
| |η| < 0.5 | -0.00736 | 0.00354 | 4.662/5 | -0.000894 | 0.000514 | 5.945/6 | -0.00130 | 0.00350 | 12.81/5 | -5.09e-05 | 0.000507 | 12.93/6 |
| 0.5 < |η| < 1 | -0.00805 | 0.00470 | 8.575/4 | -0.000288 | 0.000671 | 11.33/5 | -0.00877 | 0.00475 | 8.380/5 | -0.00123 | 0.000679 | 8.504/6 |
Thus, for the full η range the charge-sign-dependence is still quite significant (3.5σ), however, the size of the effects and significance of the z-dependence is quite reduced relative to high-pT jets. The integrated asymmetry returns a charge-sign-dependence of 2.76σ. The quality of the constant fit is also much better than in the high-pT case. There are hints of an η-dependence, but nothing significant.
Summary
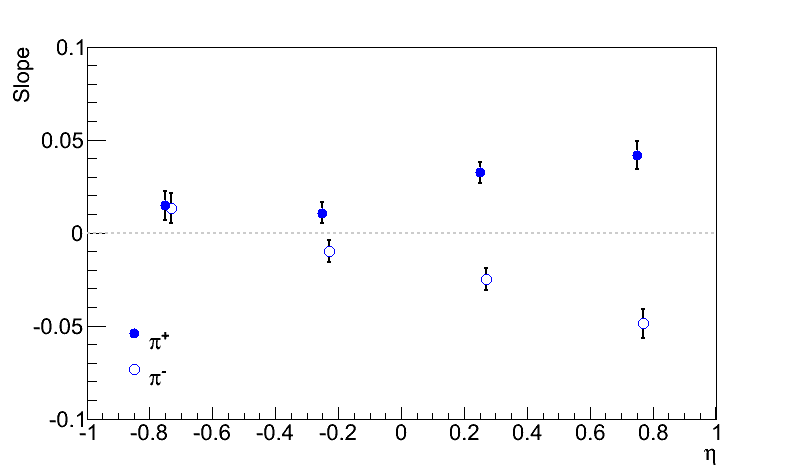
Figure 7
| pT > 9.9 GeV/c | pT < 9.9 GeV/c |
 |
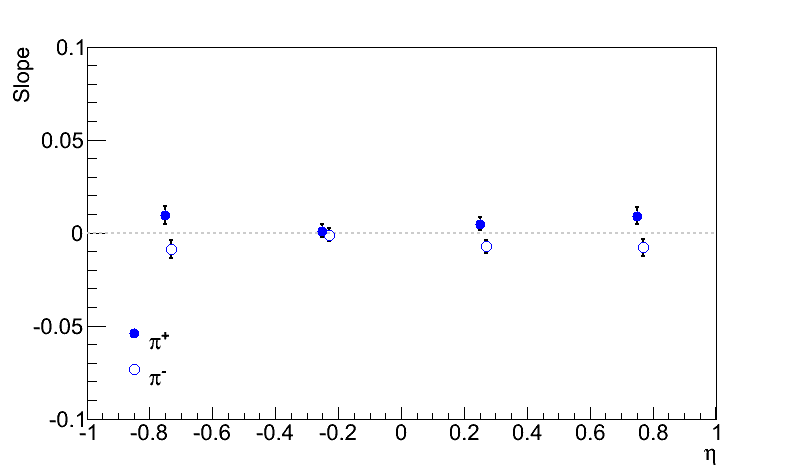 |
Anselm asked for a plot of the slopes as a function of η. In Fig. 7 I show the slope dependence on η. There does appear to be a fairly linear dependence on η which seems to scale with pT. I'm bothered a bit by the high-η behavior, but perhaps it is not statistically significant. A double-check by Kevin will be quite useful, here.
- drach09's blog
- Login or register to post comments
