- drach09's home page
- Posts
- 2022
- 2020
- June (1)
- 2019
- 2018
- 2017
- 2016
- 2015
- 2014
- December (13)
- November (2)
- October (5)
- September (2)
- August (8)
- July (9)
- June (7)
- May (5)
- April (4)
- March (4)
- February (1)
- January (2)
- 2013
- December (2)
- November (8)
- October (5)
- September (12)
- August (5)
- July (2)
- June (3)
- May (4)
- April (8)
- March (10)
- February (9)
- January (11)
- 2012
- 2011
- October (1)
- My blog
- Post new blog entry
- All blogs
Run-12 Transverse Jets: New Look at Sivers
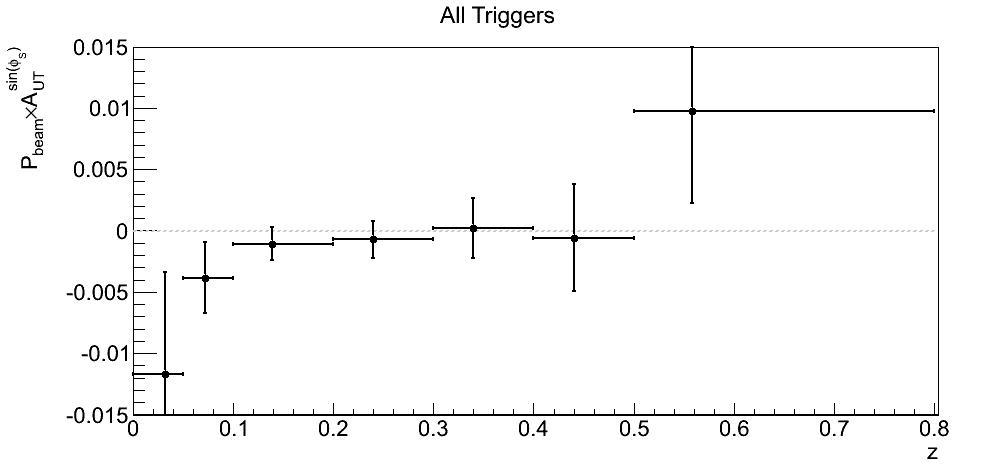
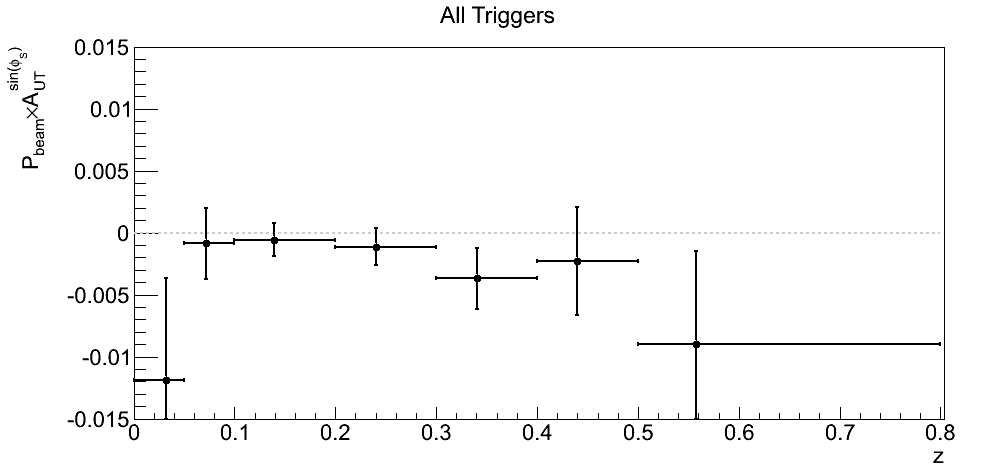
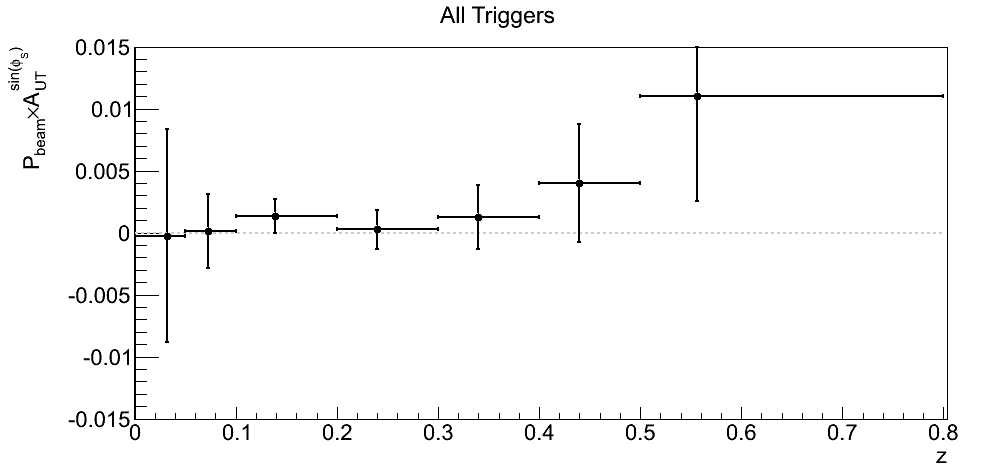
Thus far, we have focused our Sivers analyses on inclusive jet asymmetries. The size of the effects indicates a negligible Sivers effect at mid-rapidity for a combination of quarks and gluons. One other way to look at the Sivers asymmetry--with possibly a more clear path to constrain the quark Sivers effect--is to tag jets with leading charged pions. Below, I look at the Sivers asymmetry for jets whose leading (highest-z) fragmentation particle is a charged pion. I bin the asymmetries as a function of leading-pion z. A signal may offer insight into u and d-quark Sivers functions. Plots are not corrected for polarization.
pT > 9.9 GeV/c
Figure 1
| xF > 0 (π+) | xF < 0 (π+) |
 |
 |
| xF > 0 (π-) | xF < 0 (π-) |
 |
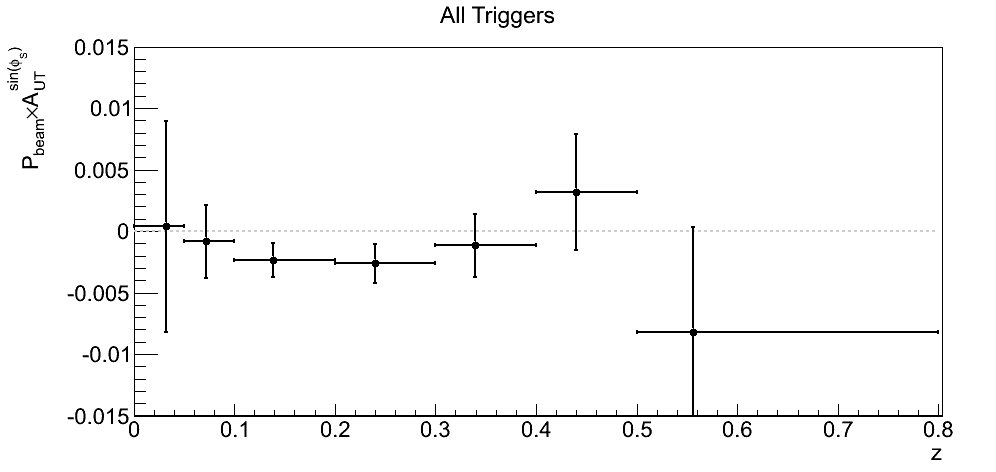 |
The leading pion asymmetries are quite small, much like the inclusive jet asymmetries.
Figure 2
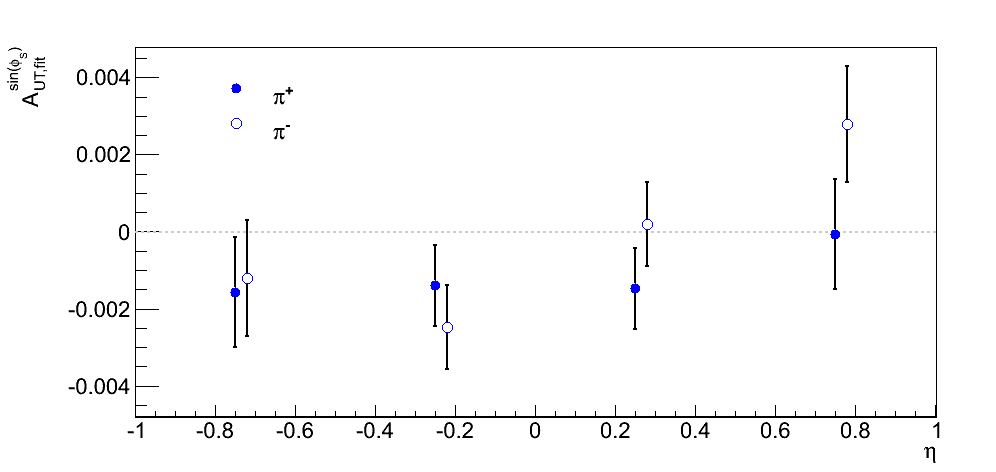
In Fig. 2 I show the results of a constant fit to the leading pion asymmetries as a function of η, relative to the direction of the polarized beam. Note that the asymmetries in Fig. 2 have not been corrected for polarization.
Table 1
| η-Range | Charge | AUT | Error | χ2/ν |
| 0 < η < 1 | + | -0.0009998 | 0.000846 | 4.965/6 |
| 0 < η < 0.5 | + | -0.00147 | 0.00105 | 8.233/6 |
| 0.5 < η < 1 | + | -7.015e-05 | 0.00143 | 6.969/6 |
| -1 < η < 0 | + | -0.00145 | 0.000846 | 4.041/6 |
| -0.5 < η < 0 | + | -0.00139 | 0.00105 | 3.318/6 |
| -1 < η < -0.5 | + | -0.00157 | 0.00143 | 3.947/6 |
| 0 < η < 1 | - | 0.00107 | 0.000884 | 2.183/6 |
| 0 < η < 0.5 | - | 0.000183 | 0.00109 | 2.723/6 |
| 0.5 < η < 1 | - | 0.00279 | 0.00150 | 3.154/6 |
| -1 < η < 0 | - | -0.00201 | 0.000884 | 2.276/6 |
| -0.5 < η < 0 | - | -0.00247 | 0.00109 | 3.991/6 |
| -1 < η < -0.5 | - | -0.00121 | 0.00150 | 2.500/6 |
Table 1 shows the results of the constant fits.
pT < 9.9 GeV/c
Figure 3
| xF > 0 (π+) | xF < 0 (π+) |
 |
 |
| xF > 0 (π-) | xF < 0 (π-) |
 |
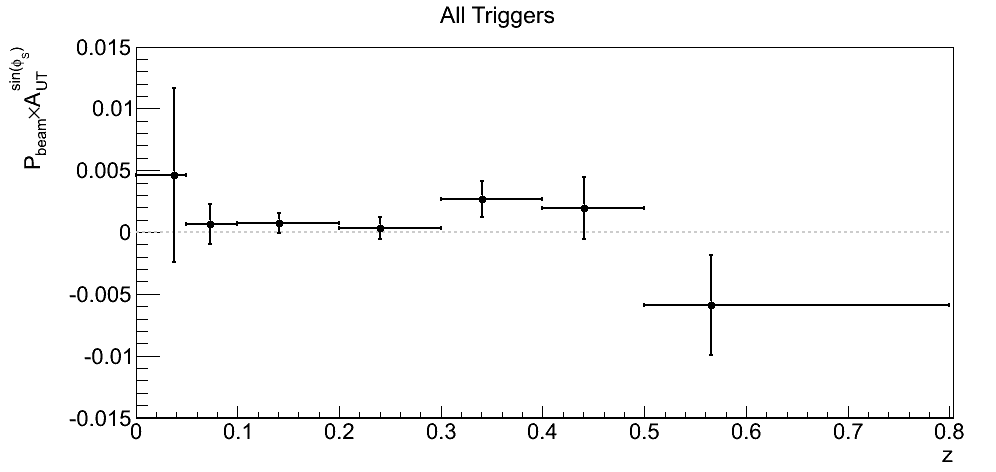 |
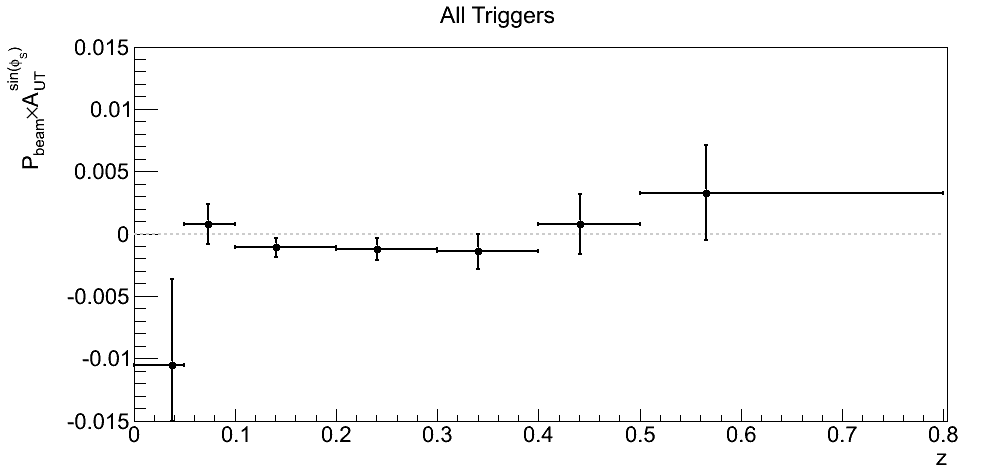
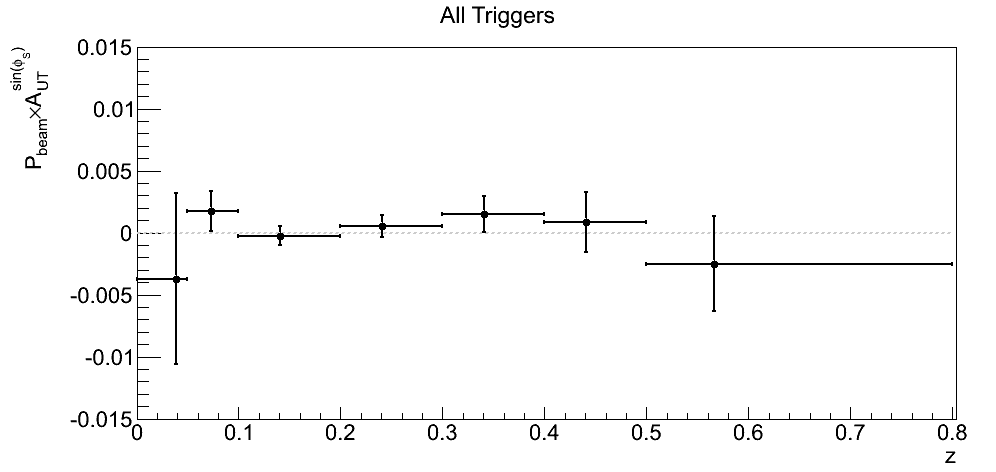
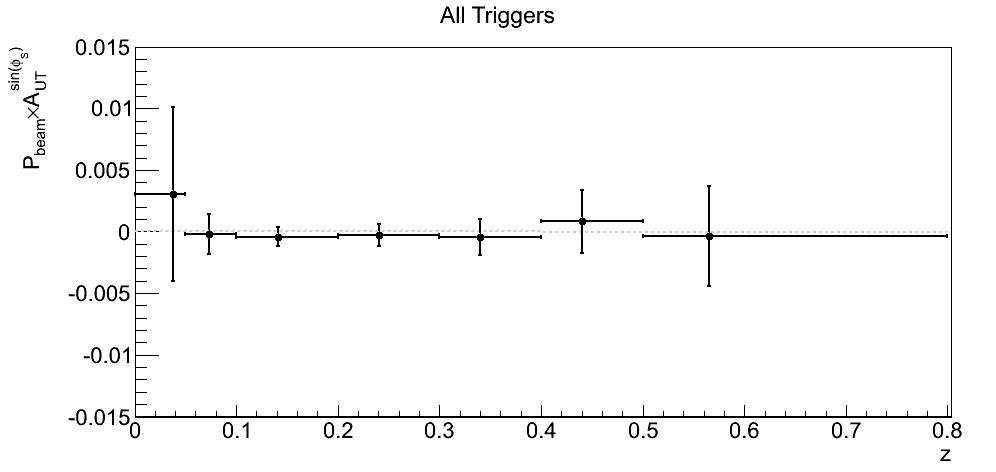
The leading pion asymmetries are quite small, much like the inclusive jet asymmetries.
Figure 4
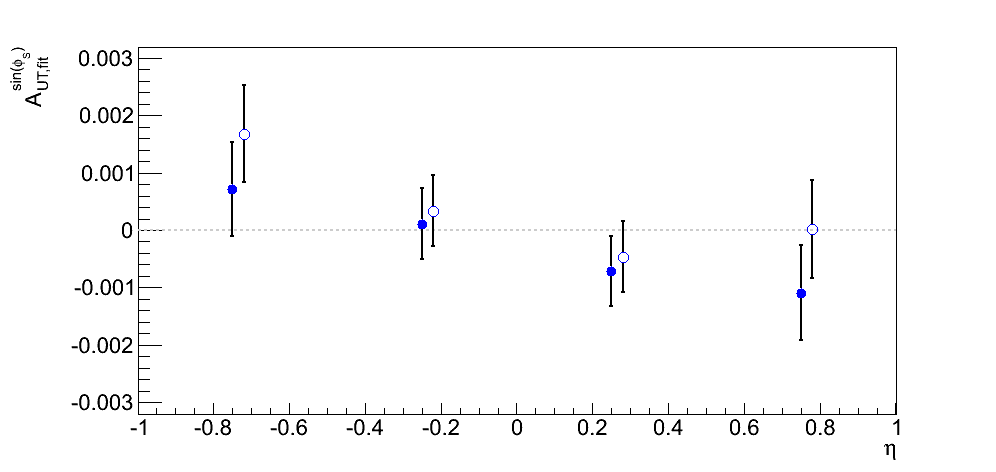
In Fig. 4 I show the results of a constant fit to the leading pion asymmetries as a function of η, relative to the direction of the polarized beam. Note that the asymmetries in Fig. 4 have not been corrected for polarization.
Table 2
| η-Range | Charge | AUT | Error | χ2/ν |
| 0 < η < 1 | + | -0.000896 | 0.000492 | 5.057/7 |
| 0 < η < 0.5 | + | -0.000712 | 0.000614 | 1.947/7 |
| 0.5 < η < 1 | + | -0.00109 | 0.000826 | 10.64/6 |
| -1 < η < 0 | + | 0.000363 | 0.000492 | 3.147/7 |
| -0.5 < η < 0 | + | 0.000112 | 0.000614 | 5.448/7 |
| -1 < η < -0.5 | + | 0.000717 | 0.000826 | 6.565/6 |
| 0 < η < 1 | - | -0.000295 | 0.000502 | 0.639/7 |
| 0 < η < 0.5 | - | -0.000464 | 0.000624 | 4.165/7 |
| 0.5 < η < 1 | - | 1.894e-05 | 0.000851 | 8.584/7 |
| -1 < η < 0 | - | 0.000790 | 0.000502 | 5.234/7 |
| -0.5 < η < 0 | - | 0.000338 | 0.000624 | 5.961/7 |
| -1 < η < -0.5 | - | 0.00168 | 0.000851 | 7.259/7 |
Table 2 shows the results of the constant fits.
- drach09's blog
- Login or register to post comments
