- drach09's home page
- Posts
- 2022
- 2020
- June (1)
- 2019
- 2018
- 2017
- 2016
- 2015
- 2014
- December (13)
- November (2)
- October (5)
- September (2)
- August (8)
- July (9)
- June (7)
- May (5)
- April (4)
- March (4)
- February (1)
- January (2)
- 2013
- December (2)
- November (8)
- October (5)
- September (12)
- August (5)
- July (2)
- June (3)
- May (4)
- April (8)
- March (10)
- February (9)
- January (11)
- 2012
- 2011
- October (1)
- My blog
- Post new blog entry
- All blogs
Run-12 Transverse Jets: Collins Asymmetries Trigger-by-trigger
Comparing the various triggers allows us to use data-driven methods to estimate trigger bias. Here, I show the Collins asymmetries broken down into the various trigger contributions.
Transverse Momentum Dependence
For the pT-dependence study, I revise my trigger definitions. The jet events are placed into the lowest available trigger. Note, also, the trigger simulator is not yet available in the jet trees, so "fire" implies the hardware trigger. The definitions are as follows:
- VPDMB:
- VPDMB fires
- jet pT > 5 GeV/c
- JP0:
- VPDMB does not fire and JP0 fires
- jet pT > 5 GeV/c
- jet matches to JP0 patch
- JP1:
- VPDMB does not fire, JP0 does not fire, and JP1 fires
- jet pT > 6 GeV/c
- jet matches to JP1 patch
- JP2:
- VPDMB does not fire, JP0 does not fire, JP1 does not fire, and JP2 fires
- jet pT > 8.4 GeV/c
- jet matches to JP2 patch
- AJP:
- VPDMB does not fire, JP0 does not fire, JP1 does not fire, JP2 does not fire, and AJP fires
- jet pT > 8.4 GeV/c
- jet matches to AJP patch
AJP is kept separate from JP2 for this purpose. This current trigger will not work for comparison to embedding, but allows a clean division between the triggers. The trigger sets are orthogonal, and each successively more restrictive trigger is a perfect subset of the immediately preceeding less restrictive trigger.
Figure 1: pT < 9.9 GeV/c
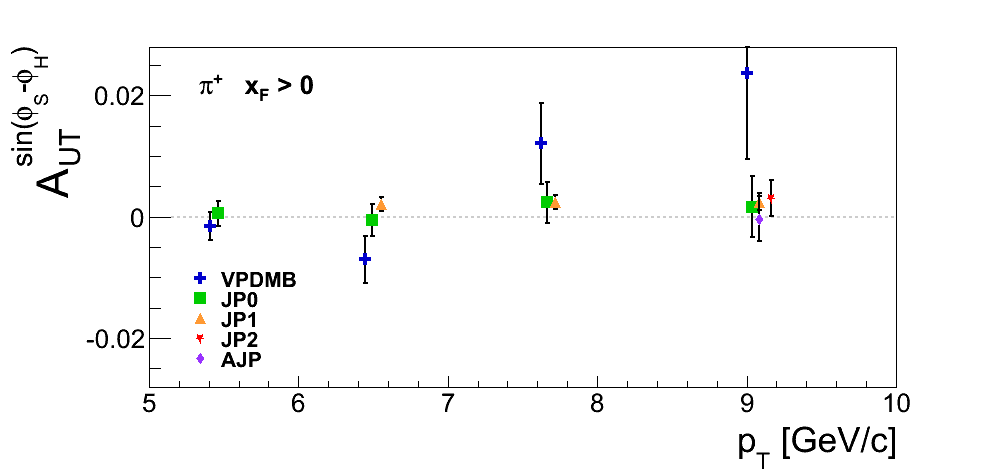
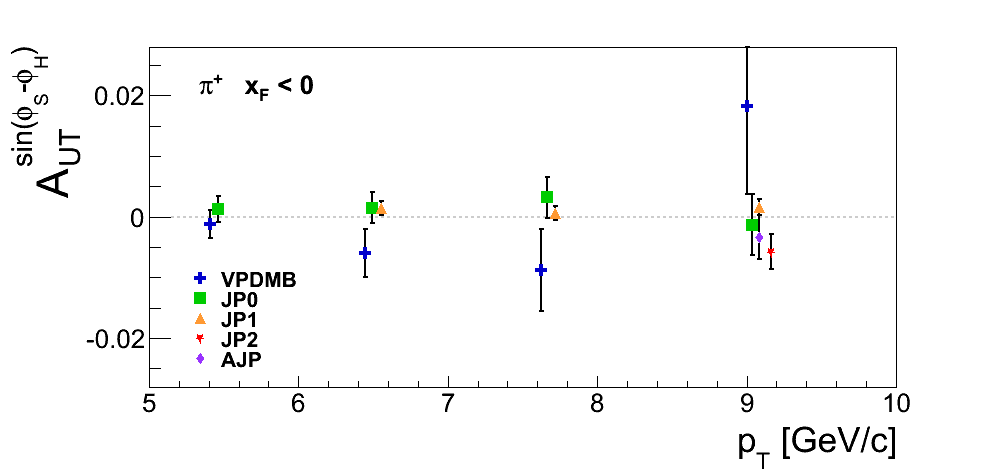
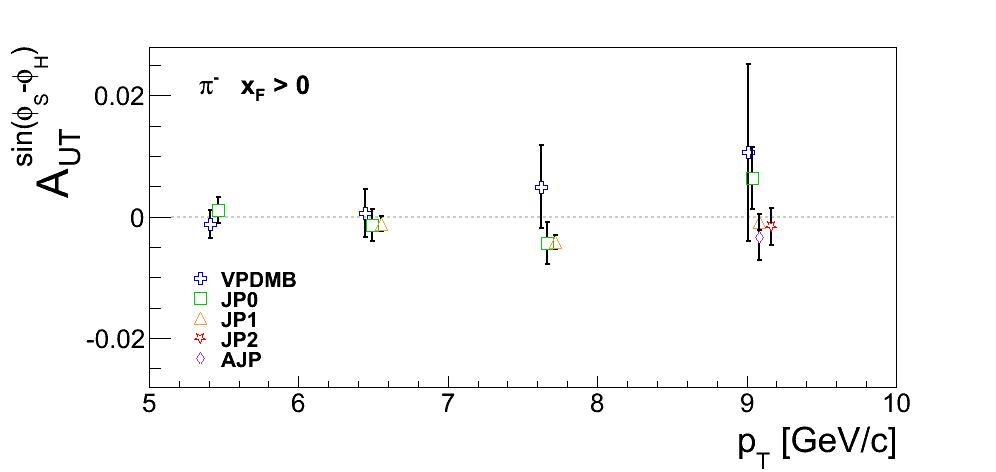
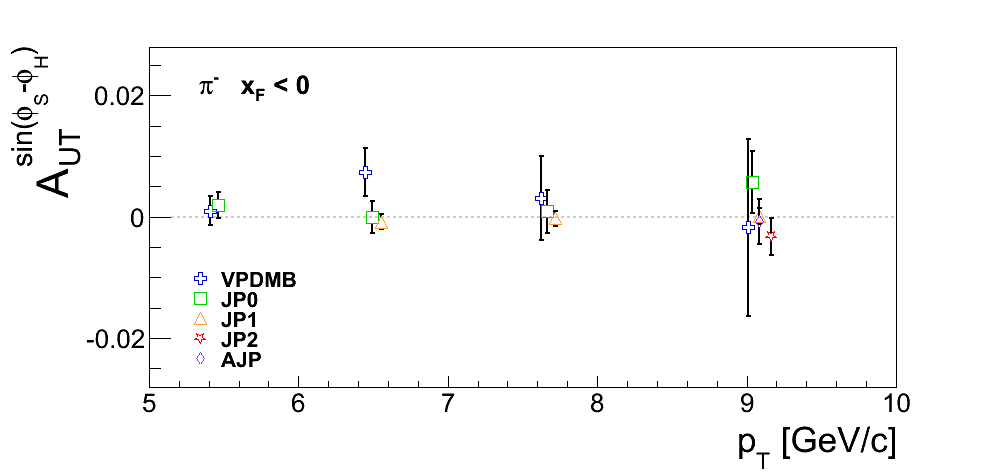
In Fig. 1 I plot a comparison of Collins asymmetries broken down into trigger contributions for low-pT jets. Off-hand, there does not appear to be a statistically significant difference between the various trigger contributions. That said, there could easily be 1σ fluctuations, in particular where VPDMB begins to run out of statistics. Note: the data points are plotted at the mean pT calculated within the bins. One immediately notes a shift higher as one goes from VPDMB to JP2.
Figure 2: Asymmetry Differences for pT < 9.9 GeV/c
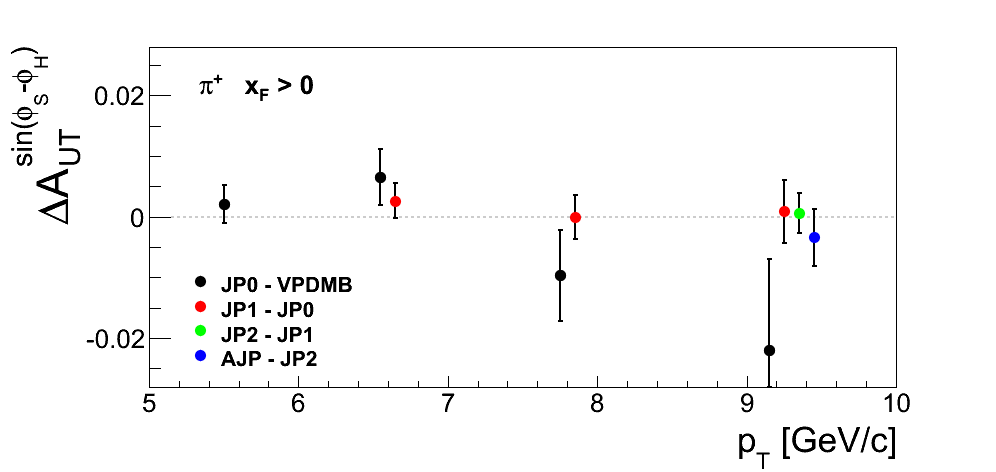
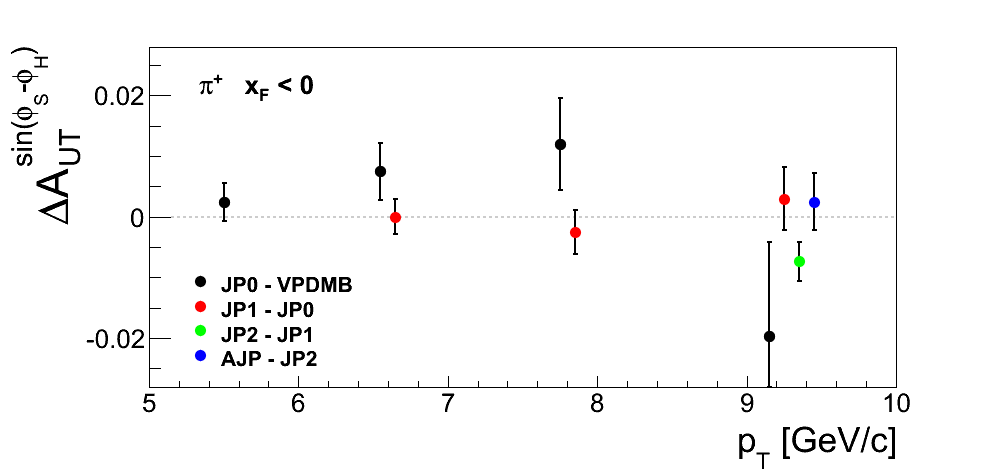
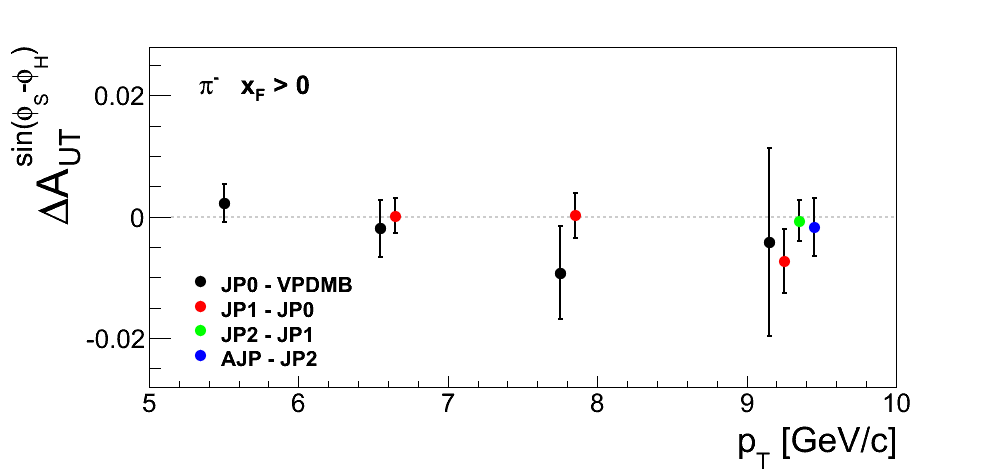
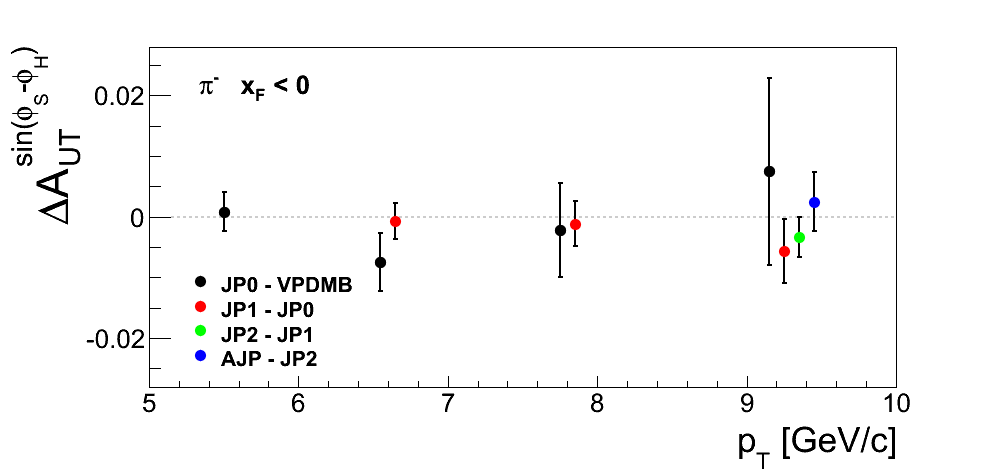
In Fig. 2 I plot the differences between successive triggers. There is no statistically significant difference between successive triggers, a sign that trigger bias is quite small in low-pT jets.
Figure 3: pT > 9.9 GeV/c
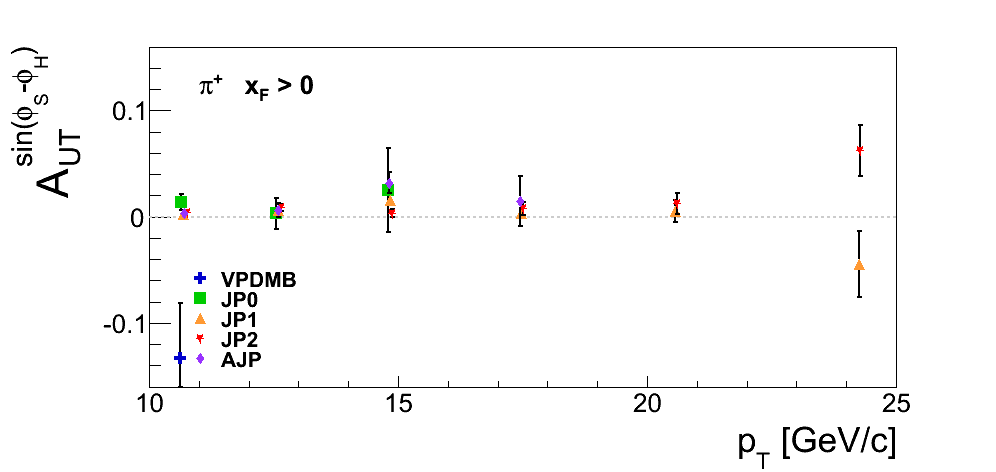
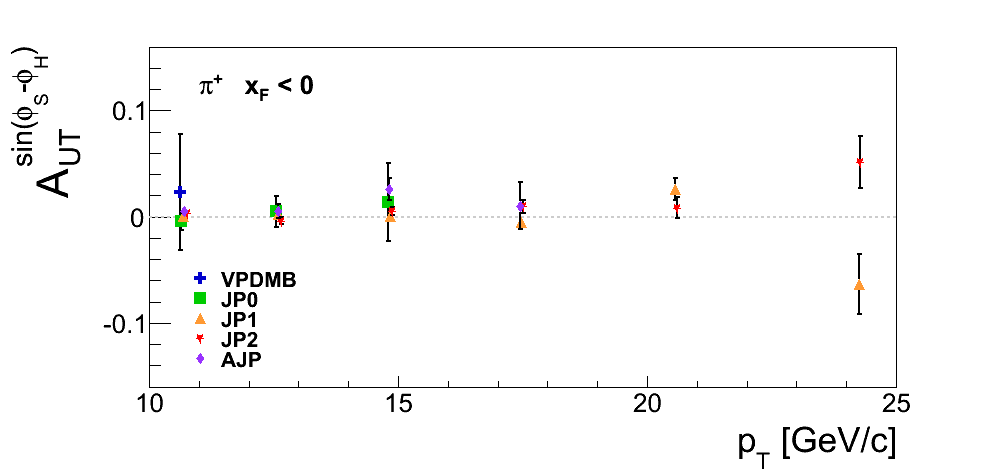
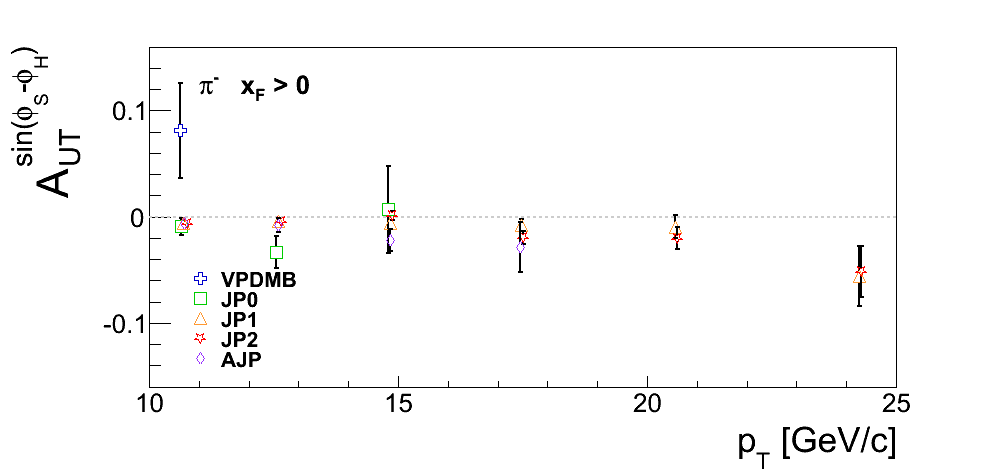
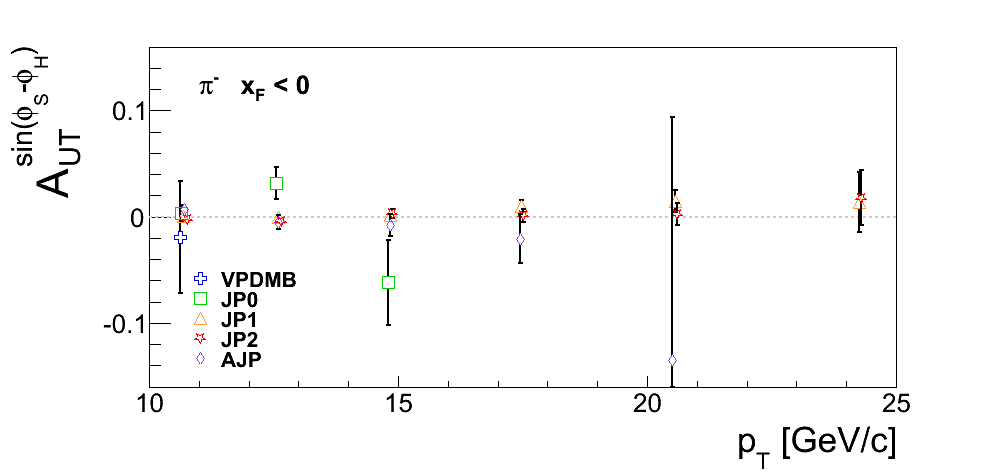
In Fig. 3 I plot the trigger comparison for high-pT jets. What VPDMB jets are present appear to be a goodly ways off of the JP-triggers, at least, in π+ with xF > 0. The veritical scale is expanded to accommodate the various triggers. However, there still appears to be no systematic shift to the various triggers. One also notes the mean pT within the bins appears more tightly grouped, although, some of this is undoubtedly due to the expanded horizontal scale.
Figure 4: Asymmetry Differences for pT > 9.9 GeV/c
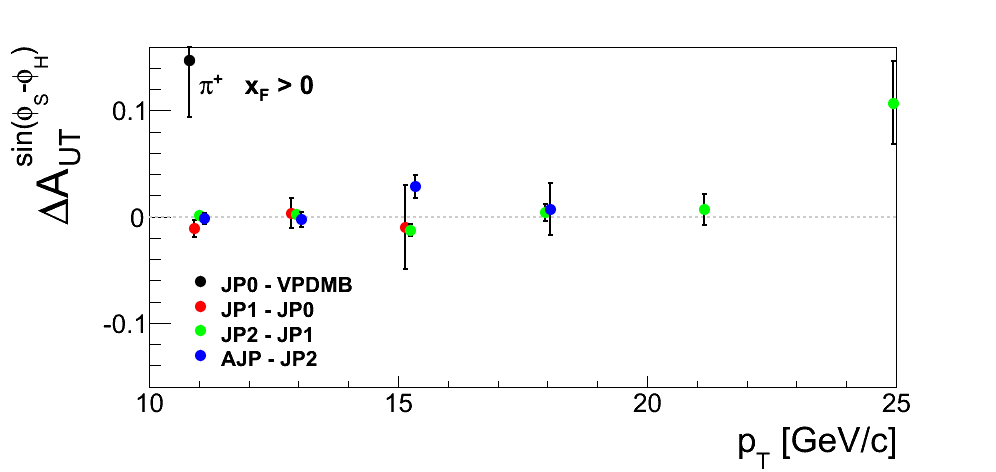
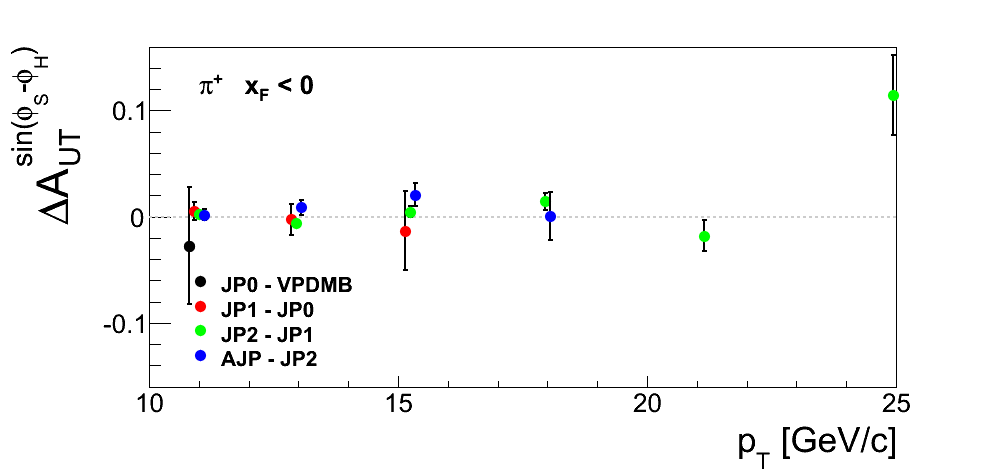
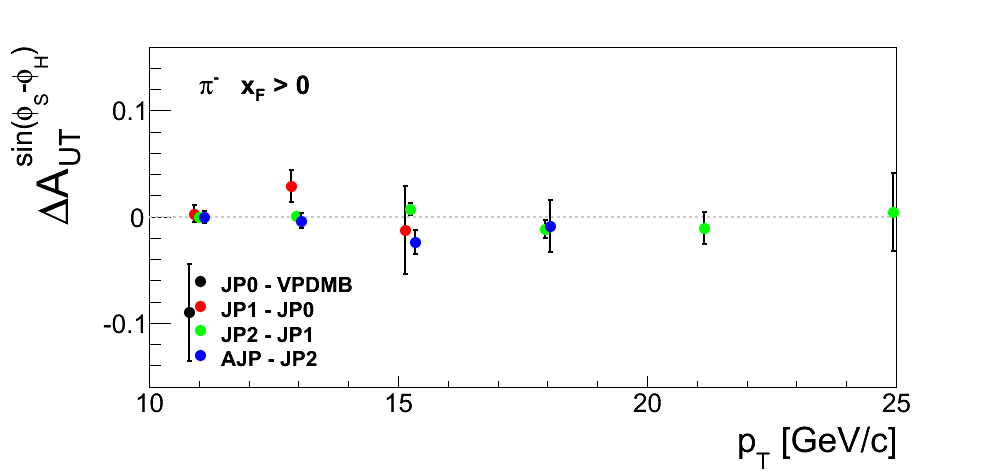
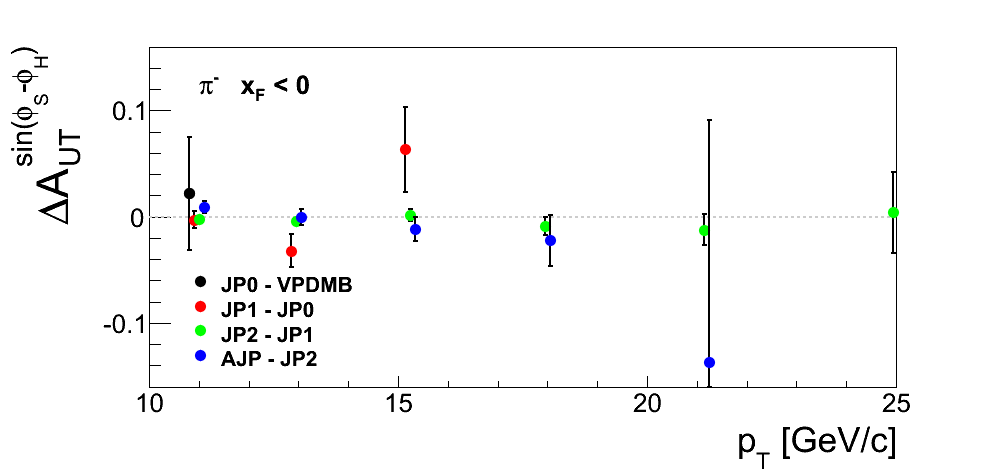
In Fig. 4 I plot the asymmetry difference for successive triggers at high-pT. Here, one may hope to be sufficiently above trigger turn-ons such that trigger bias is fairly limited. Indeed, there appears to be no difference between JP2 and JP1 (save, perhaps, in the highest bin for both xF states of π+). VPDMB also exhibits some odd behavior in the lowest pT bin for π+.
Figure 5
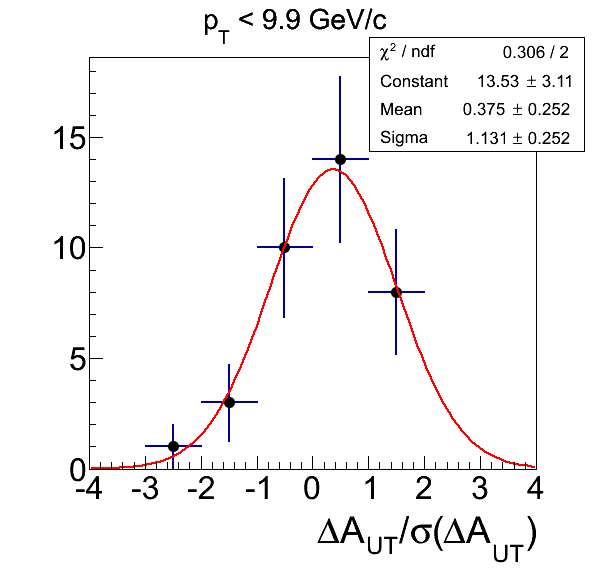
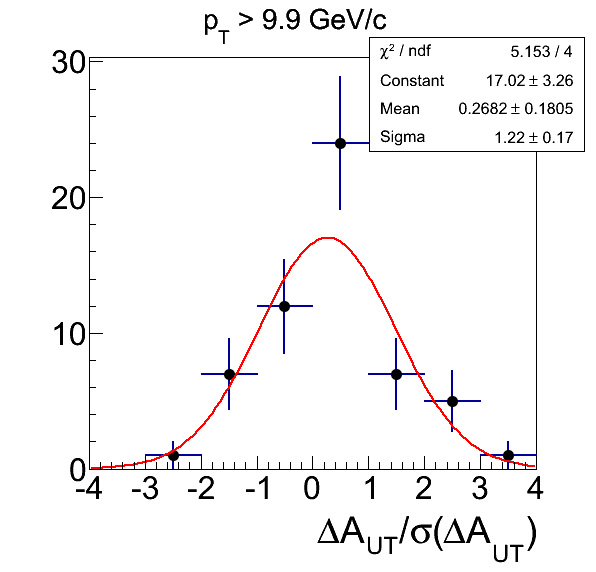
Anselm has suggested a way to quantify the trigger offset is to examine the distribution of asymmetry differences divided by the uncertainties. This seems analogous to the residulas of a null fit. While I'm not entirely sure that this properly handles the correlations, it seems a reasonable test. In Fig. 5, I post the distribution of the "residuals" for low-pT and high-pT. Since the trigger bias is expected to give us asymmetries of larger magnitude but opposite charge-sign as we move to more restrictive triggers, I have scaled the π- asymmetry differences by -1 before filling the histograms. So, one might expect the trigger bias to give us "residuals" with positive means. The Gaussian fits seem reasonable, though, the statistics are low enough that there are not many degrees of freedom. The means and widths are reasonably consistent with zero and unity, respectively, with, perhaps, small bias toward positive means. This seems to argue that the effect of trigger bias is quite minimal.
Slopes
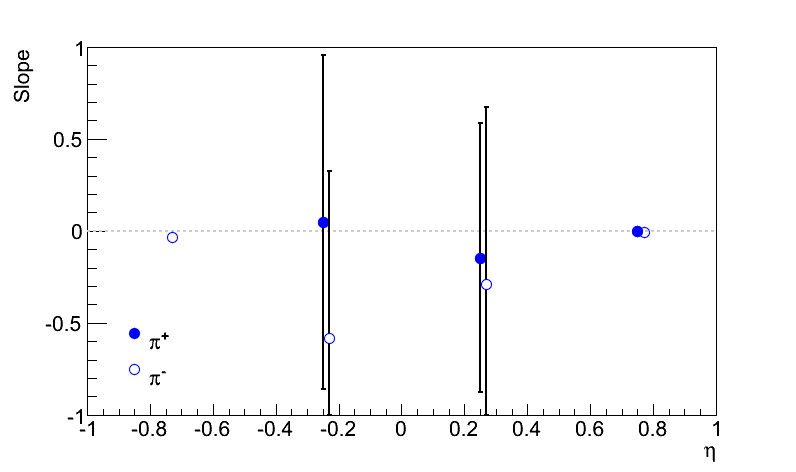
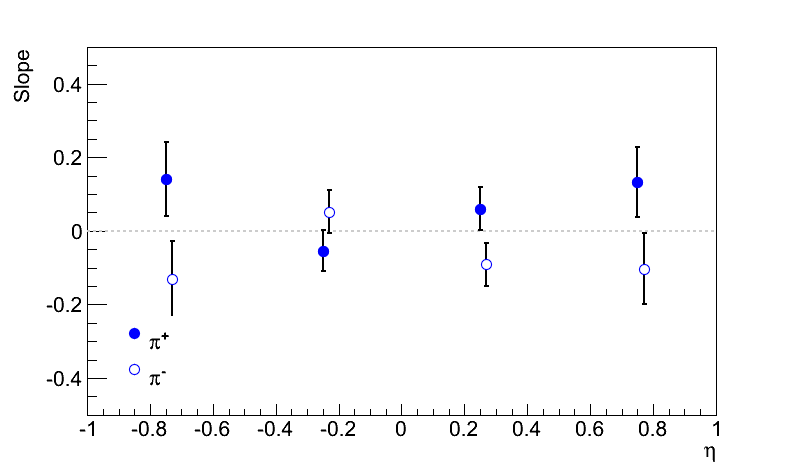
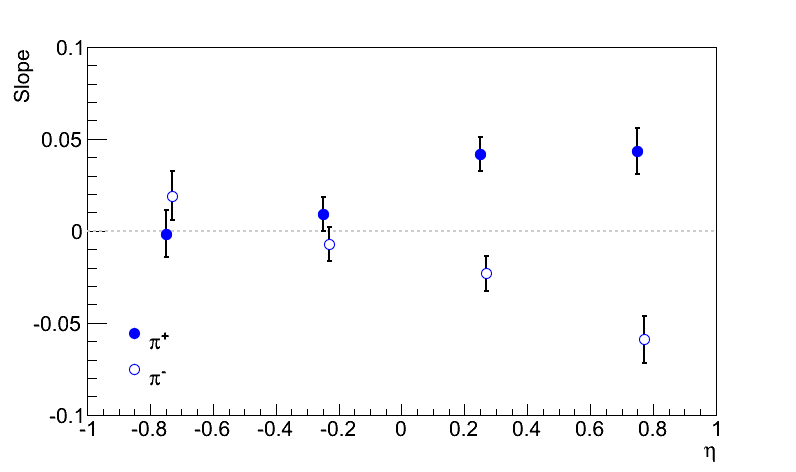
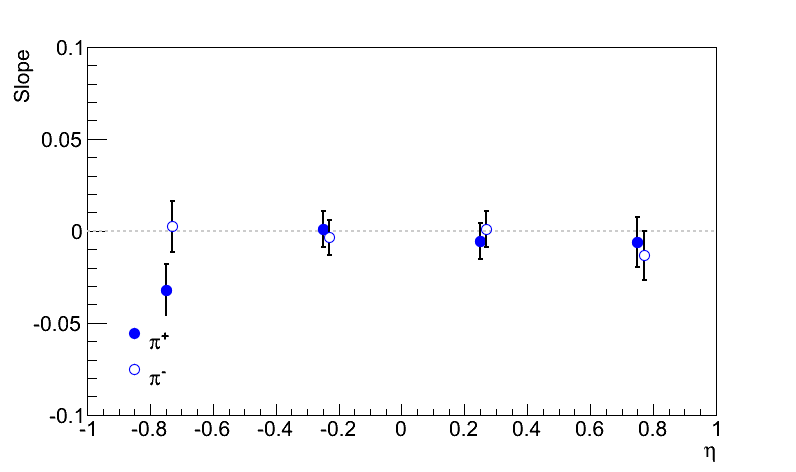
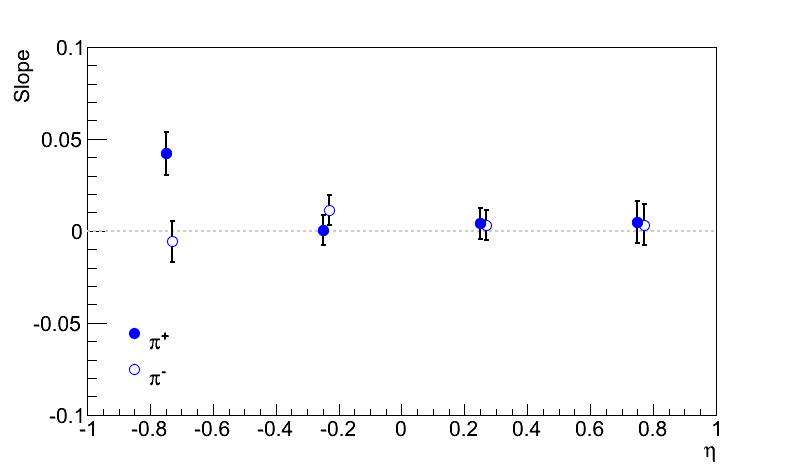
The slope study was done prior to the pT study and implements the normal trigger definitions rather than the modified definitions as described above.
Figure 6: pT > 9.9 GeV/c
| VPDMB | JP0 |
 |
 |
| JP1 | JP2 |
 |
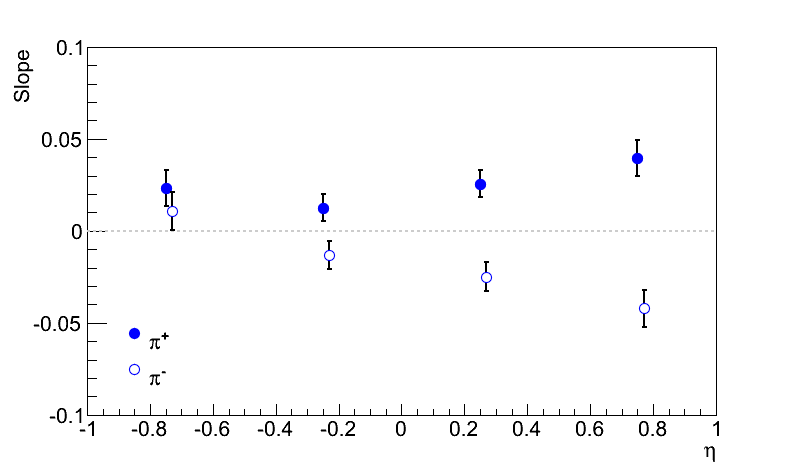 |
For the high-pT jets, VPDMB and JP0 do not significantly contribute (note the vertical axis scale). For JP1 and JP2, the asymmetries are quite similar.
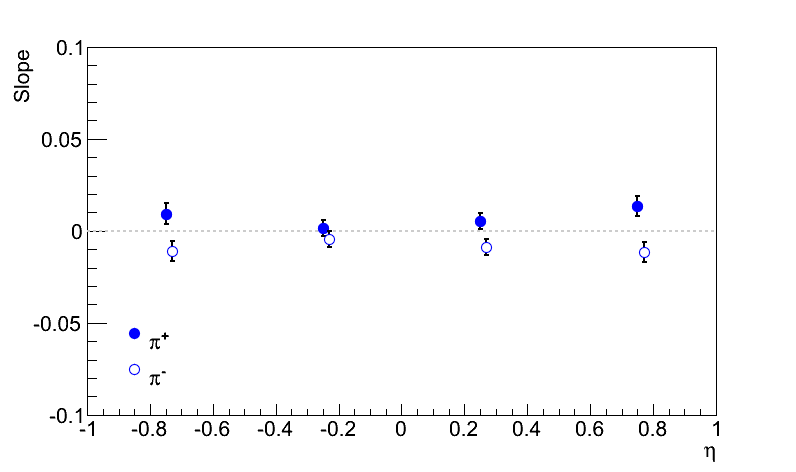
Figure 7: pT < 9.9 GeV/c
| VPDMB | JP0 |
 |
 |
| JP1 | JP2 |
 |
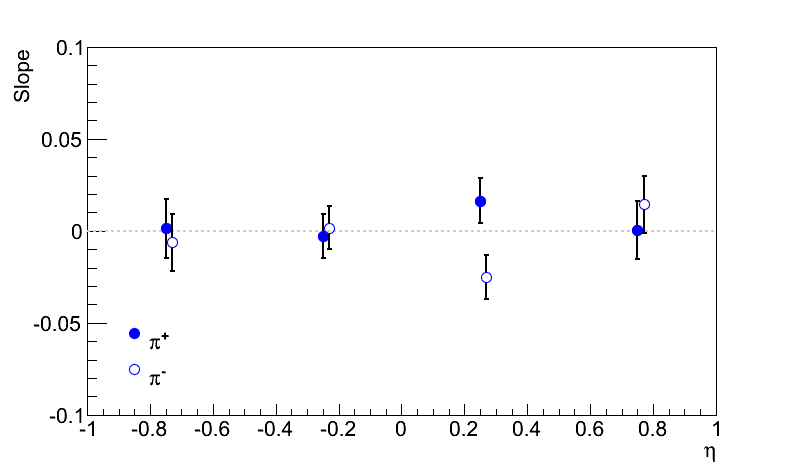 |
For low-pT jets, all triggers contribute a more meaningful way than, say, VPDMB or JP0 in high-pT jets. However, JP1 dominates the statistics, and it is only there where one is able to decipher a strong signal.
Asymmetries
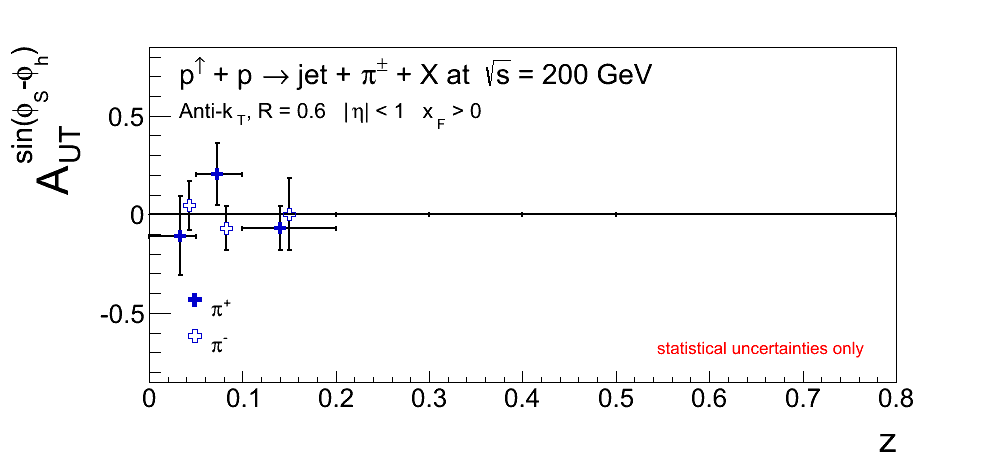
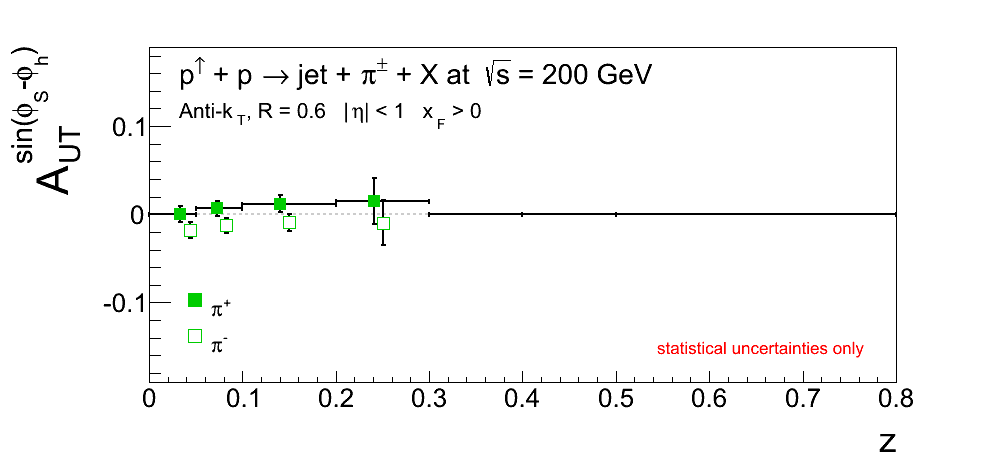
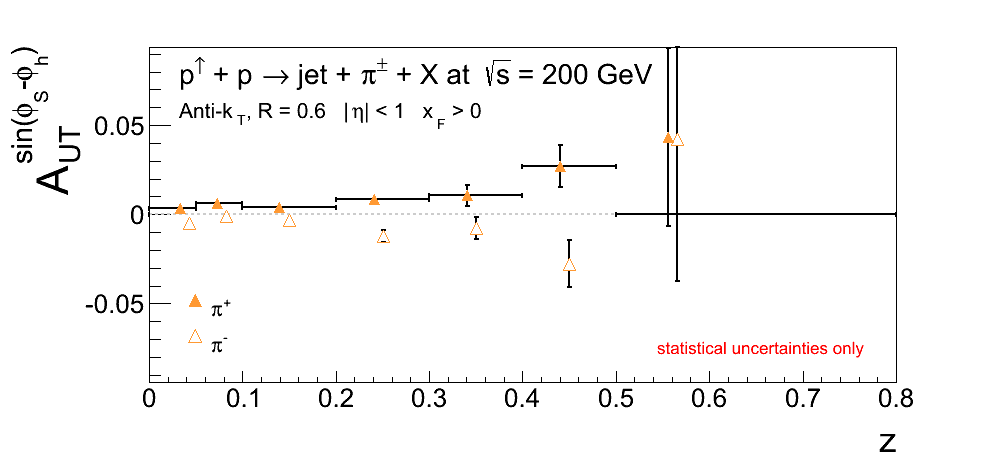
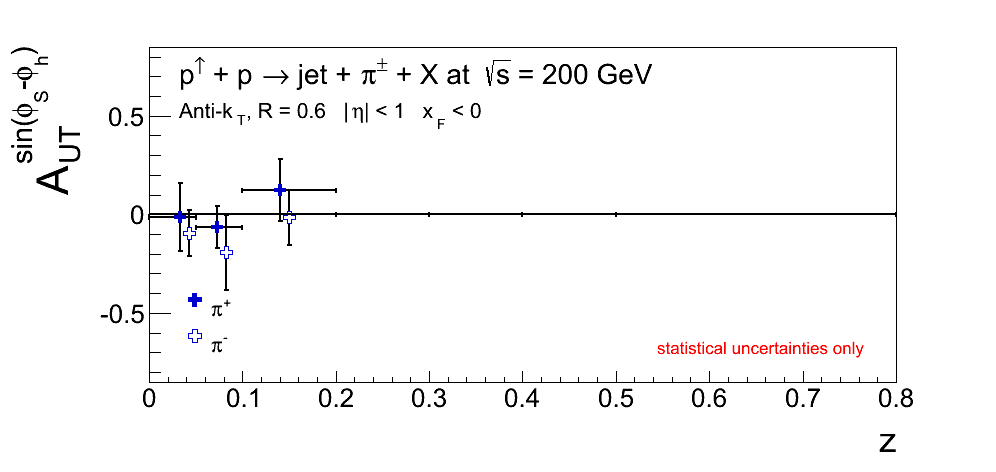
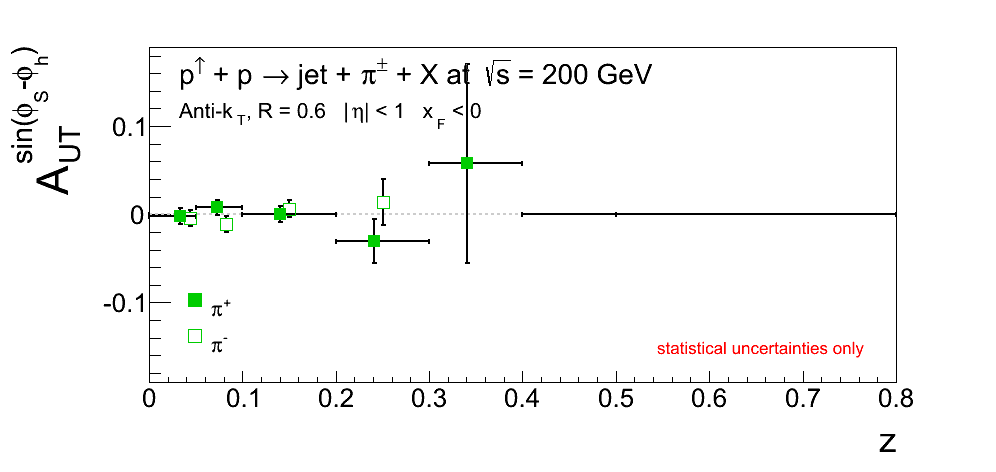
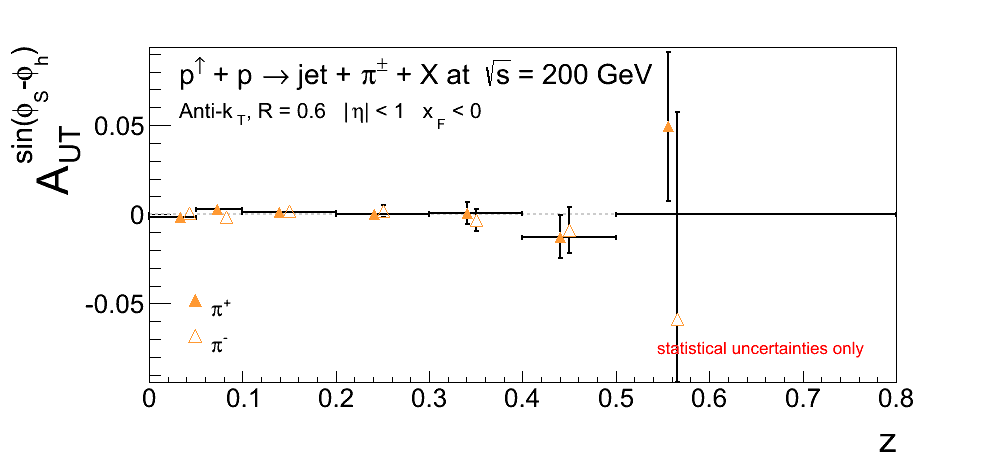
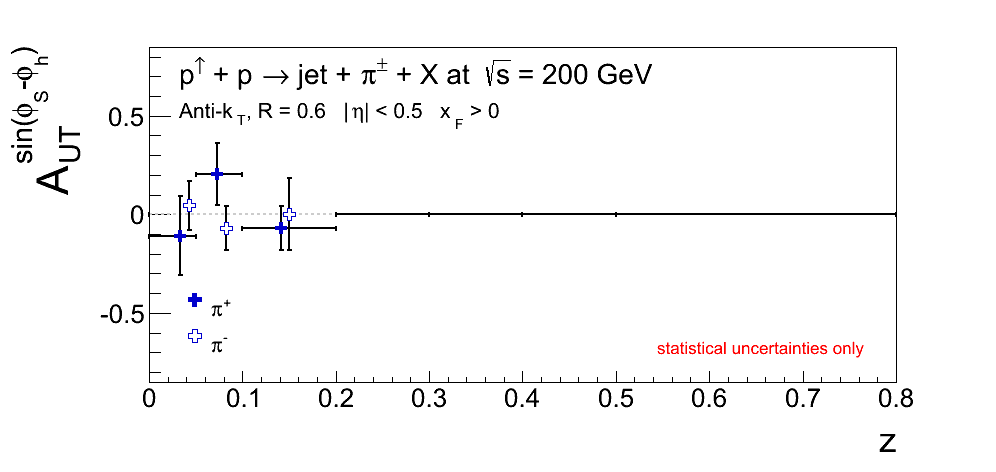
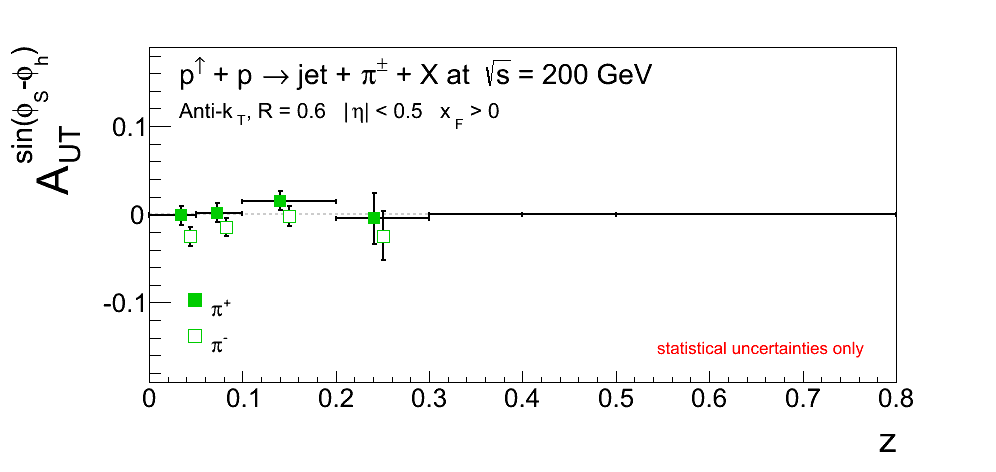
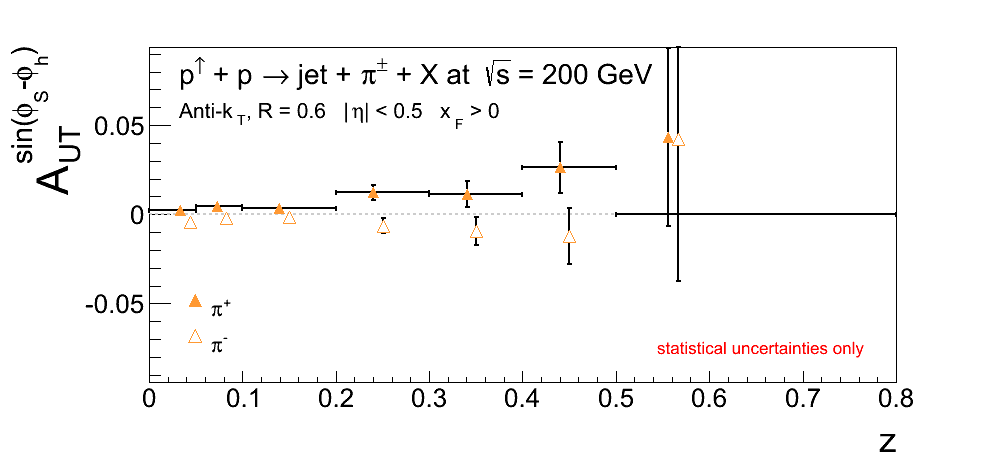
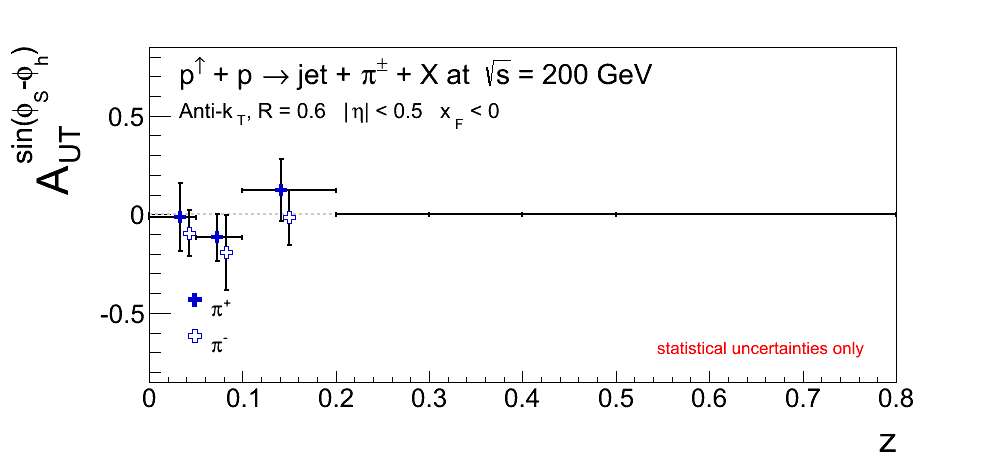
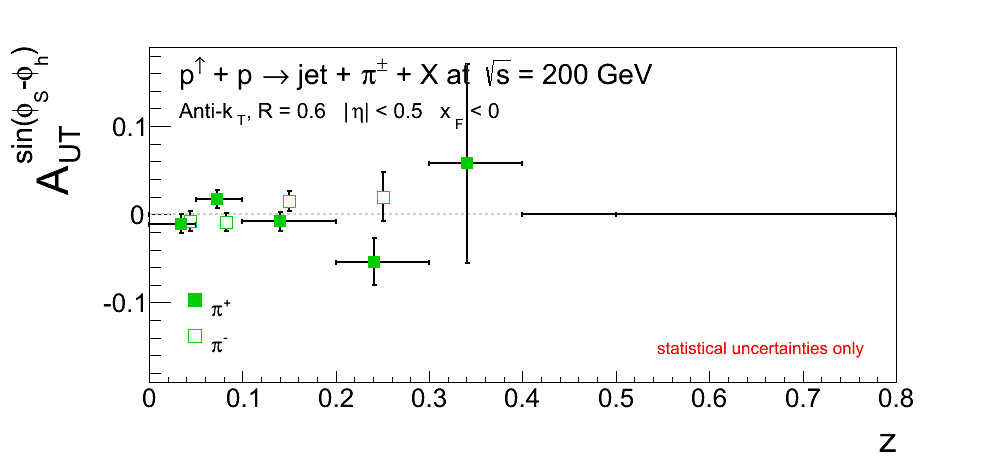
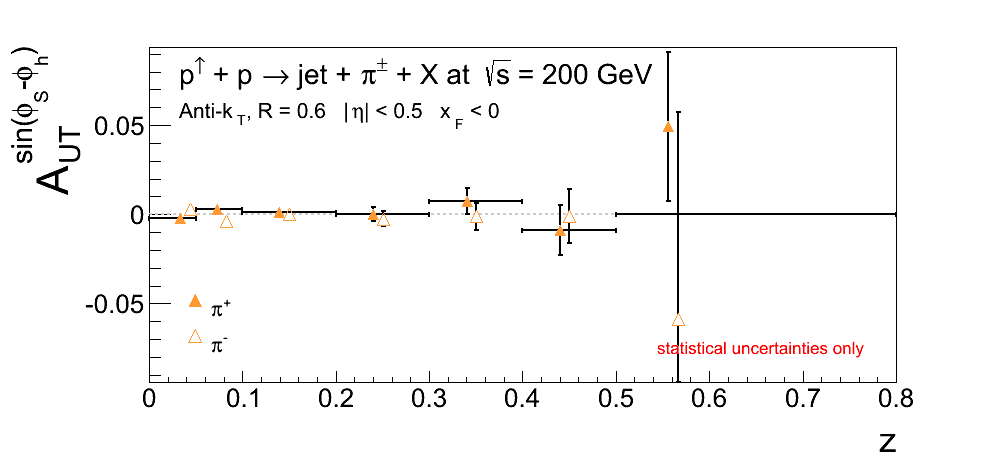
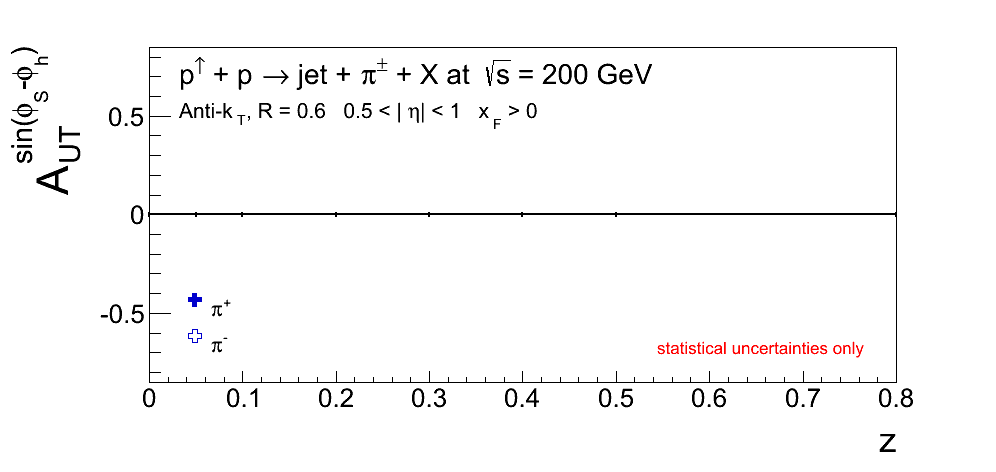
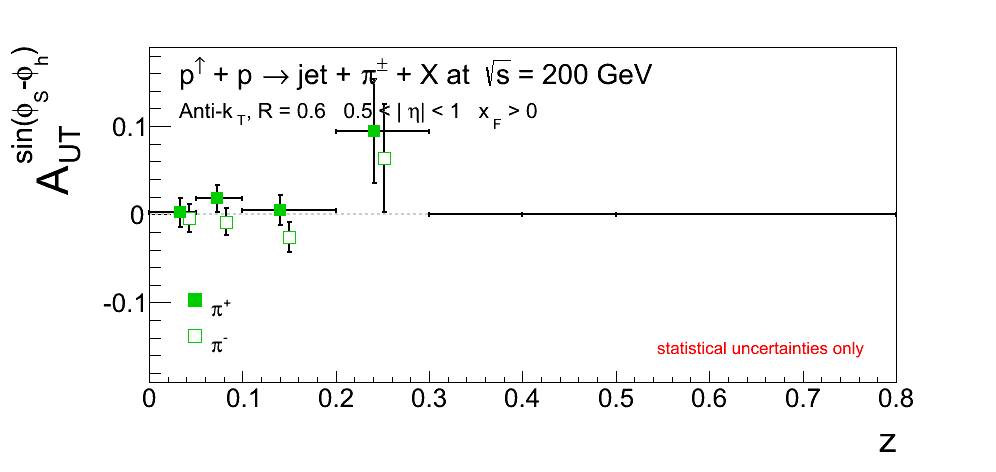
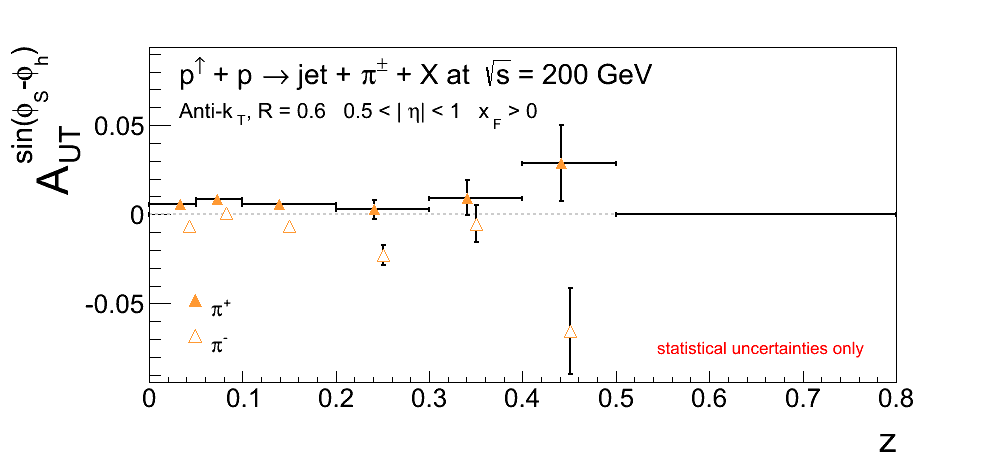
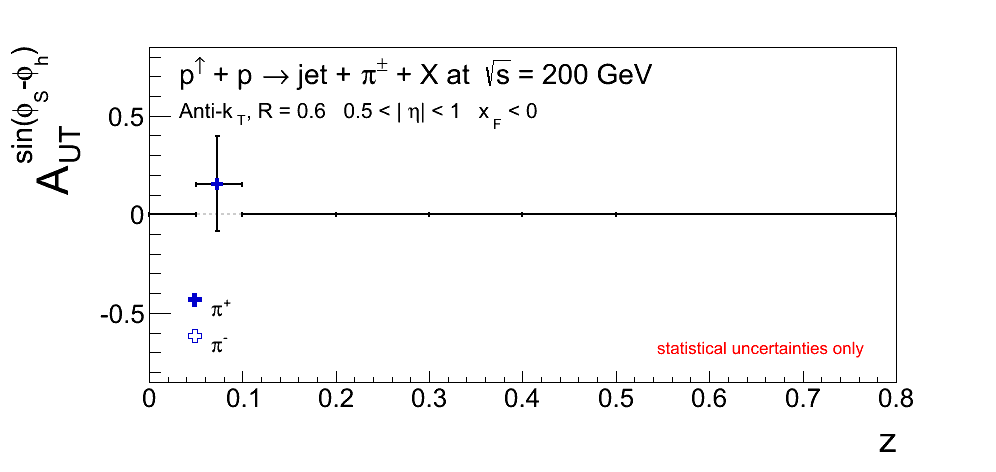
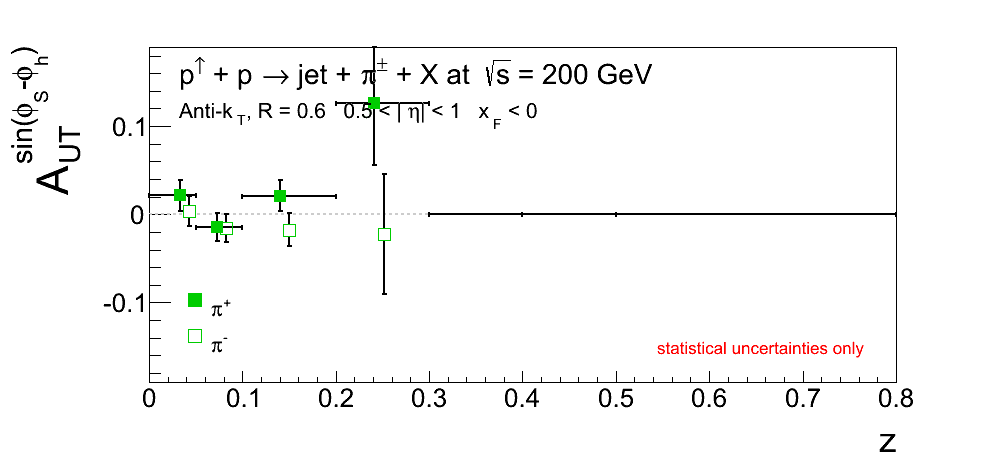
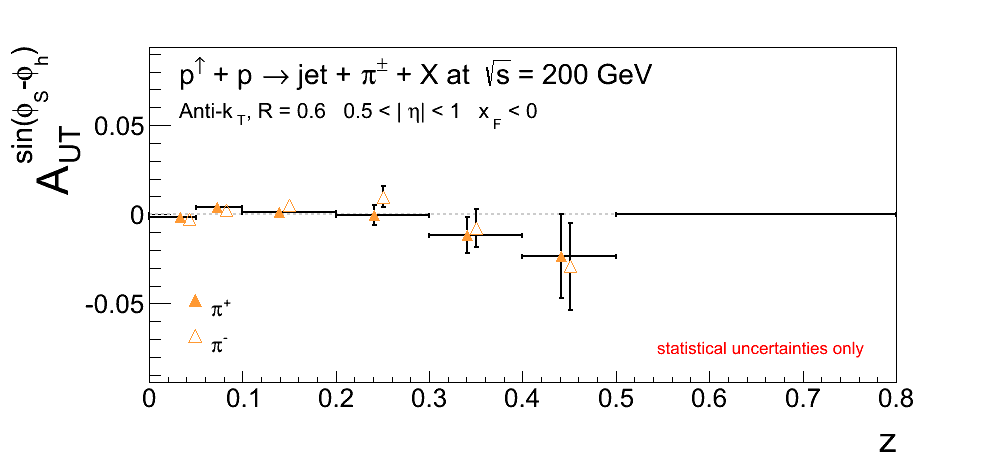
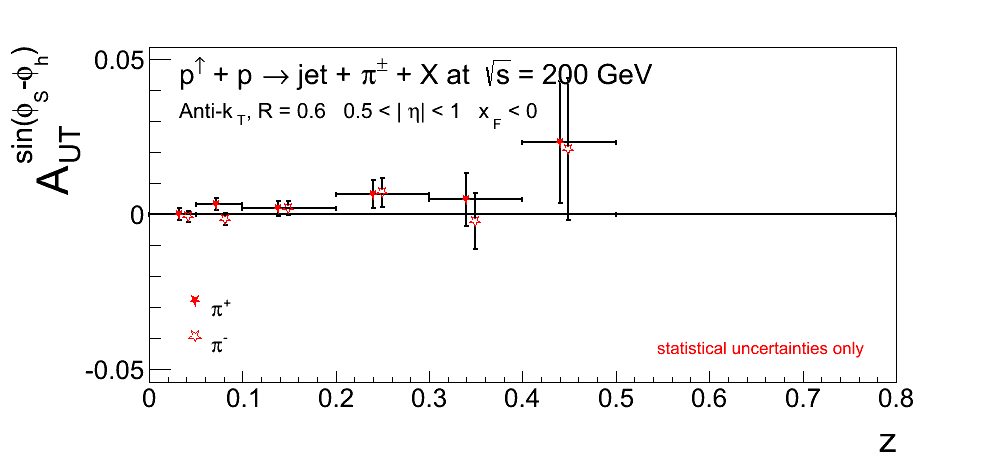
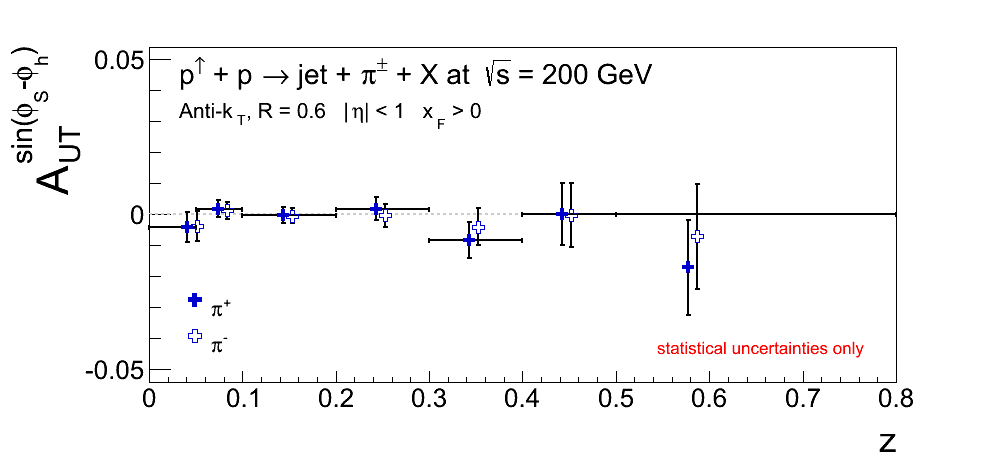
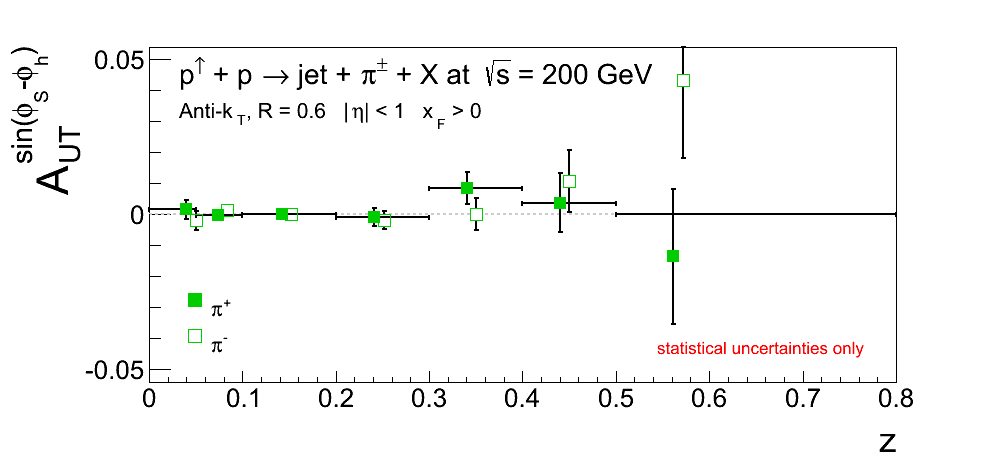
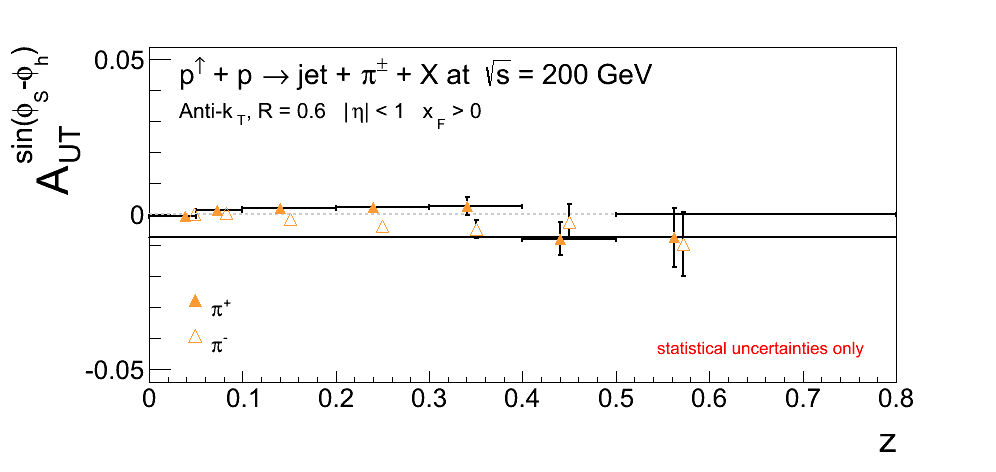
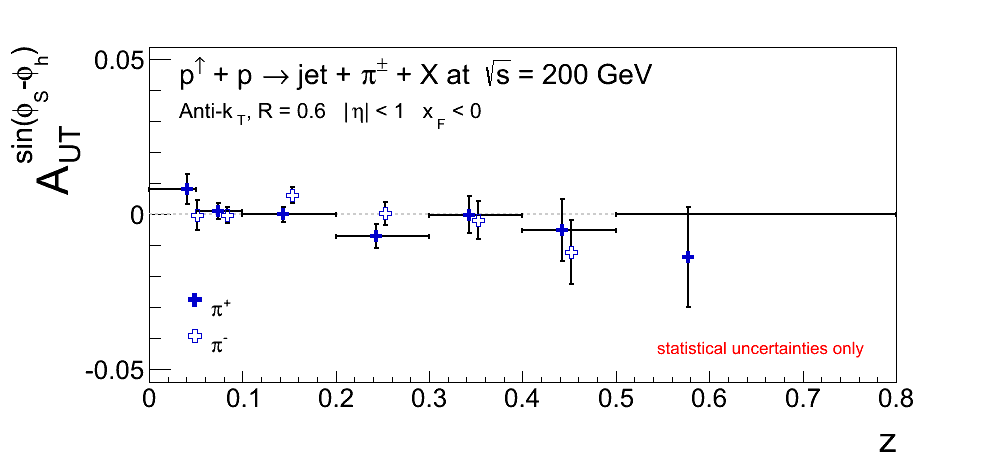
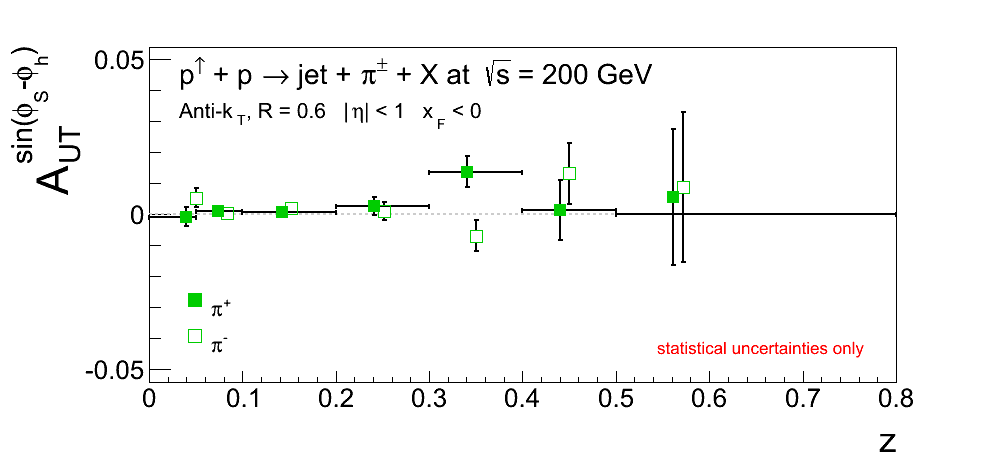
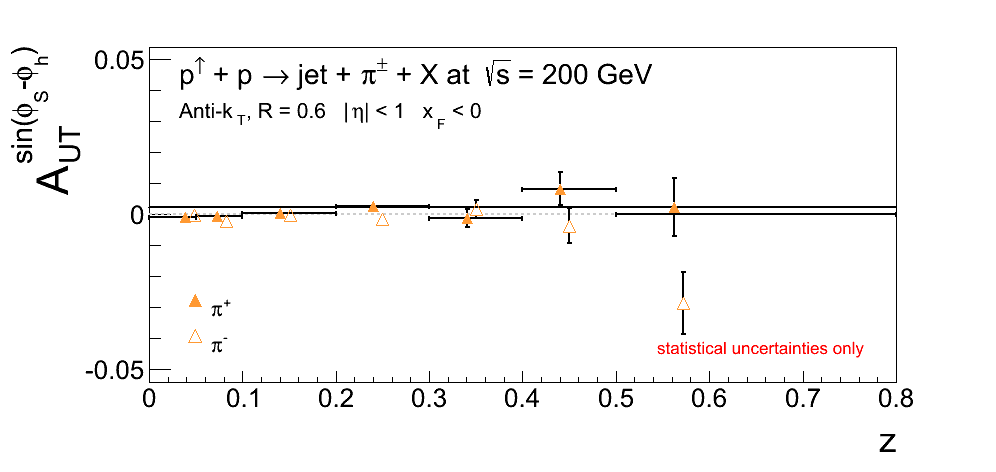
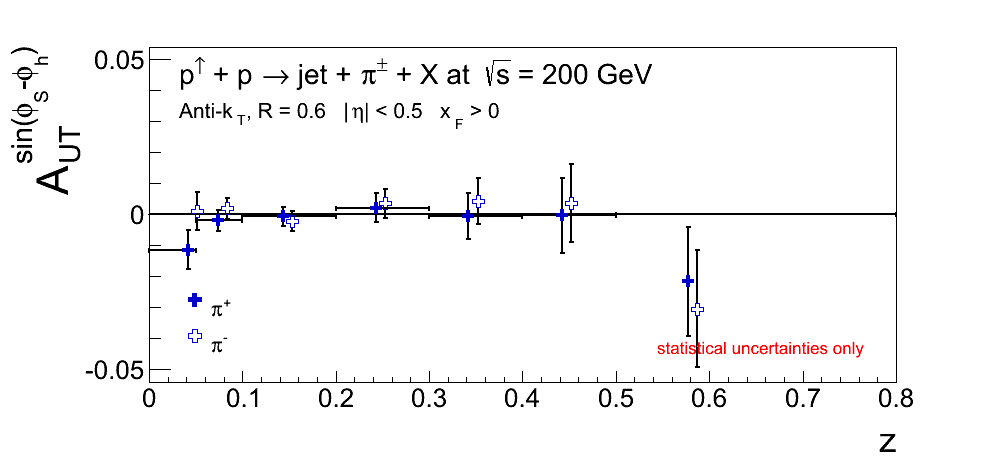
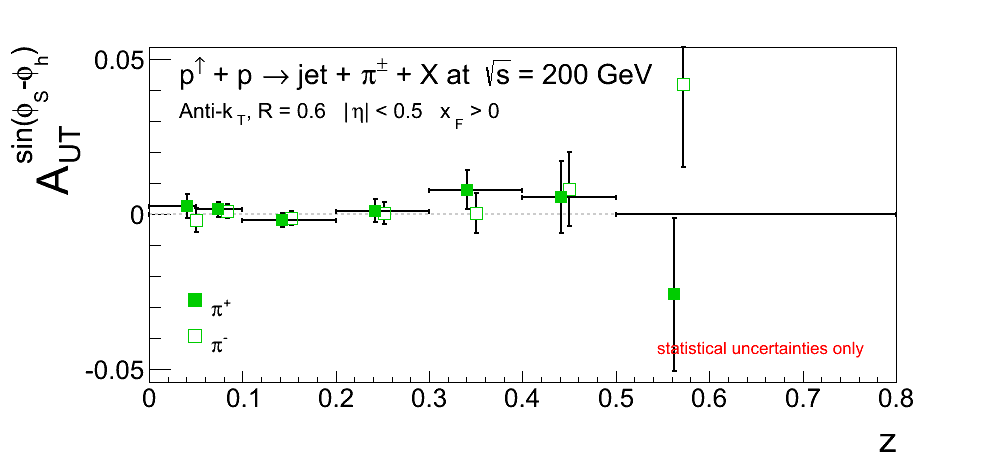
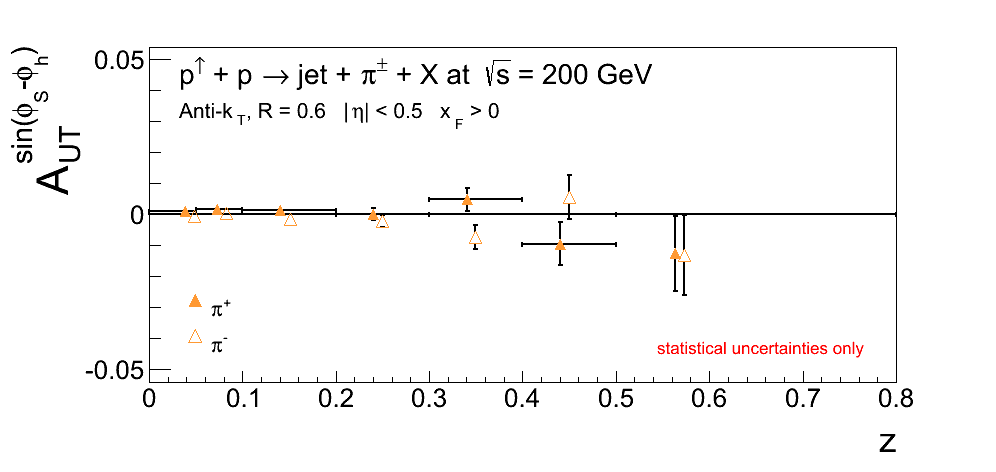
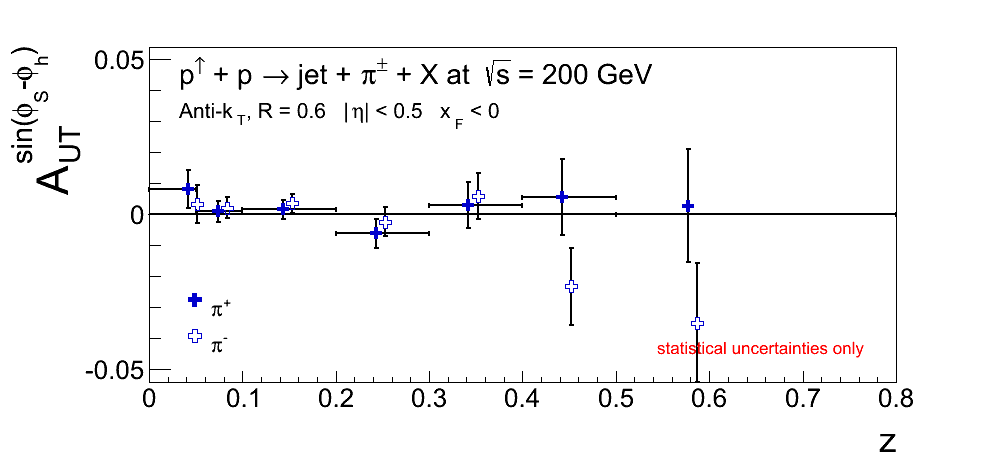
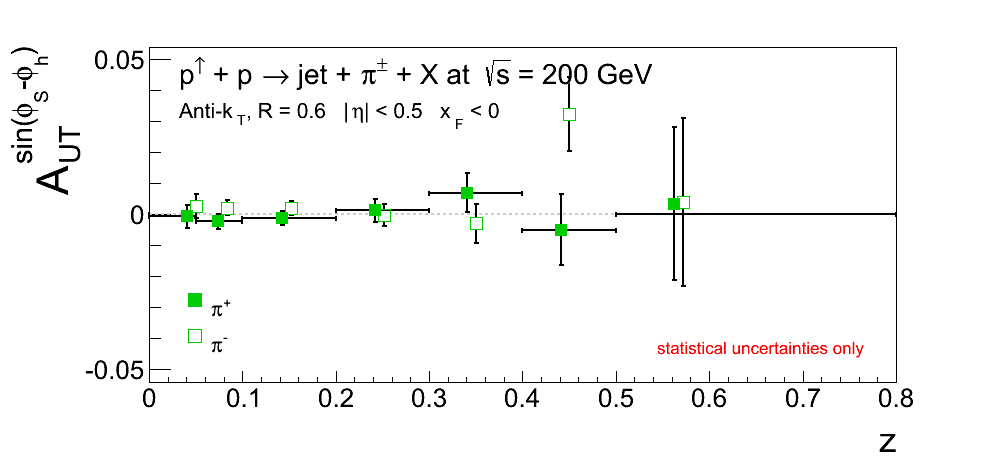
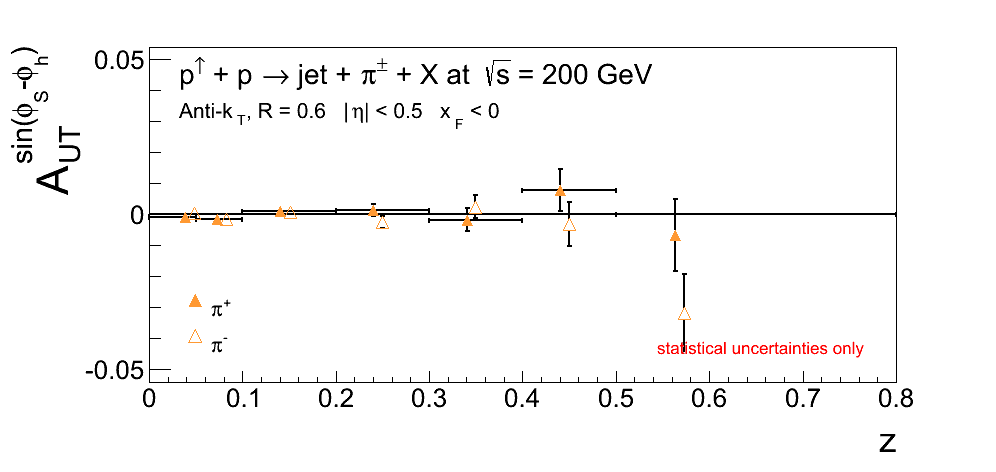
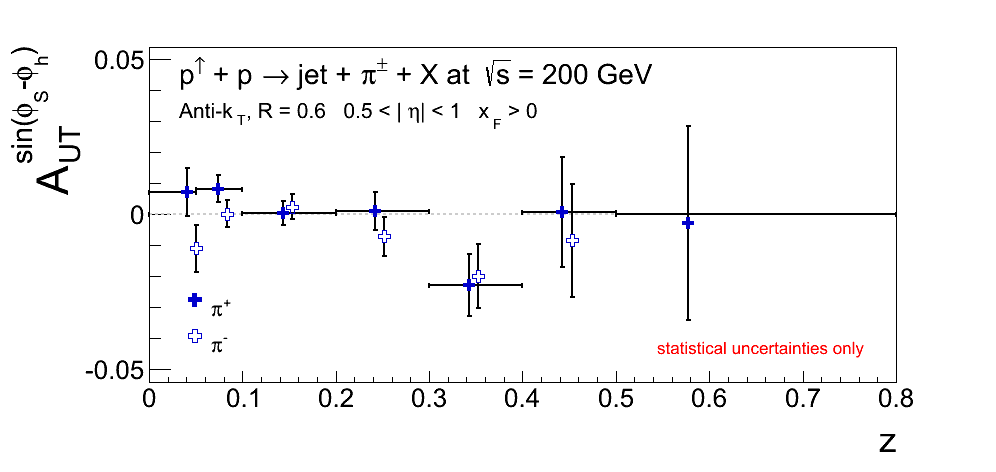
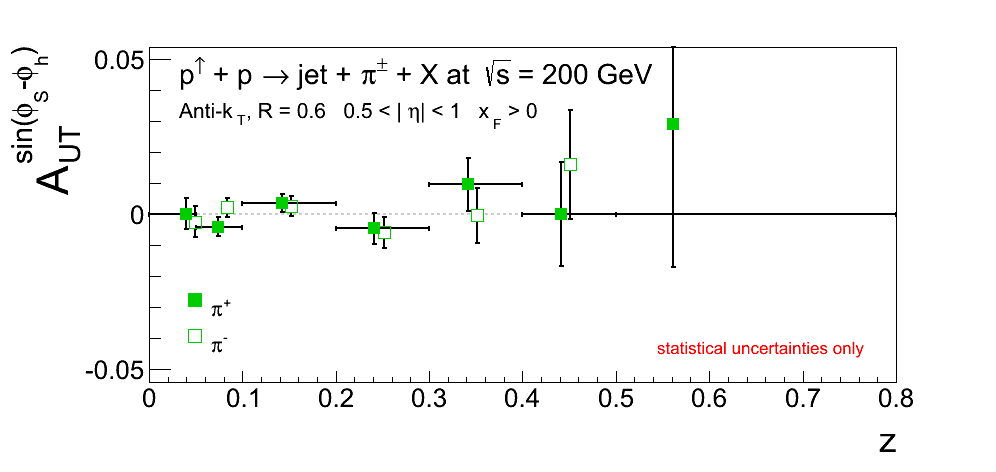
Below, I post the plots of the asymmetries as a function of z, broken up trigger-by-trigger.
pT > 9.9 GeV/c
Figure 8: xF > 0 and |η| < 1
| VPDMB | JP0 |
 |
 |
| JP1 | JP2 |
 |
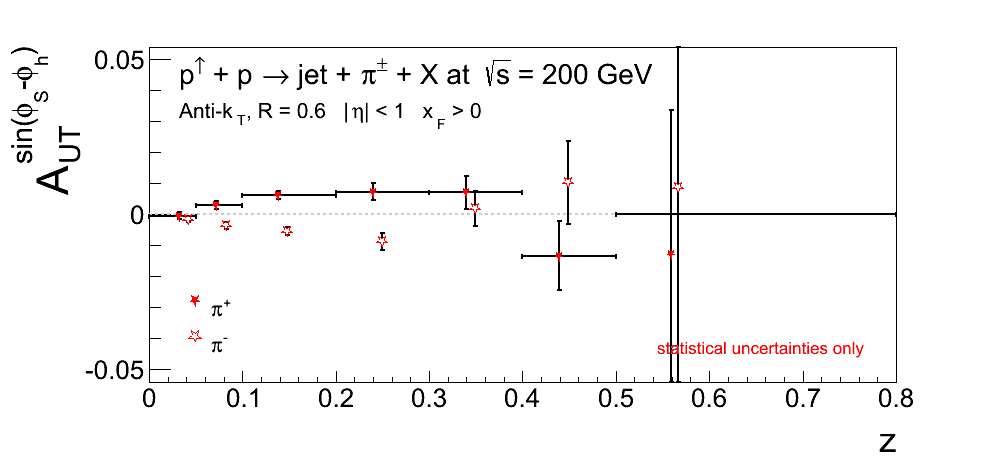 |
Figure 9: xF < 0 and |η| < 1
| VPDMB | JP0 |
 |
 |
| JP1 | JP2 |
 |
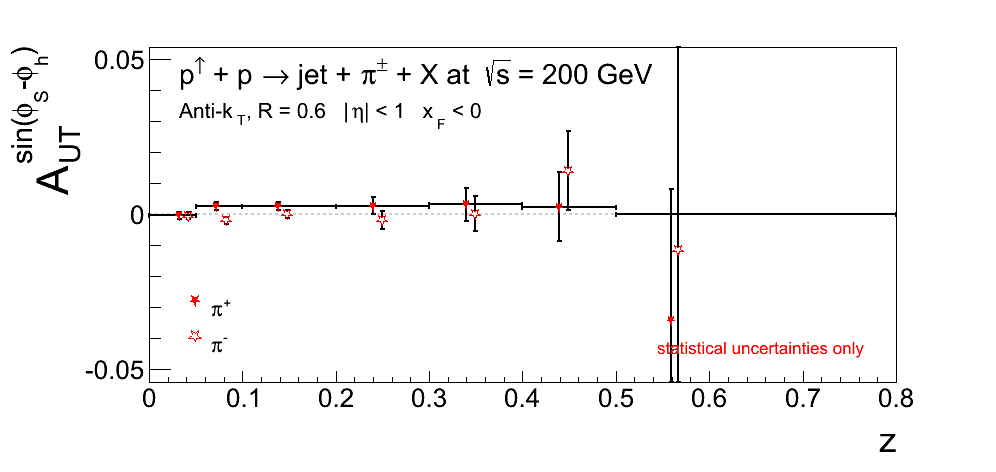 |
Figure 10: xF > 0 and |η| < 0.5
| VPDMB | JP0 |
 |
 |
| JP1 | JP2 |
 |
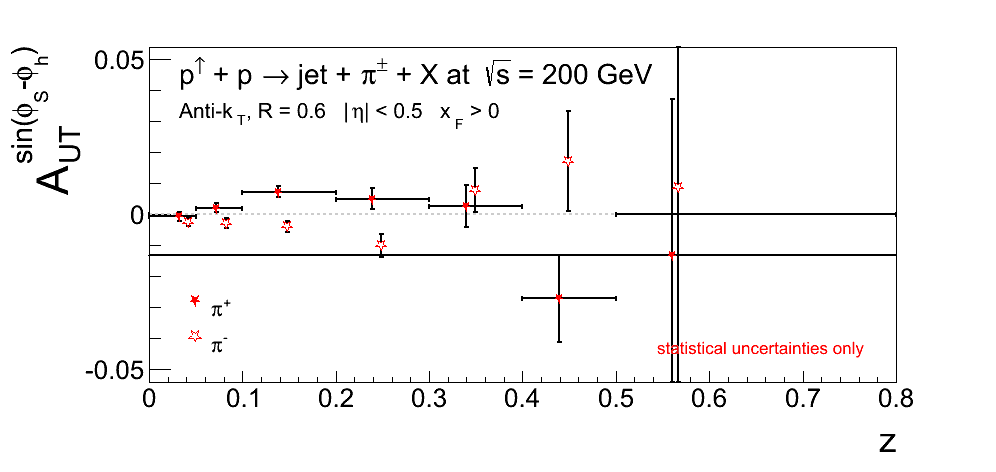 |
Figure 11: xF < 0 and |η| < 0.5
| VPDMB | JP0 |
 |
 |
| JP1 | JP2 |
 |
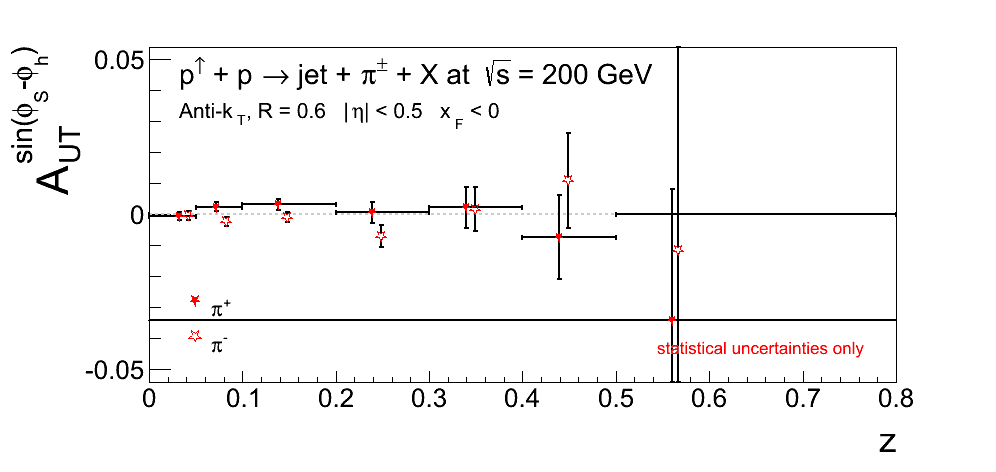 |
Figure 12: xF > 0 and 0.5 < |η| < 1
| VPDMB | JP0 |
 |
 |
| JP1 | JP2 |
 |
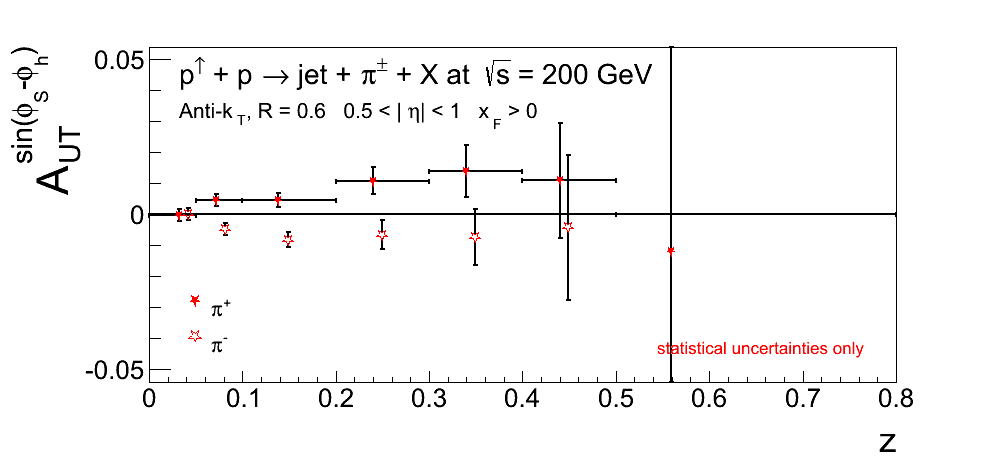 |
Figure 13: xF < 0 and 0.5 < |η| < 1
| VPDMB | JP0 |
 |
 |
| JP1 | JP2 |
 |
 |
pT < 9.9 GeV/c
Figure 14: xF > 0 and |η| < 1
| VPDMB | JP0 |
 |
 |
| JP1 | JP2 |
 |
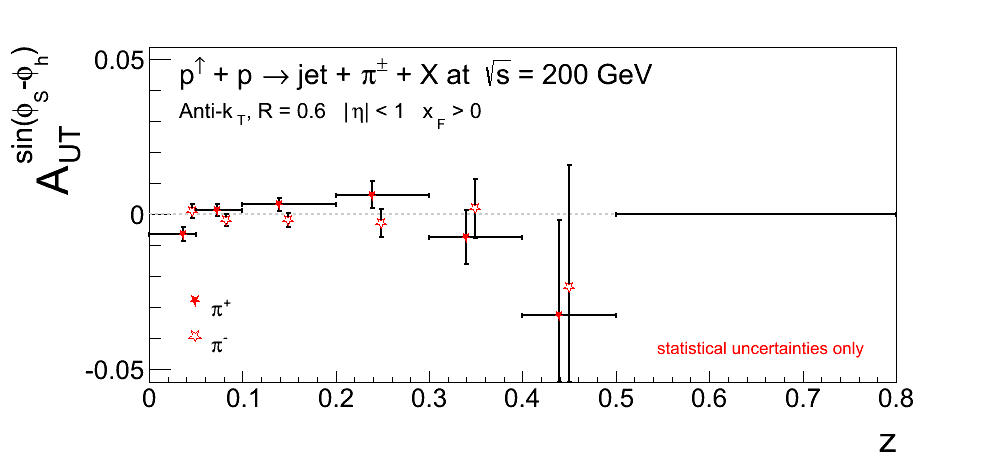 |
Figure 15: xF < 0 and |η| < 1
| VPDMB | JP0 |
 |
 |
| JP1 | JP2 |
 |
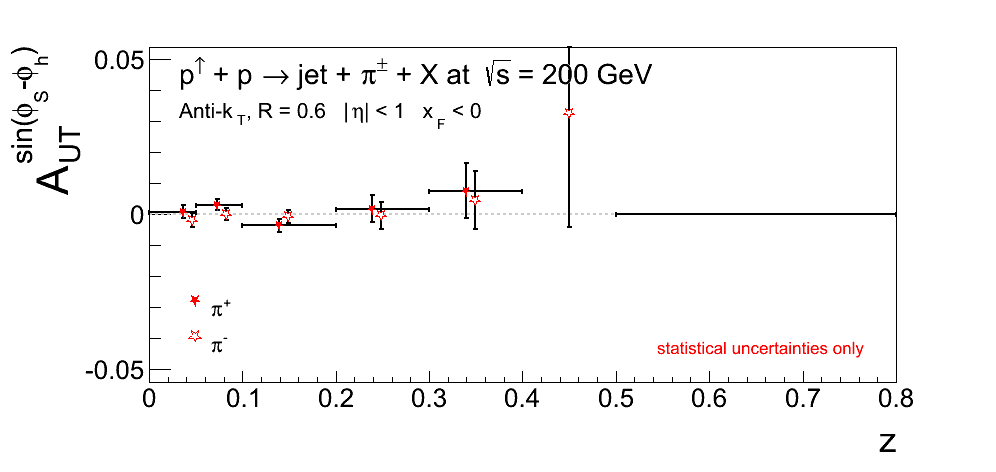 |
Figure 16: xF > 0 and |η| < 0.5
| VPDMB | JP0 |
 |
 |
| JP1 | JP2 |
 |
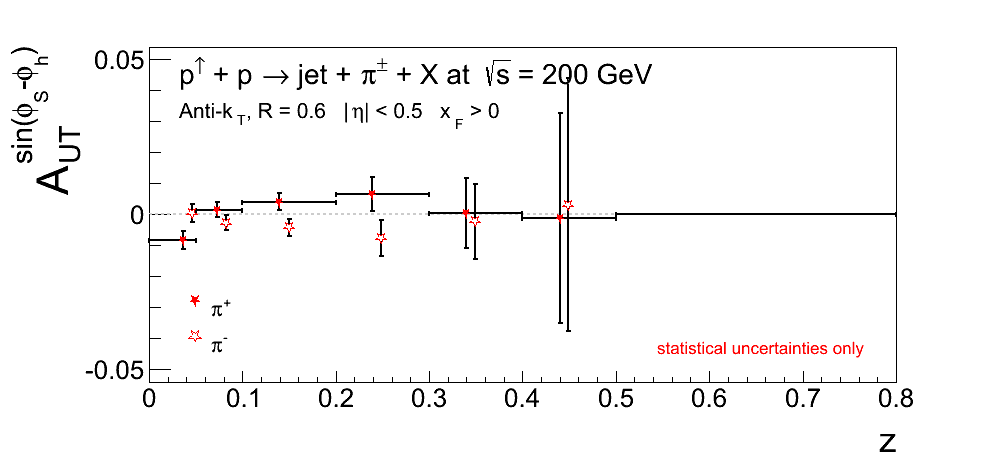 |
Figure 17: xF < 0 and |η| < 0.5
| VPDMB | JP0 |
 |
 |
| JP1 | JP2 |
 |
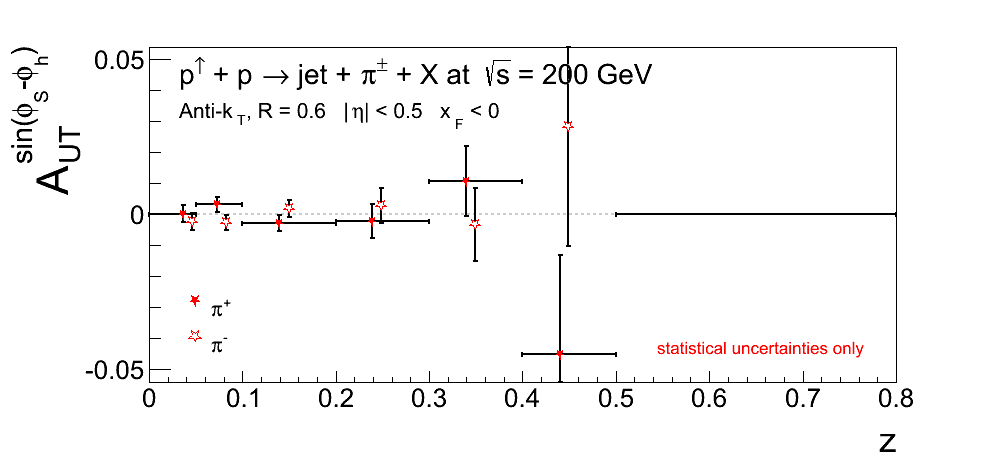 |
Figure 18: xF > 0 and 0.5 < |η| < 1
| VPDMB | JP0 |
 |
 |
| JP1 | JP2 |
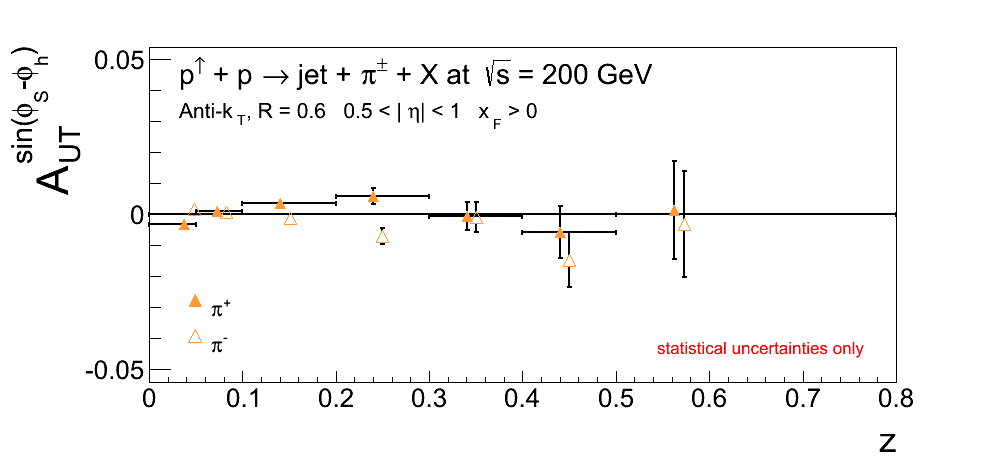 |
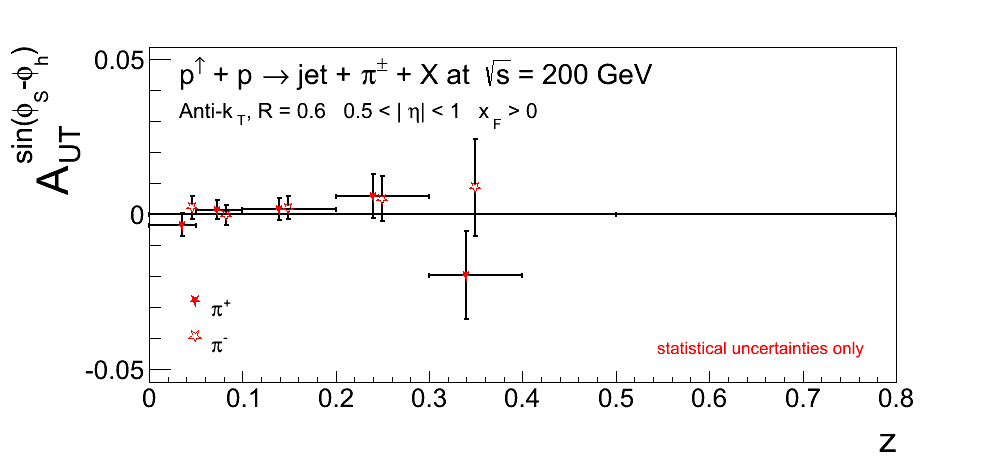 |
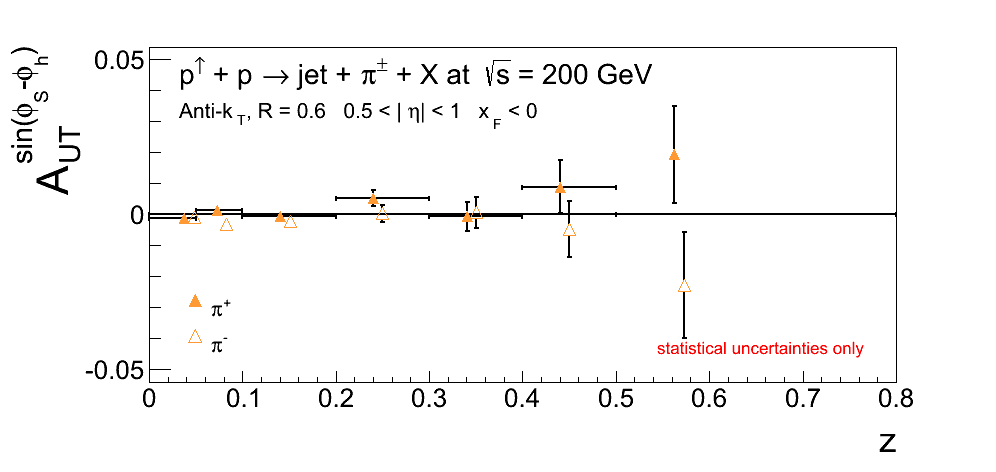
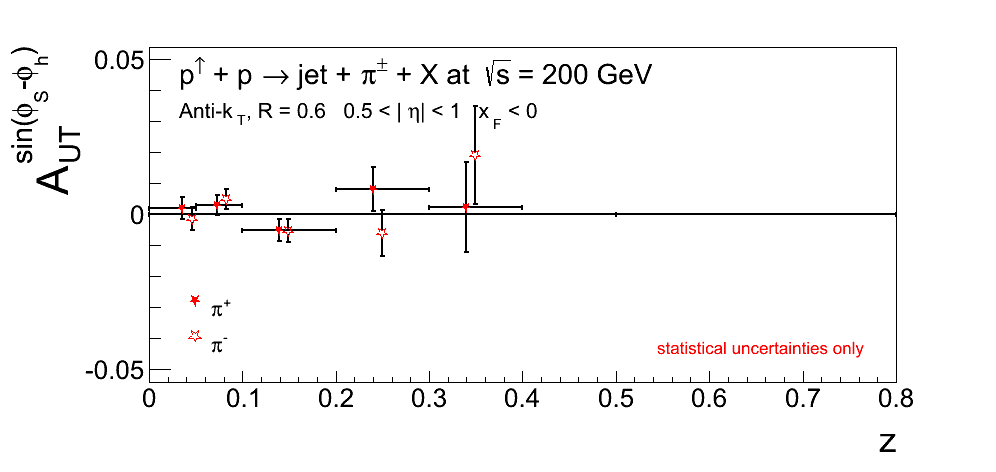
Figure 19: xF < 0 and 0.5 < |η| < 1
| VPDMB | JP0 |
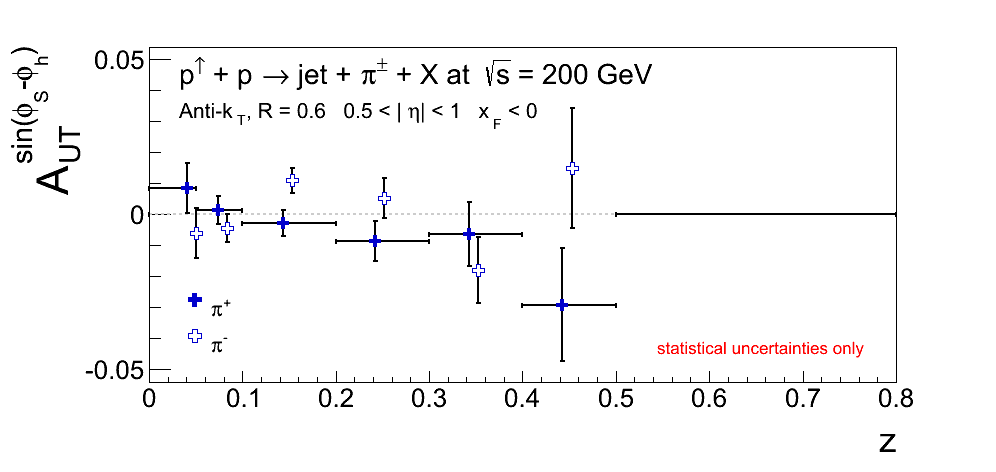 |
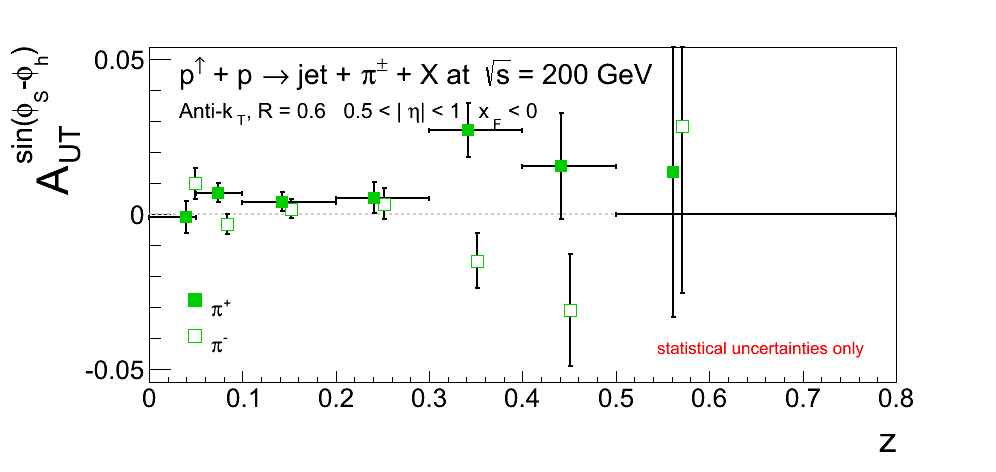 |
| JP1 | JP2 |
 |
 |
- drach09's blog
- Login or register to post comments
