- drach09's home page
- Posts
- 2022
- 2020
- June (1)
- 2019
- 2018
- 2017
- 2016
- 2015
- 2014
- December (13)
- November (2)
- October (5)
- September (2)
- August (8)
- July (9)
- June (7)
- May (5)
- April (4)
- March (4)
- February (1)
- January (2)
- 2013
- December (2)
- November (8)
- October (5)
- September (12)
- August (5)
- July (2)
- June (3)
- May (4)
- April (8)
- March (10)
- February (9)
- January (11)
- 2012
- 2011
- October (1)
- My blog
- Post new blog entry
- All blogs
Run-11 Transverse Jets: VPDMB Transverse Momentum Resolution
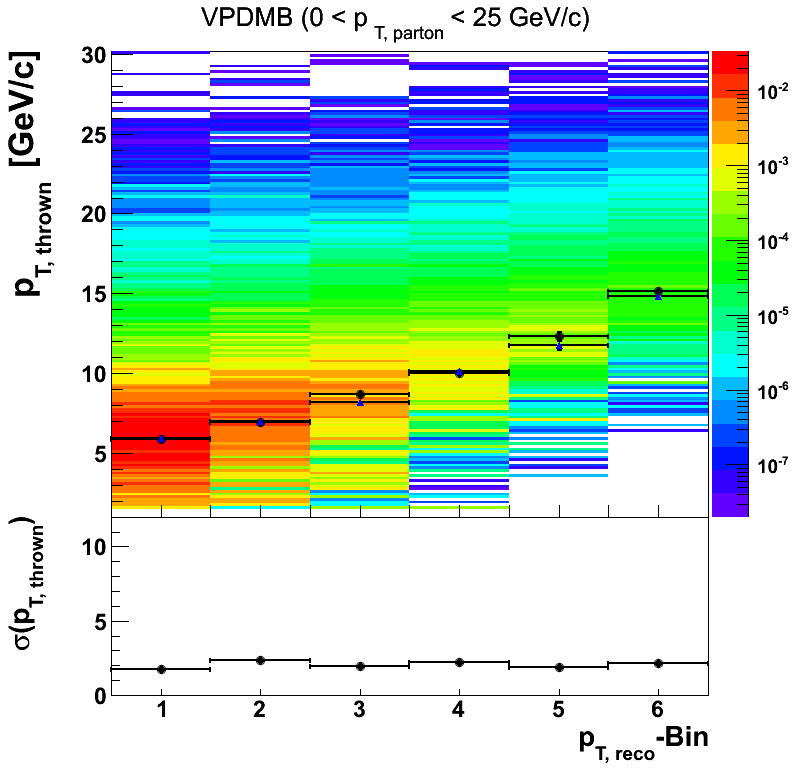
Since the pT spectra for VPDMB-triggered jets in embedding and data show reasonable agreement, I thought it worthwhile to examine the pT shifts. The procedure, here, is similar to what I've shown for JP2 triggers in the Run-9 embedding. I match to particle jets and plot the thrown jet pT as a function of reconstructed pT-bin. I, then, calculate the mean and RMS (really, it's standard deviation) from a TProfile and also from a fit to the thrown jet distribution within a reco. bin. For the function I use a skew-normal distribution. For several bins, the fit is problematic when I try to include all of the bins. To overcome some of the problematic fits, I tried both rebinning and varying the fit range. For this blog, I've settled on varying the fit range until the distribution looks reasonable by eye. I've posted the individual fits at the bottom of the page.
Table 1
| Reco. Bin (GeV/c) | Mean (calc) | Mean Err (calc) | σ (calc) | Mean (fit) | Mean Err (fit) | σ (fit) |
|---|---|---|---|---|---|---|
| 6-7.1 | 5.91 | 0.055 | 1.75 | 5.89 | 0.16 | 1.73 |
| 7.1-8.4 | 7.02 | 0.10 | 2.205 | 6.96 | 0.16 | 2.33 |
| 8.4-9.9 | 8.14 | 0.16 | 2.55 | 8.69 | 0.21 | 1.99 |
| 9.9-11.7 | 10.09 | 0.195 | 2.28 | 9.99 | 0.25 | 2.20 |
| 11.7-13.8 | 11.75 | 0.37 | 2.597 | 12.30 | 0.28 | 1.899 |
| 13.8-16.3 | 14.79 | 0.15 | 2.67 | 15.12 | 0.15 | 2.16 |
For reference, in Table 1 I show the results of the calculated means and σ's compared to those of the fitting. In general the values are quite close.
Figure 1

In Fig. 1 I plot the mean and σ versus reco. pT bin. One can see that the resolution appears to be fairly constant across the range. If the mean values are indeed correct it also appears I have sufficient VPDMB simulation.
- drach09's blog
- Login or register to post comments
