Run-11 Transverse Jets: dE/dx PID Plots
Updated on Tue, 2015-12-01 22:52. Originally created by drach09 on 2015-11-30 23:02.
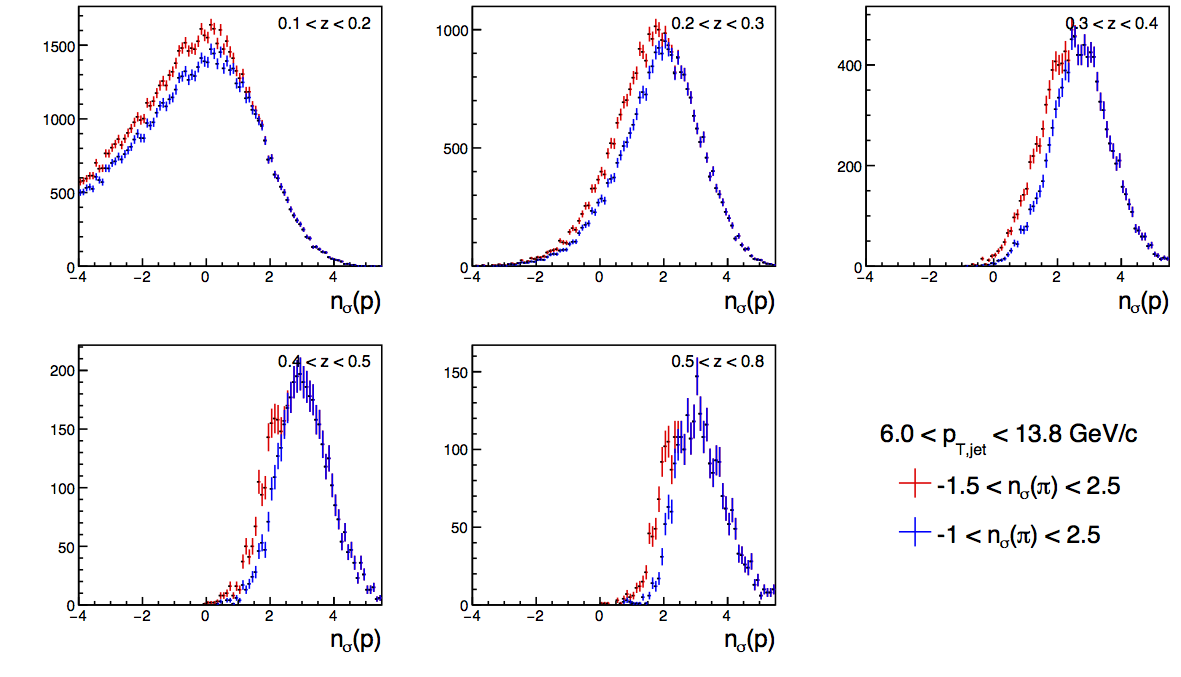
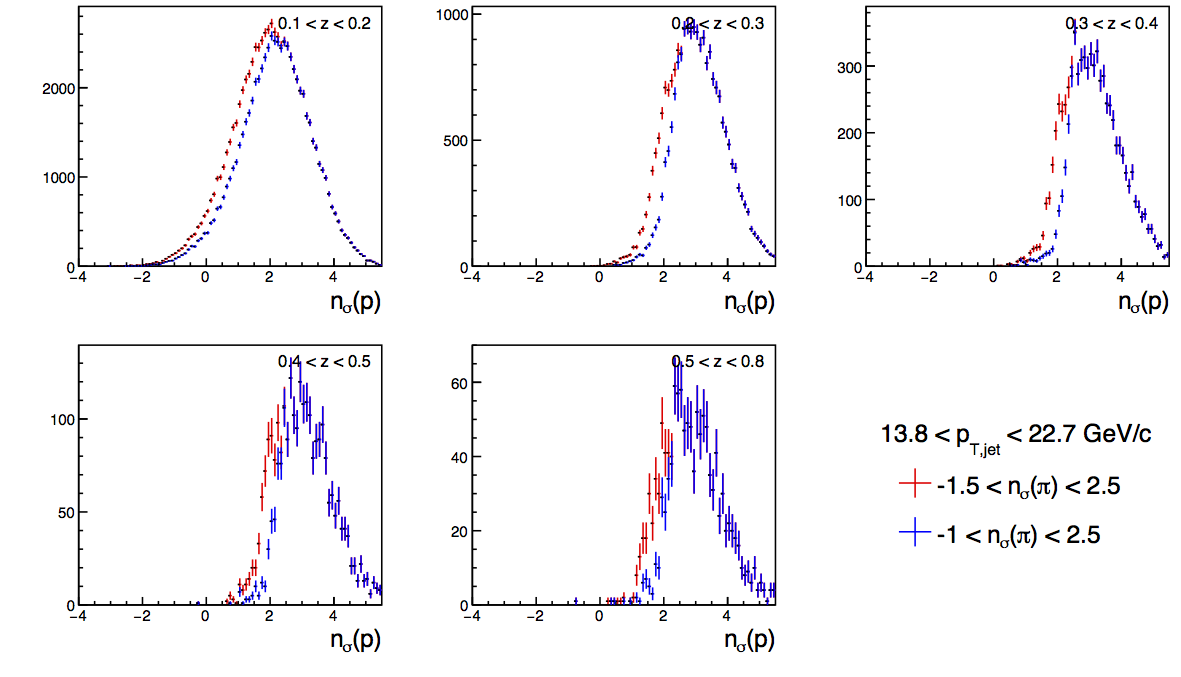
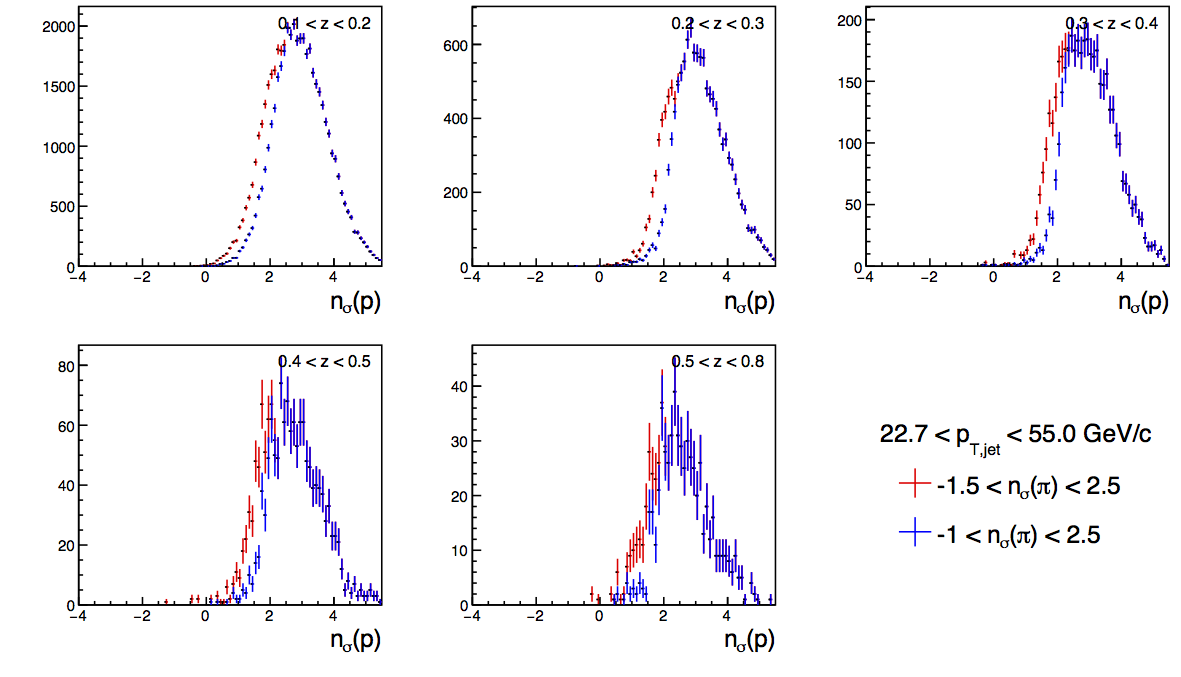
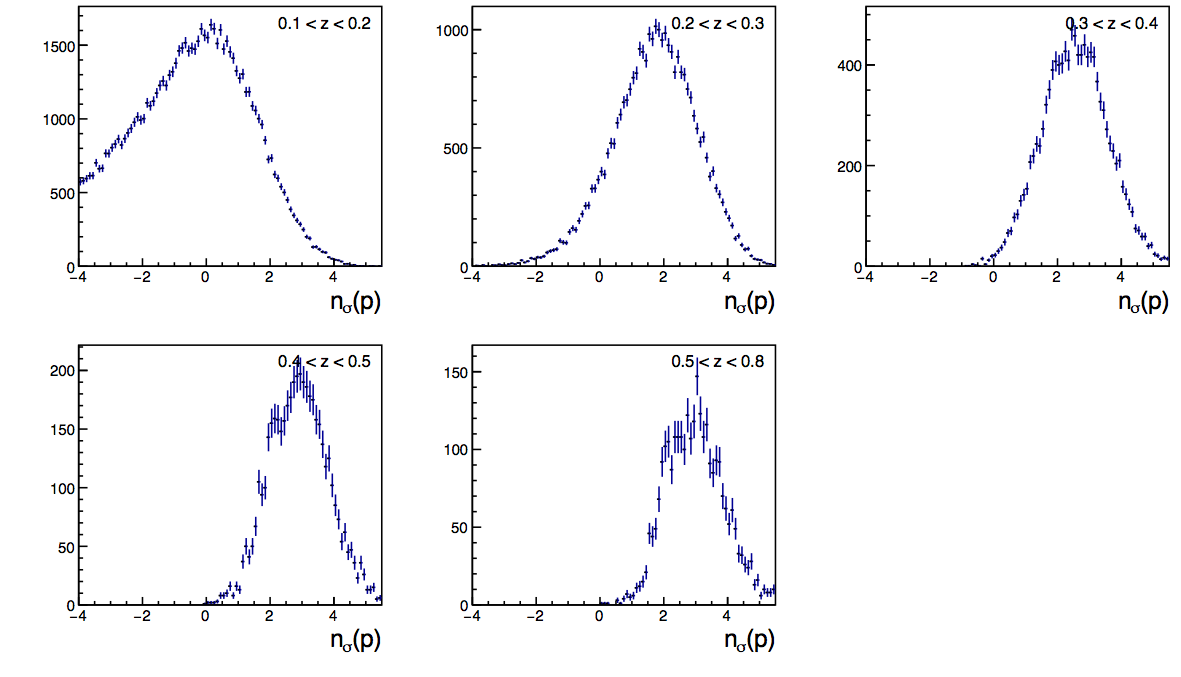
The following plots show nσ(K,p,e) plots for events passing the "standard" 2011 nσ(π) cuts (-1.5 to +2.5) in comparison to a potential set of new cuts (-1 to +2.5). The events are shown in bins of jet pT and pion z. The statistics represent a single day's (Day 52) worth of data.
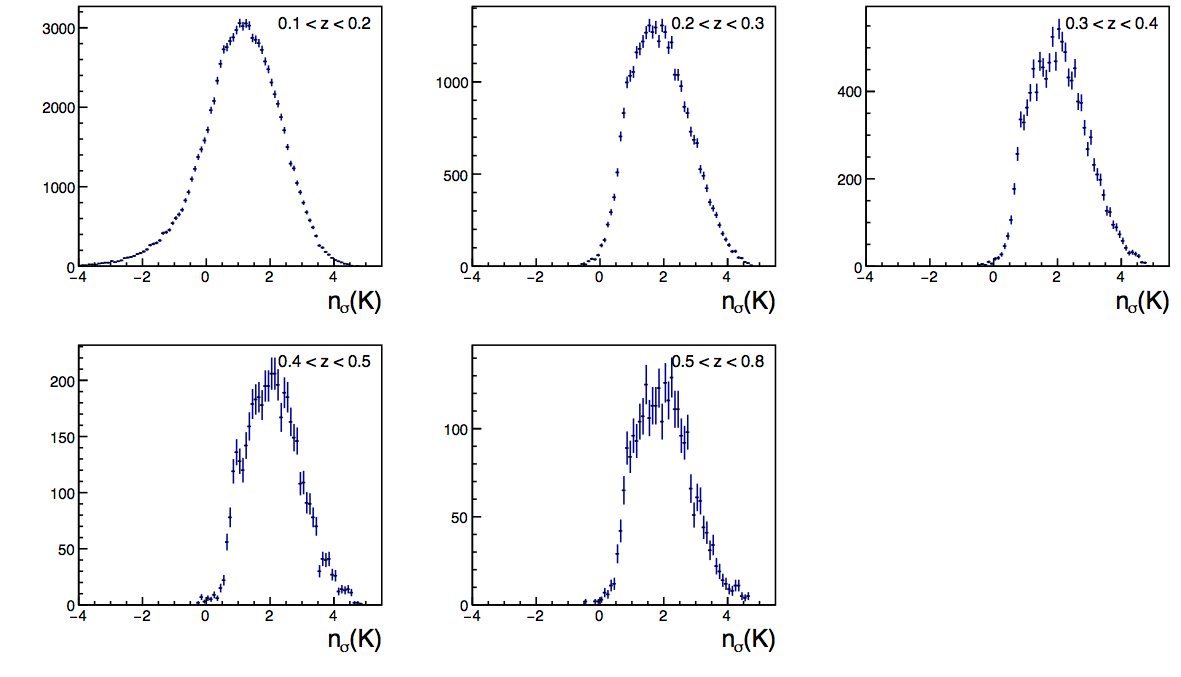
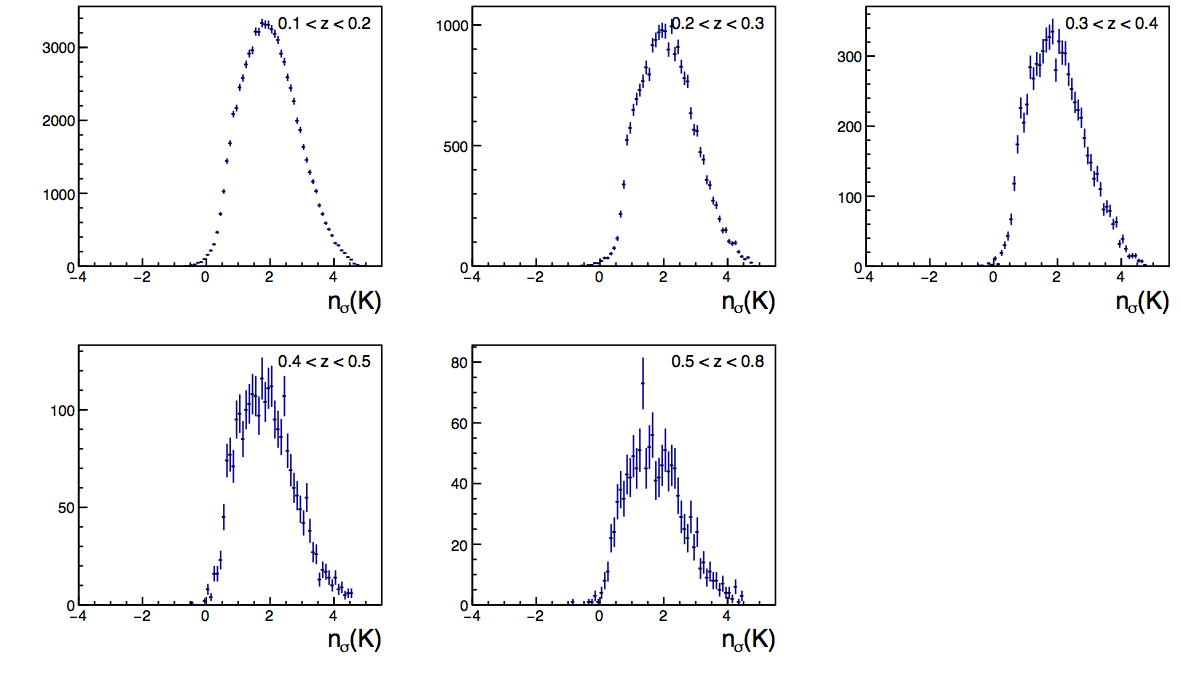
Figure 1: nσ(K)
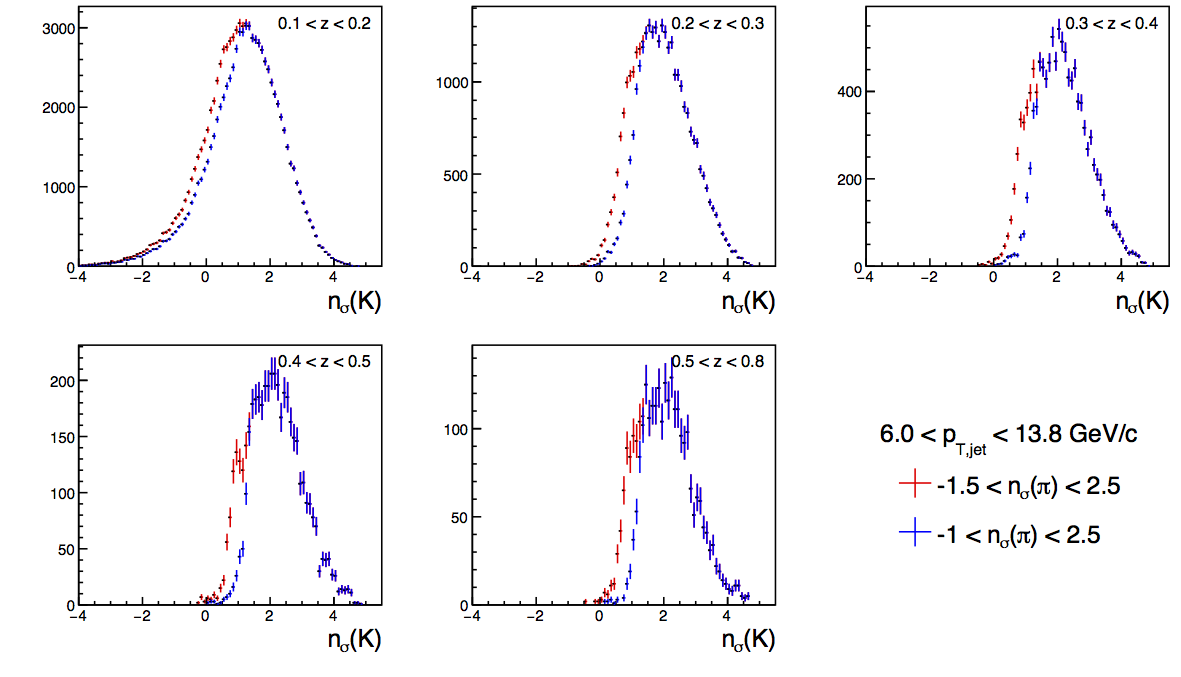
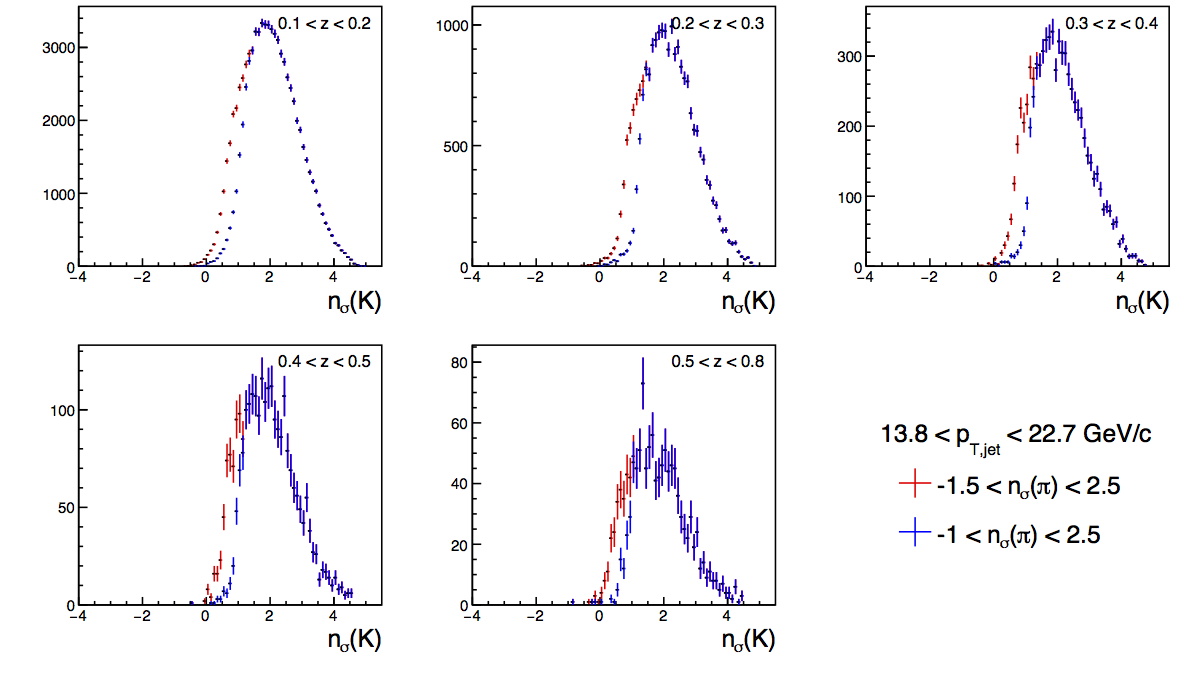
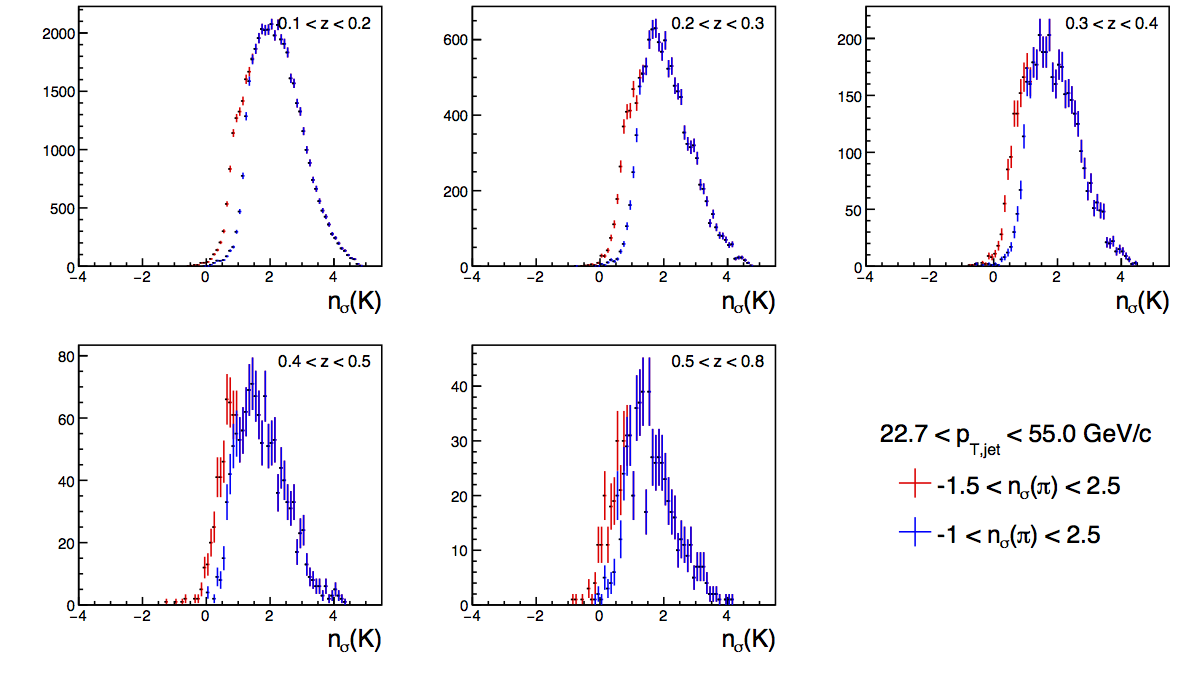
Figure 2: nσ(p)
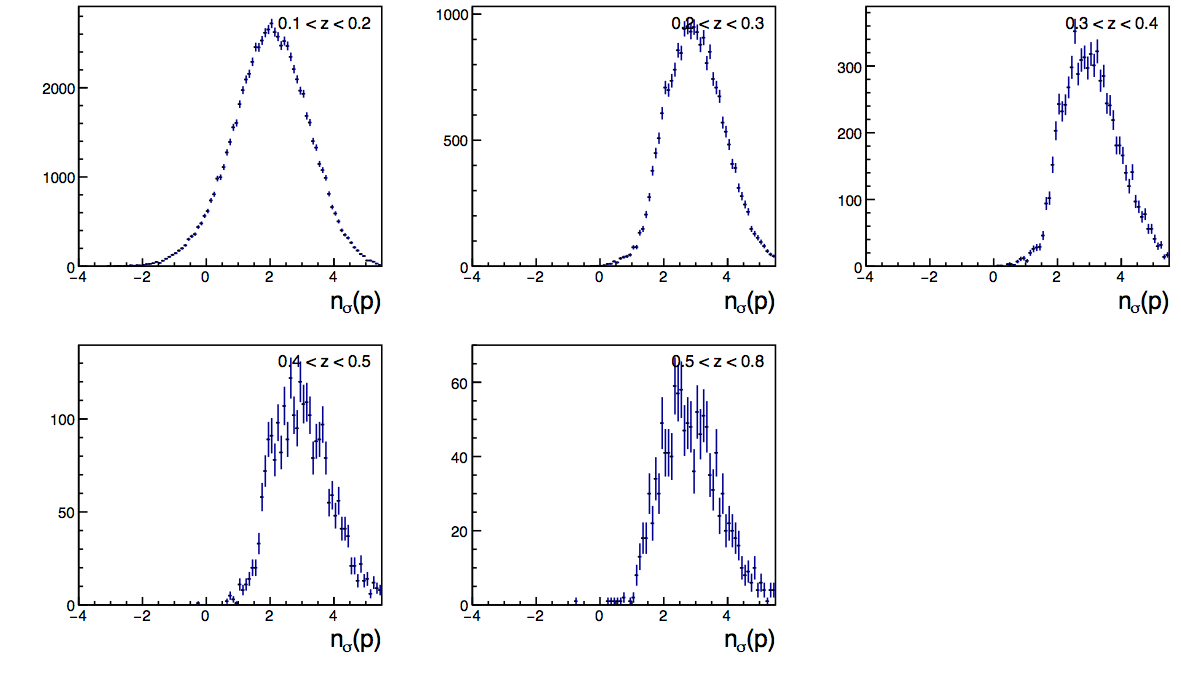
The figures below show the dE/dx PID plots for the original set of pion cuts.
Figure 3: nσ(K)
| 6 < pT < 13.8 GeV/c |
 |
| 13.8 < pT < 22.7 GeV/c |
 |
| 22.7 < pT < 55 GeV/c |
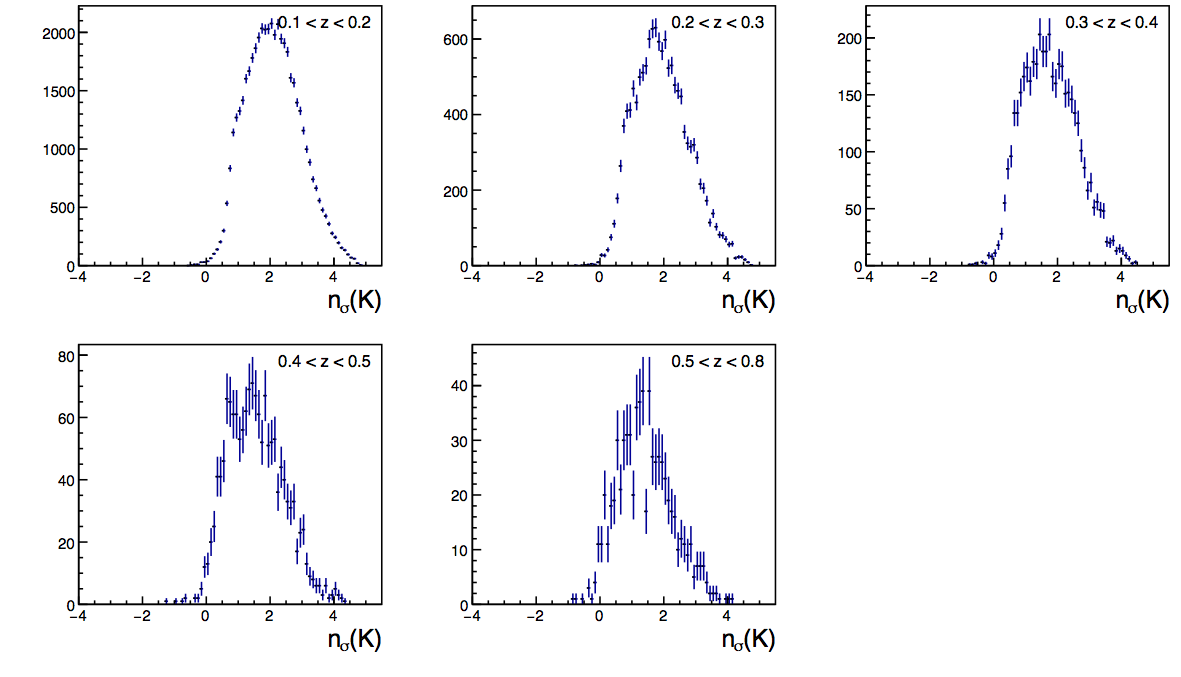 |
Figure 4: nσ(p)
| 6 < pT < 13.8 GeV/c |
 |
| 13.8 < pT < 22.7 GeV/c |
 |
| 22.7 < pT < 55 GeV/c |
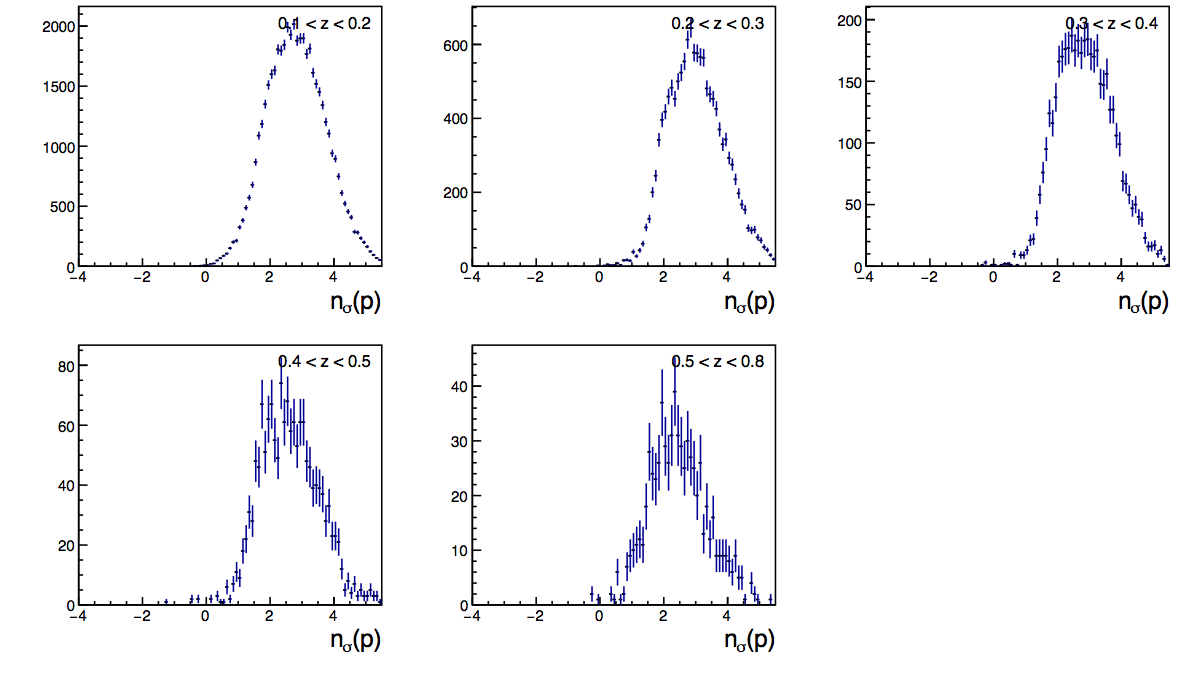 |
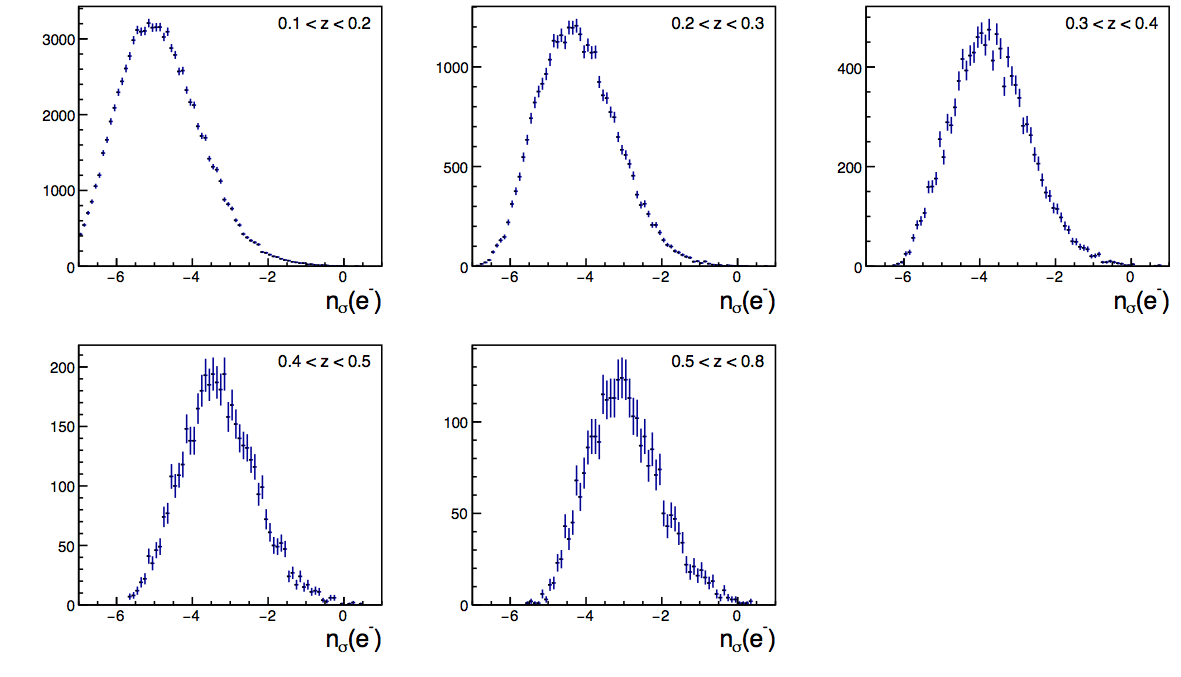
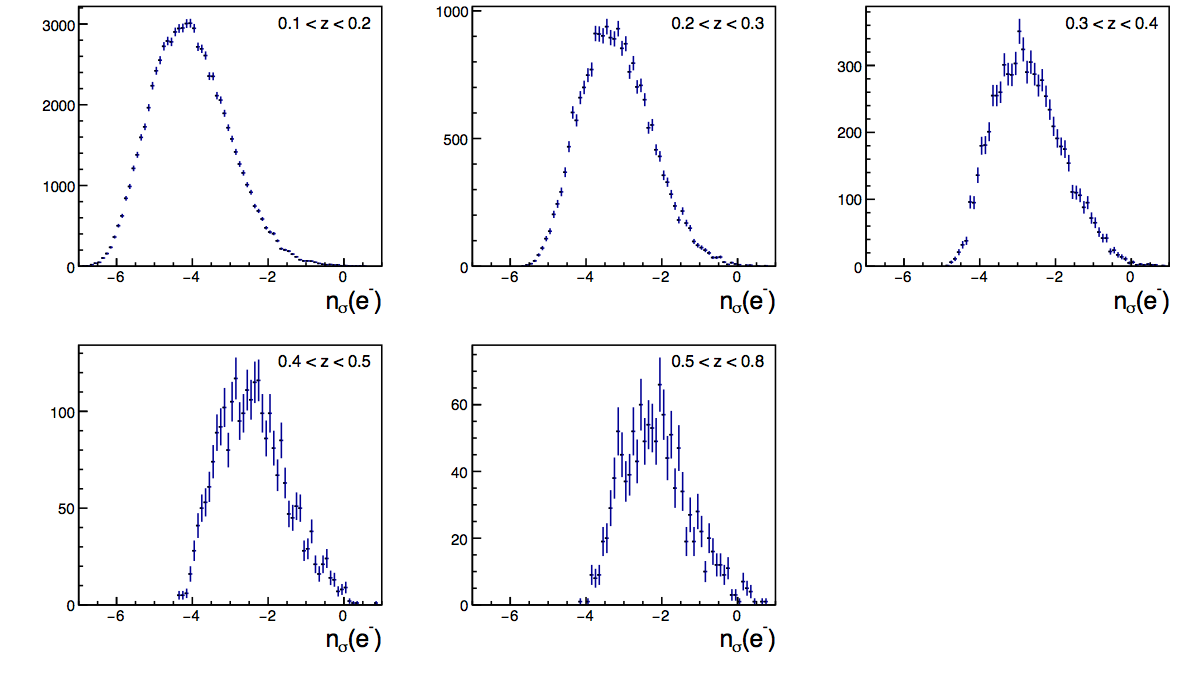
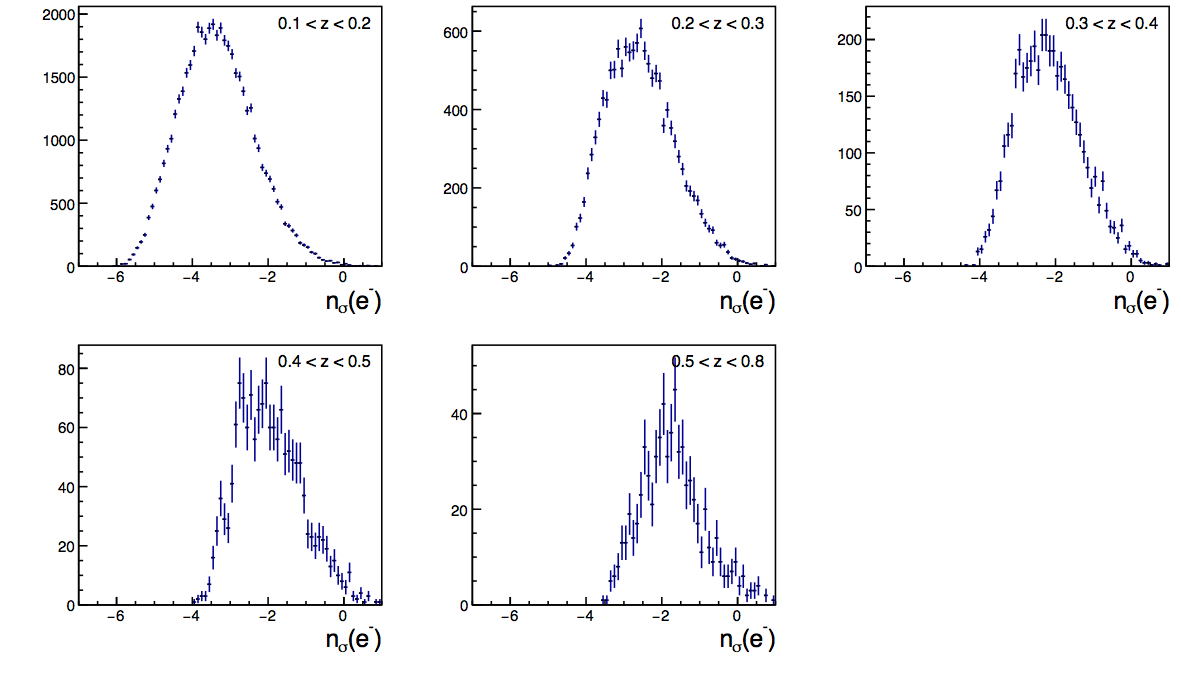
Figure 5: nσ(e)
| 6 < pT < 13.8 GeV/c |
 |
| 13.8 < pT < 22.7 GeV/c |
 |
| 22.7 < pT < 55 GeV/c |
 |
»
- drach09's blog
- Login or register to post comments