It was suggested that I look into performing the multi-Gaussian fits over finer pT bins. Here I post results of fitting bin-by-bin over the standard pT bins for each bin of z. I compare these results to the results of simply fitting over the data folded into one large bin of pT.
Overall Fractions (High pT)
Figure 1: 0.1 < z < 0.2
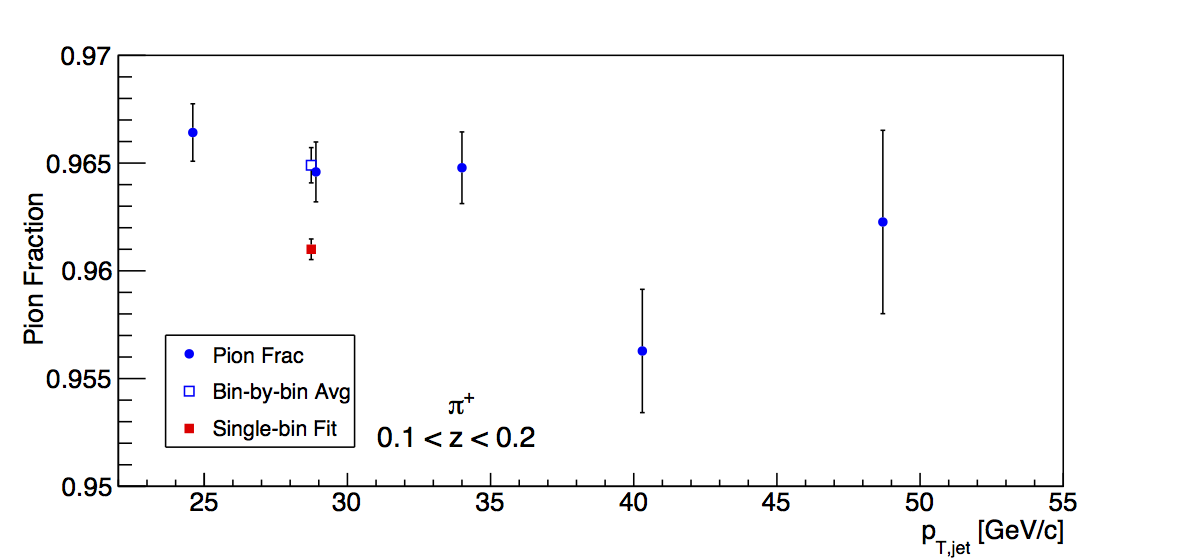
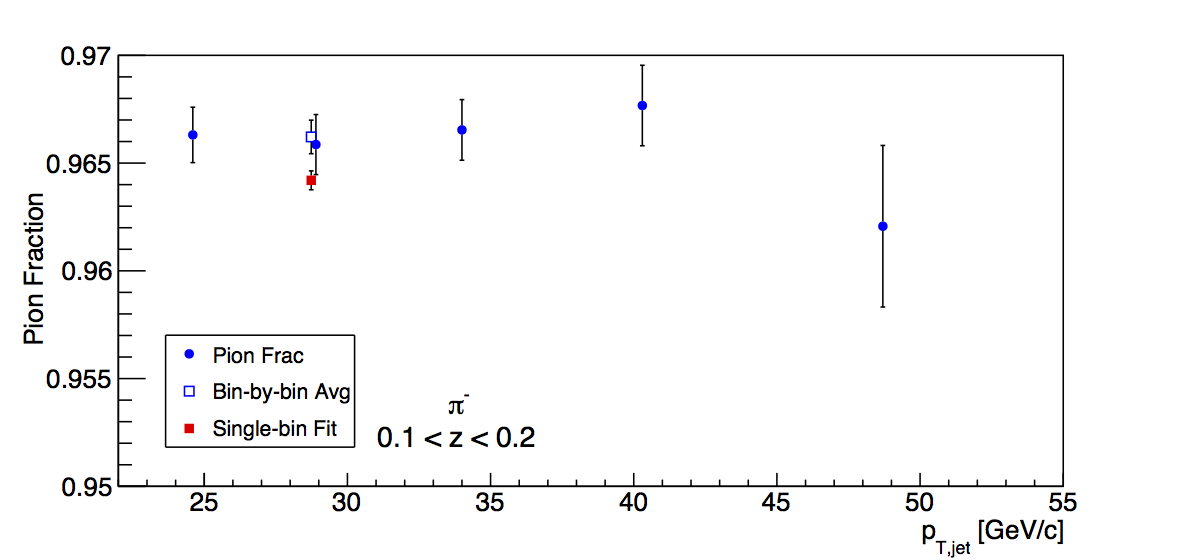
Table 1: 0.1 < z < 0.2 (Positively Charged Tracks)
| Fit Type |
Pion Frac (overall) |
Kaon Frac (overall) |
Proton Frac (overall) |
Positron Frac (overall) |
| Bin-by-bin |
96.490%±0.082% |
2.17% |
0.48% |
0.74% |
| Single Fit |
96.096%±0.048% |
2.50% |
0.44% |
0.86% |
Table 2: 0.1 < z < 0.2 (Negatively Charged Tracks)
| Fit Type |
Pion Frac (overall) |
Kaon Frac (overall) |
Anti-proton Frac (overall) |
Electron Frac (overall) |
| Bin-by-bin |
96.621%±0.078% |
1.97% |
0.34% |
0.95% |
| Single Fit |
96.422%±0.044% |
2.16% |
0.33% |
0.99% |
At low z, the fractions from the two methods are nearly identical (though, "statistically" different).
Figure 2: 0.2 < z < 0.3
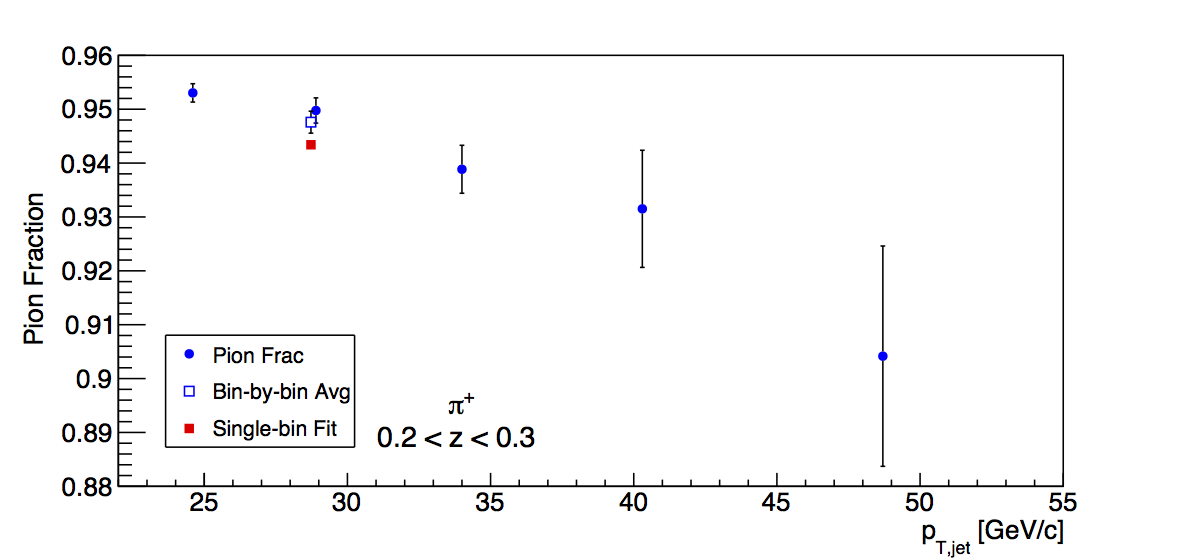
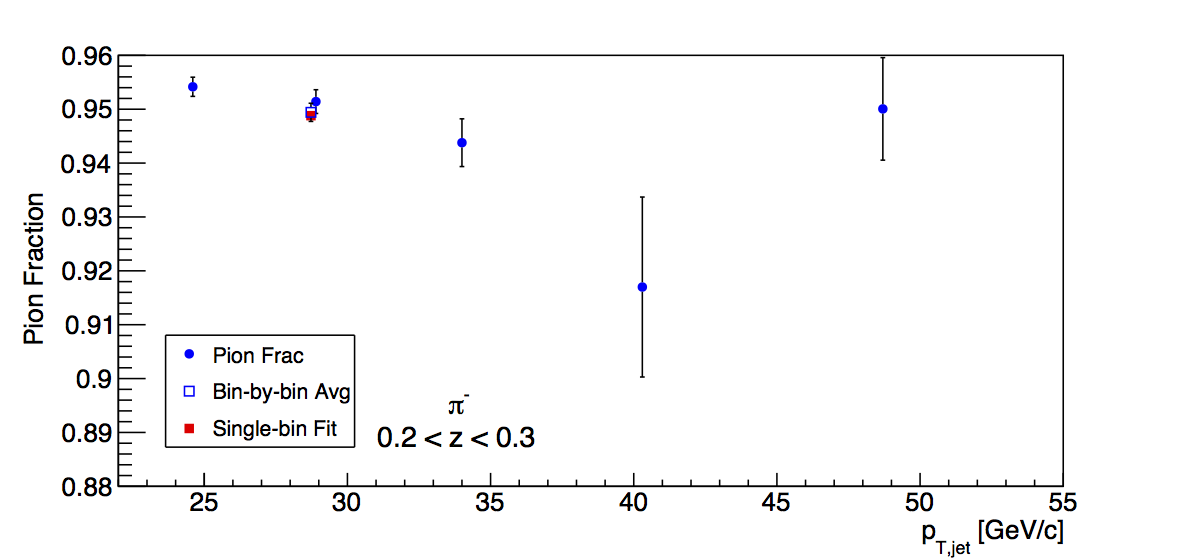
Table 3: 0.2 < z < 0.3 (Positively Charged Tracks)
| Fit Type |
Pion Frac (overall) |
Kaon Frac (overall) |
Proton Frac (overall) |
Positron Frac (overall) |
| Bin-by-bin |
94.76%±0.20% |
3.29% |
0.15% |
1.69% |
| Single Fit |
94.345%±0.078% |
3.48% |
0.16% |
1.84% |
Table 4: 0.2 < z < 0.3 (Negatively Charged Tracks)
| Fit Type |
Pion Frac (overall) |
Kaon Frac (overall) |
Anti-proton Frac (overall) |
Electron Frac (overall) |
| Bin-by-bin |
94.94%±0.17% |
2.83% |
0.11% |
1.98% |
| Single Fit |
94.875%±0.076% |
2.83% |
0.11% |
2.03% |
The second z bin behaves quite like the first, with the two fitting methods returning nearly identical results. I did a bit of finessing to get one of the fits to converge. I fixed the K-/p-bar width for the 45-55 GeV/c bin to the result of averaging over the 23-55 GeV/c bins (a value of 0.8795±0.0090 with χ2/ν = 3.481/4). Similarly I fixed the electron width for the 45-55 GeV/c bin to the result of averaging over the 28-55 GeV/c bin (a value of 0.833±0.027 with χ2/ν = 0.2127/3).
Figure 3: 0.3 < z < 0.4

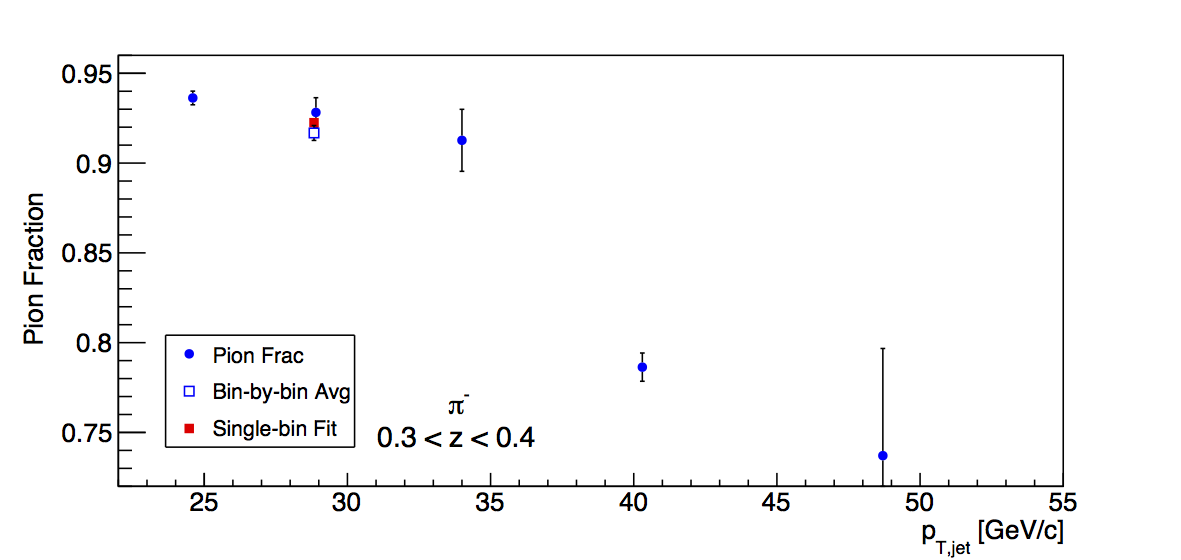
Table 5: 0.3 < z < 0.4 (Positively Charged Tracks)
| Fit Type |
Pion Frac (overall) |
Kaon Frac (overall) |
Proton Frac (overall) |
Positron Frac (overall) |
| Bin-by-bin |
91.24%±0.54% |
5.62% |
0.30% |
2.61% |
| Single Fit |
90.25%±0.16% |
6.24% |
0.40% |
2.91% |
Table 6: 0.3 < z < 0.4 (Negatively Charged Tracks)
| Fit Type |
Pion Frac (overall) |
Kaon Frac (overall) |
Anti-proton Frac (overall) |
Electron Frac (overall) |
| Bin-by-bin |
91.68%±0.42% |
4.46% |
0.19% |
3.51% |
| Single Fit |
92.25%±0.11% |
4.37% |
0.23% |
3.02% |
The results of the third z bin are also quite similar between the two methodologies. More tweaking was necessary to get the fits to converge. For K+/p at 37.3-45 GeV/c, I fixed the width to the average over 23-55 GeV/c, excluding the 37.3-45 GeV/c bin (which failed to converge sensibly). This result was 0.9118 with χ2/ν = 3.210/3.
Figure 4: 0.4 < z < 0.5
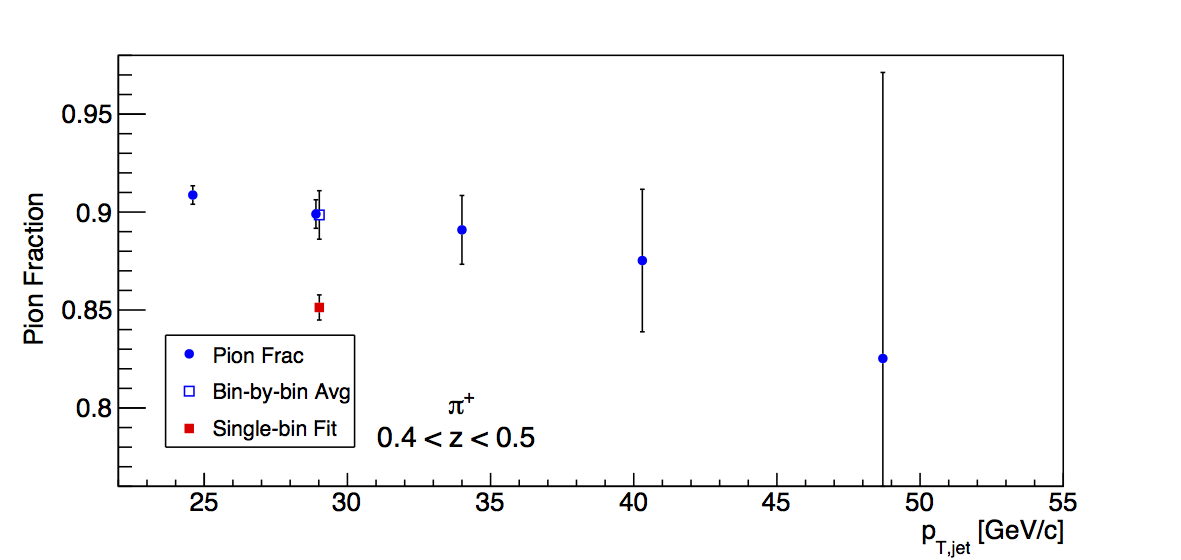
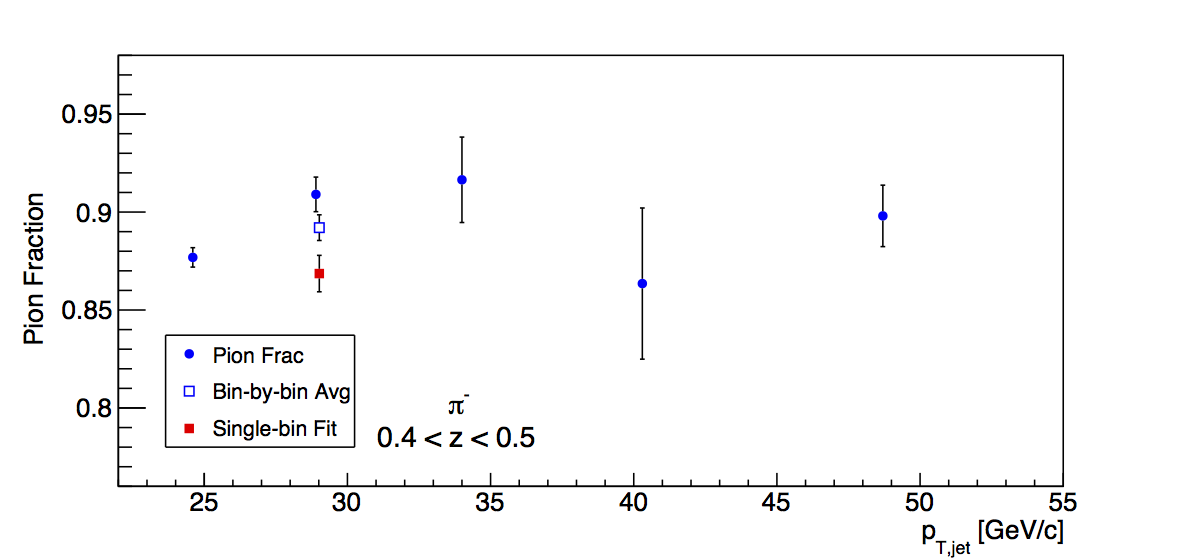
Table 7: 0.4 < z < 0.5 (Positively Charged Tracks)
| Fit Type |
Pion Frac (overall) |
Kaon Frac (overall) |
Proton Frac (overall) |
Positron Frac (overall) |
| Bin-by-bin |
89.9%±1.2% |
6.27% |
0.43% |
3.26% |
| Single Fit |
85.13%±0.64% |
9.95% |
0.69% |
4.03% |
Table 8: 0.4 < z < 0.5 (Negatively Charged Tracks)
| Fit Type |
Pion Frac (overall) |
Kaon Frac (overall) |
Anti-proton Frac (overall) |
Electron Frac (overall) |
| Bin-by-bin |
89.20%±0.66% |
5.78% |
0.45% |
4.38% |
| Single Fit |
86.86%±0.93% |
8.02% |
0.37% |
4.66% |
Beginning with the fourth z bin, more of the fits need a bit of finesse to converge sensibly. For the 22.7-26.8 GeV/c bin and above I fix the K+/p widths to the average over 23-55 GeV/c (0.906±0.037 with χ2/ν = 1.692/4), the K-/p-bar widths to the average over 23-55 GeV/c (0.971±0.042 with χ2/ν = 0.8373/4), and the electron widths to their average over 23-55 GeV/c (0.899±0.046 with χ2/ν = 2.876/4). The largest differences between the two methodologies seem to arise from the estimates of the kaon and proton backgrounds. The bin-by-bin fits find kaon and proton backgrounds a good bit smaller than those in the single fits. It should also be noted that the fit for the highest pT bin could not converge to a K- peak with nonzero amplitude. This bin, however, should make very little contribution to the overall K- fraction.
Figure 5: 0.5 < z < 0.8
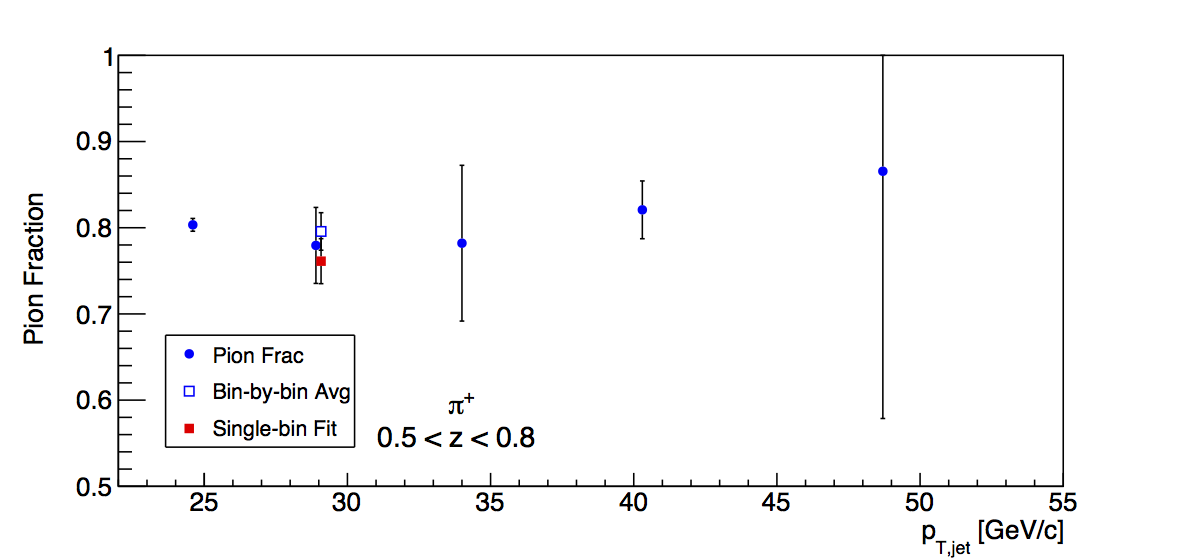
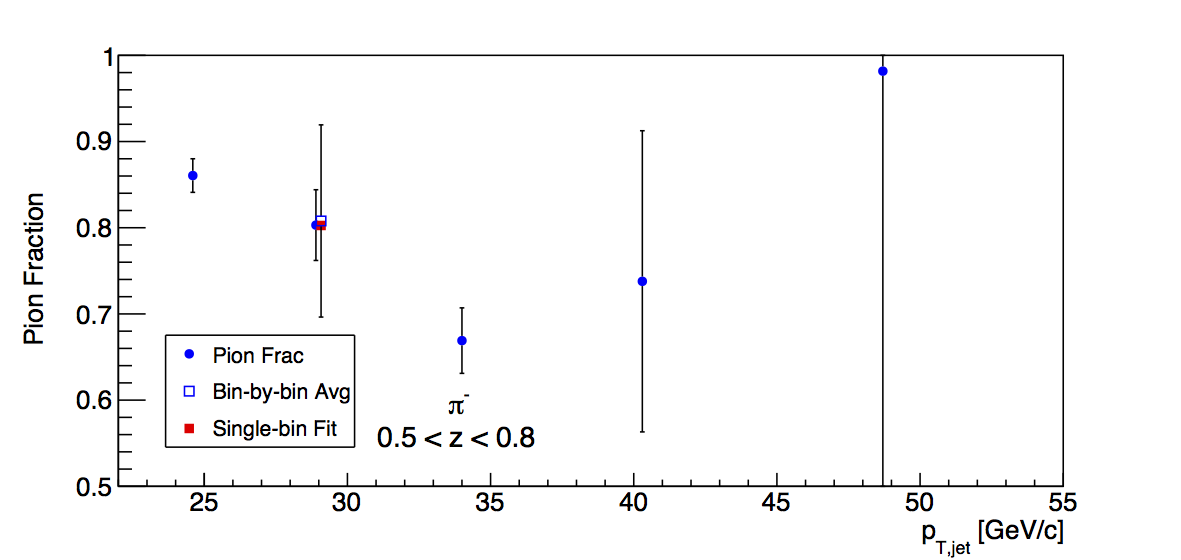
Table 9: 0.5 < z < 0.8 (Positively Charged Tracks)
| Fit Type |
Pion Frac (overall) |
Kaon Frac (overall) |
Proton Frac (overall) |
Positron Frac (overall) |
| Bin-by-bin |
79.6%±2.2% |
14.76% |
0.29% |
5.25% |
| Single Fit |
76.1%±2.6% |
18.28% |
0.25% |
5.24% |
Table 10: 0.5 < z < 0.8 (Negatively Charged Tracks)
| Fit Type |
Pion Frac (overall) |
Kaon Frac (overall) |
Anti-proton Frac (overall) |
Electron Frac (overall) |
| Bin-by-bin |
81%±11% |
11.08% |
0.44% |
7.40% |
| Single Fit |
80.26%±0.35% |
13.63% |
0.00% |
5.93% |
The highest z bin becomes rather difficult to split into finer pT bins, however, the end results are fairly similar between the two methodologies. Again, I had to finesse several of the fits. I fixed the K-/p-bar widths to the 23-55 GeV/c average of (1.111±0.040 with χ2/ν = 2.114/4), and I fixed the positron widths to their average (0.899±0.058 with χ2/ν = 3.112/4). It should be noted that the highest pT bin failed to converge to a fit with a K- or electron peak with nonzero amplitude. However, this bin should contribute rather little to the overall kaon and electron fractions.
Details (High pT)
The tables below contain the detailed information from the PID fits. I quote the total, pion, kaon, proton, and electron yields within the PID cuts as well as the total yields integrating over the full PID Gaussians. There are two bins for which the fits did not converge to nonzero amplitudes for all particle species. These are the 45-55 GeV/c bins for negatively charged tracks with 0.5 < z < 0.8. This is probably the result of very low statistics and Gaussians with centroids beginning to overlap, again. The impact on the extracted signal fractions is negligible.
Table 11: 0.1 < z < 0.2 (Positively Charged Tracks)
| pT [GeV/c] |
Total Yield (wi/in cuts) |
Pion Frac |
Kaon Frac |
Proton Frac |
Positron Frac |
Pion Yield (w/in cuts) |
Kaon Yield (w/in cuts) |
Proton Yield (w/in cuts) |
Positron Yield (w/in cuts) |
Pion Yield (total) |
Kaon Yield (total) |
Proton Yield (total) |
Positron Yield (total) |
| 22.7-26.8 |
554409 |
96.642% |
1.951% |
0.732% |
0.584% |
535791 |
10817 |
4055 |
3237 |
625277 |
68851 |
64138 |
12793 |
| 26.8-31.6 |
337055 |
96.459% |
2.305% |
0.329% |
0.761% |
325119 |
7770 |
1108 |
2566 |
379314 |
54481 |
33394 |
7282 |
| 31.6-37.3 |
170294 |
96.478% |
2.270% |
0.179% |
0.941% |
164296 |
3864 |
305 |
1603 |
192734 |
30029 |
16810 |
3566 |
| 37.3-45 |
76103 |
95.628% |
2.905% |
0.160% |
1.264% |
72775 |
2210 |
121 |
962 |
85117 |
15862 |
7071 |
1644 |
| 45-55 |
23656 |
96.227% |
2.207% |
0.097% |
1.200% |
22763 |
522 |
22 |
283 |
27188 |
4235 |
2511 |
417 |
Table 12: 0.1 < z < 0.2 (Negatively Charged Tracks)
| pT [GeV/c] |
Total Yield |
Pion Frac |
Kaon Frac |
Anti-proton Frac |
Electron Frac |
Pion Yield (w/in cuts) |
Kaon Yield (w/in cuts) |
Anti-proton Yield (w/in cuts) |
Electron Yield (w/in cuts) |
Pion Yield (total) |
Kaon Yield (total) |
Anti-proton Yield (total) |
Electron Yield (total) |
| 22.7-26.8 |
533445 |
96.631% |
1.966% |
0.513% |
0.777% |
515471 |
10487 |
2737 |
4143 |
606010 |
72151 |
51108 |
14020 |
| 26.8-31.6 |
323538 |
96.586% |
2.082% |
0.239% |
0.985% |
312492 |
6734 |
774 |
3185 |
368217 |
51533 |
27858 |
7897 |
| 31.6-37.3 |
162244 |
96.654% |
1.925% |
0.129% |
1.180% |
156815 |
3123 |
208 |
1914 |
186369 |
26869 |
14196 |
3733 |
| 37.3-45 |
72116 |
96.767% |
1.608% |
0.067% |
1.370% |
69784 |
1159 |
48 |
987 |
84205 |
11343 |
6633 |
1566 |
| 45-55 |
22220 |
96.207% |
2.031% |
0.080% |
1.633% |
21377 |
451 |
17 |
362 |
25795 |
3752 |
2102 |
507 |
Table 13: 0.2 < z < 0.3 (Positively Charged Tracks)
| pT [GeV/c] |
Total Yield |
Pion Frac |
Kaon Frac |
Proton Frac |
Positron Frac |
Pion Yield (w/in cuts) |
Kaon Yield (w/in cuts) |
Proton Yield (w/in cuts) |
Positron Yield (w/in cuts) |
Pion Yield (total) |
Kaon Yield (total) |
Proton Yield (total) |
Positron Yield (total) |
| 22.7-26.8 |
160326 |
95.303% |
2.952% |
0.126% |
1.592% |
152795 |
4733 |
202 |
2551 |
179658 |
37698 |
18670 |
4419 |
| 26.8-31.6 |
98611 |
94.976% |
3.027% |
0.121% |
1.697% |
93657 |
2985 |
119 |
1673 |
110815 |
22743 |
12276 |
2473 |
| 31.6-37.3 |
50229 |
93.885% |
3.972% |
0.201% |
1.865% |
47157 |
1995 |
101 |
936 |
55831 |
12491 |
6309 |
1232 |
| 37.3-45 |
21966 |
93.151% |
4.823% |
0.273% |
1.371% |
20461 |
1059 |
59 |
301 |
24311 |
5762 |
2838 |
376 |
| 45-55 |
6732 |
90.416% |
5.255% |
0.359% |
3.774% |
6086 |
353 |
24 |
254 |
7361 |
1798 |
827 |
265 |
Table 14: 0.2 < z < 0.3 (Negatively Charged Tracks)
| pT [GeV/c] |
Total Yield |
Pion Frac |
Kaon Frac |
Anti-proton Frac |
Electron Frac |
Pion Yield (w/in cuts) |
Kaon Yield (w/in cuts) |
Anti-proton Yield (w/in cuts) |
Electron Yield (w/in cuts) |
Pion Yield (total) |
Kaon Yield (total) |
Anti-proton Yield (total) |
Electron Yield (total) |
| 22.7-26.8 |
148622 |
95.416% |
2.471% |
0.087% |
1.910% |
141809 |
3672 |
129 |
2838 |
170131 |
32703 |
15766 |
4507 |
| 26.8-31.6 |
90785 |
95.141% |
2.639% |
0.089% |
1.955% |
86374 |
2395 |
80 |
1774 |
103561 |
19602 |
10033 |
2450 |
| 31.6-37.3 |
45507 |
94.378% |
3.140% |
0.138% |
2.126% |
42948 |
1428 |
62 |
967 |
51700 |
9852 |
5154 |
1208 |
| 37.3-45 |
19530 |
91.699% |
5.533% |
0.240% |
2.469% |
17908 |
1080 |
46 |
482 |
21343 |
5678 |
1774 |
566 |
| 45-55 |
5846 |
95.006% |
3.407% |
0.286% |
1.241% |
5554 |
199 |
16 |
72 |
6965 |
1067 |
724 |
79 |
Table 15: 0.3 < z < 0.4 (Positively Charged Tracks)
| pT [GeV/c] |
Total Yield |
Pion Frac |
Kaon Frac |
Proton Frac |
Positron Frac |
Pion Yield (w/in cuts) |
Kaon Yield (w/in cuts) |
Proton Yield (w/in cuts) |
Positron Yield (w/in cuts) |
Pion Yield (total) |
Kaon Yield (total) |
Proton Yield (total) |
Positron Yield (total) |
| 22.7-26.8 |
52754 |
92.634% |
4.658% |
0.235% |
2.302% |
48867 |
2457 |
123 |
1214 |
57442 |
14741 |
7089 |
1648 |
| 26.8-31.6 |
33456 |
92.836% |
4.733% |
0.277% |
2.098% |
31059 |
1583 |
92 |
702 |
36941 |
8856 |
4718 |
894 |
| 31.6-37.3 |
17305 |
85.555% |
9.431% |
0.453% |
4.219% |
14805 |
1631 |
78 |
730 |
17211 |
6931 |
1707 |
810 |
| 37.3-45 |
7589 |
87.378% |
7.645% |
0.430% |
3.804% |
6631 |
580 |
32 |
288 |
7910 |
2582 |
891 |
300 |
| 45-55 |
2374 |
91.524% |
5.432% |
0.440% |
1.143% |
2172 |
128 |
10 |
27 |
2616 |
600 |
365 |
26 |
Table 16: 0.3 < z < 0.4 (Negatively Charged Tracks)
| pT [GeV/c] |
Total Yield |
Pion Frac |
Kaon Frac |
Anti-proton Frac |
Electron Frac |
Pion Yield (w/in cuts) |
Kaon Yield (w/in cuts) |
Anti-proton Yield (w/in cuts) |
Electron Yield (w/in cuts) |
Pion Yield (total) |
Kaon Yield (total) |
Anti-proton Yield (total) |
Electron Yield (total) |
| 22.7-26.8 |
46400 |
93.627% |
2.965% |
0.125% |
3.167% |
43442 |
1375 |
58 |
1469 |
53290 |
10362 |
6056 |
1882 |
| 26.8-31.6 |
28988 |
92.821% |
4.522% |
0.230% |
2.317% |
26906 |
1310 |
66 |
671 |
32870 |
7513 |
3296 |
799 |
| 31.6-37.3 |
14428 |
91.267% |
4.932% |
0.285% |
3.360% |
13168 |
711 |
41 |
484 |
16306 |
3683 |
1606 |
525 |
| 37.3-45 |
6409 |
78.637% |
11.796% |
0.191% |
9.233% |
5039 |
755 |
12 |
591 |
5980 |
2976 |
204 |
599 |
| 45-55 |
1901 |
73.708% |
11.757% |
0.299% |
11.874% |
1401 |
223 |
5 |
225 |
1576 |
834 |
101 |
222 |
Table 17: 0.4 < z < 0.5 (Positively Charged Tracks)
| pT [GeV/c] |
Total Yield |
Pion Frac |
Kaon Frac |
Proton Frac |
Positron Frac |
Pion Yield (w/in cuts) |
Kaon Yield (w/in cuts) |
Proton Yield (w/in cuts) |
Positron Yield (w/in cuts) |
Pion Yield (total) |
Kaon Yield (total) |
Proton Yield (total) |
Positron Yield (total) |
| 22.7-26.8 |
17789 |
90.870% |
5.530% |
0.309% |
3.058% |
16164 |
983 |
54 |
543 |
19351 |
5139 |
2309 |
661 |
| 26.8-31.6 |
11580 |
89.900% |
5.974% |
0.400% |
3.627% |
10410 |
691 |
46 |
419 |
12580 |
3323 |
1589 |
473 |
| 31.6-37.3 |
6203 |
89.091% |
7.205% |
0.672% |
2.744% |
5526 |
446 |
41 |
170 |
6645 |
1870 |
965 |
173 |
| 37.3-45 |
2862 |
87.525% |
8.697% |
0.650% |
3.028% |
2504 |
248 |
18 |
86 |
3075 |
965 |
350 |
87 |
| 45-55 |
988 |
82.527% |
10.289% |
0.833% |
6.332% |
815 |
101 |
8 |
62 |
1013 |
336 |
107 |
67 |
Table 18: 0.4 < z < 0.5 (Negatively Charged Tracks)
| pT [GeV/c] |
Total Yield |
Pion Frac |
Kaon Frac |
Anti-proton Frac |
Electron Frac |
Pion Yield (w/in cuts) |
Kaon Yield (w/in cuts) |
Anti-proton Yield (w/in cuts) |
Electron Yield (w/in cuts) |
Pion Yield (total) |
Kaon Yield (total) |
Anti-proton Yield (total) |
Electron Yield (total) |
| 22.7-26.8 |
15040 |
87.686% |
6.274% |
0.294% |
5.650% |
13187 |
943 |
44 |
849 |
16127 |
4842 |
1548 |
990 |
| 26.8-31.6 |
9578 |
90.903% |
6.068% |
0.479% |
2.190% |
8706 |
581 |
45 |
209 |
10850 |
2536 |
1074 |
233 |
| 31.6-37.3 |
4960 |
91.646% |
5.380% |
0.683% |
2.220% |
4545 |
266 |
33 |
110 |
5850 |
1095 |
587 |
118 |
| 37.3-45 |
2090 |
86.349% |
3.701% |
0.487% |
9.159% |
1804 |
77 |
10 |
191 |
2519 |
354 |
207 |
201 |
| 45-55 |
686 |
89.804% |
0.000% |
1.802% |
8.119% |
616 |
0 |
12 |
55 |
845 |
0 |
150 |
58 |
Table 19: 0.5 < z < 0.8 (Positively Charged Tracks)
| pT [GeV/c] |
Total Yield |
Pion Frac |
Kaon Frac |
Proton Frac |
Positron Frac |
Pion Yield (w/in cuts) |
Kaon Yield (w/in cuts) |
Proton Yield (w/in cuts) |
Positron Yield (w/in cuts) |
Pion Yield (total) |
Kaon Yield (total) |
Proton Yield (total) |
Positron Yield (total) |
| 22.7-26.8 |
8277 |
80.335% |
13.600% |
0.249% |
5.806% |
6649 |
1125 |
20 |
480 |
7745 |
3938 |
265 |
560 |
| 26.8-31.6 |
5412 |
77.948% |
16.056% |
0.283% |
5.596% |
4218 |
868 |
15 |
302 |
4924 |
2871 |
174 |
343 |
| 31.6-37.3 |
2988 |
78.206% |
15.537% |
0.392% |
5.783% |
2336 |
464 |
11 |
172 |
2815 |
1473 |
121 |
186 |
| 37.3-45 |
1456 |
82.075% |
16.807% |
0.327% |
0.000% |
1195 |
244 |
4 |
0 |
1502 |
710 |
31 |
0 |
| 45-55 |
409 |
86.552% |
8.245% |
0.205% |
4.049% |
353 |
33 |
0 |
16 |
483 |
117 |
8 |
17 |
Table 20: 0.5 < z < 0.8 (Negatively Charged Tracks)
| pT [GeV/c] |
Total Yield |
Pion Frac |
Kaon Frac |
Anti-proton Frac |
Electron Frac |
Pion Yield (w/in cuts) |
Kaon Yield (w/in cuts) |
Anti-proton Yield (w/in cuts) |
Electron Yield (w/in cuts) |
Pion Yield (total) |
Kaon Yield (total) |
Anti-proton Yield (total) |
Electron Yield (total) |
| 22.7-26.8 |
6520 |
86.053% |
10.120% |
0.402% |
3.422% |
5610 |
659 |
26 |
223 |
7077 |
2377 |
328 |
299 |
| 26.8-31.6 |
4104 |
80.305% |
13.800% |
0.291% |
4.829% |
3295 |
566 |
11 |
198 |
4067 |
1879 |
111 |
215 |
| 31.6-37.3 |
2190 |
66.904% |
10.959% |
0.519% |
21.357% |
1465 |
239 |
11 |
467 |
1869 |
879 |
109 |
471 |
| 37.3-45 |
1002 |
73.782% |
9.600% |
0.840% |
15.515% |
739 |
96 |
8 |
155 |
977 |
317 |
62 |
158 |
| 45-55 |
290 |
98.167% |
0.000% |
1.627% |
0.000% |
284 |
0 |
4 |
0 |
399 |
0 |
37 |
0 |