- drach09's home page
- Posts
- 2022
- 2020
- June (1)
- 2019
- 2018
- 2017
- 2016
- 2015
- 2014
- December (13)
- November (2)
- October (5)
- September (2)
- August (8)
- July (9)
- June (7)
- May (5)
- April (4)
- March (4)
- February (1)
- January (2)
- 2013
- December (2)
- November (8)
- October (5)
- September (12)
- August (5)
- July (2)
- June (3)
- May (4)
- April (8)
- March (10)
- February (9)
- January (11)
- 2012
- 2011
- October (1)
- My blog
- Post new blog entry
- All blogs
Run-11 Transverse Jets: PYTHIA vs. NLO (part IV)
Renee has suggested it would be good to get a scan of samples with a few different primordial kT values. I have produced "high statistics" samples in bins of partonic pT with primordial kT of 2, 1.5, 1, and 0.5 GeV/c. For each I have calculated independent sets of fudge factors utilizing the fit function developed for the embedding sample:
- For partonic pT < 35 GeV/c: c0 / pTc1
- For partonic pT > 35 GeV/c: c0×exp(c1×pT)
The fudge factors are calculated such that the 75-∞ GeV/c bin is defined to be unity. My expectation would be that the fudge factors should be independent of primordial kT.
Figure 1
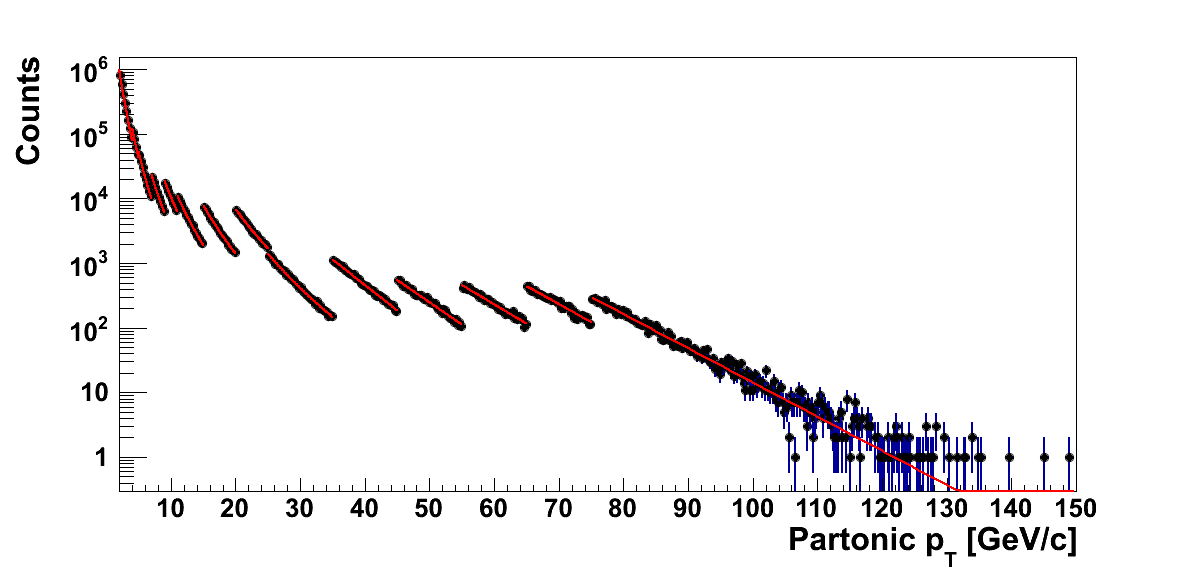
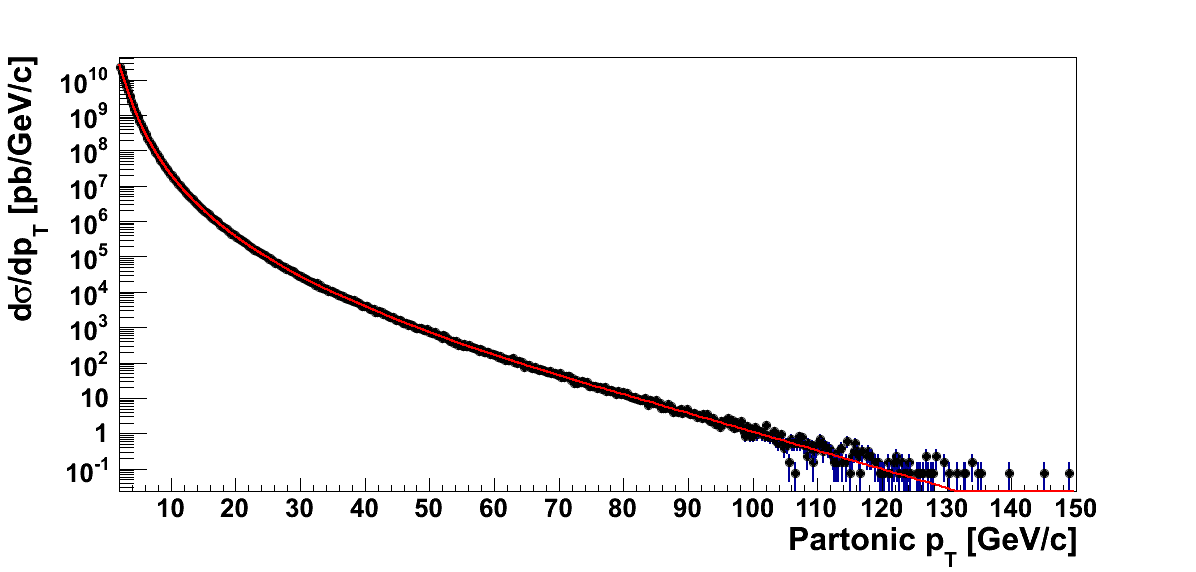
In Fig. 1 I show the kT = 2 GeV/c partonic pT spectra before reweighting and after reweighting. In each case, I show the results for the fits to individual bins of partonic pT. For the reweighted spectra I have corrected for the generated luminosities, applied the fudge factors, and factored out the pT bin width.
Table 1: Fudge Factors
| pT Bin [GeV/c] | kT = 2 GeV/c | kT = 1.5 GeV/c | kT = 1 GeV/c | kT = 0.5 GeV/c |
| 2-3 | 0.551 | 0.564 | 0.541 | 0.668 |
| 3-4 | 0.805 | 0.825 | 0.789 | 0.972 |
| 4-5 | 0.912 | 0.935 | 0.895 | 1.095 |
| 5-7 | 0.949 | 0.971 | 0.932 | 1.142 |
| 7-9 | 0.978 | 0.998 | 0.963 | 1.187 |
| 9-11 | 0.992 | 0.999 | 0.987 | 1.203 |
| 11-15 | 0.999 | 0.997 | 1.012 | 1.210 |
| 15-20 | 1.023 | 1.006 | 1.039 | 1.216 |
| 20-25 | 1.036 | 1.035 | 1.049 | 1.211 |
| 25-35 | 1.028 | 1.049 | 1.035 | 1.201 |
| 35-45 | 1.052 | 1.072 | 1.053 | 1.214 |
| 45-55 | 1.029 | 1.040 | 0.994 | 1.142 |
| 55-65 | 1.000 | 1.014 | 0.986 | 1.053 |
| 65-75 | 1.017 | 0.987 | 0.986 | 1.004 |
| 75-∞ | 1 | 1 | 1 | 1 |
In Table 1 I post the fudge factors calculated for the various samples and bins of partonic pT. For primordial kT between 1 and 2 GeV/c, the numbers are fairly consistent, very slowly decreasing as one moves lower in partonic pT before dipping for the lowest bins. In the kT = 0.5 sample, the trend is a bit different, rising to about 1.2 by moderate partonic pT before tapering low at low partinic pT. It is not clear to me this is sensible. Thus, for the following, I utilize the fudge factors calculated for the particular bins, save the kT = 0.5 GeV/c sample, where I also utilize those calculated for the kT = 1 GeV/c sample.
Figure 2
| kT = 2 GeV/c | kT = 1.5 GeV/c |
 |
 |
| kT = 1 GeV/c | kT = 0.5 GeV/c |
 |
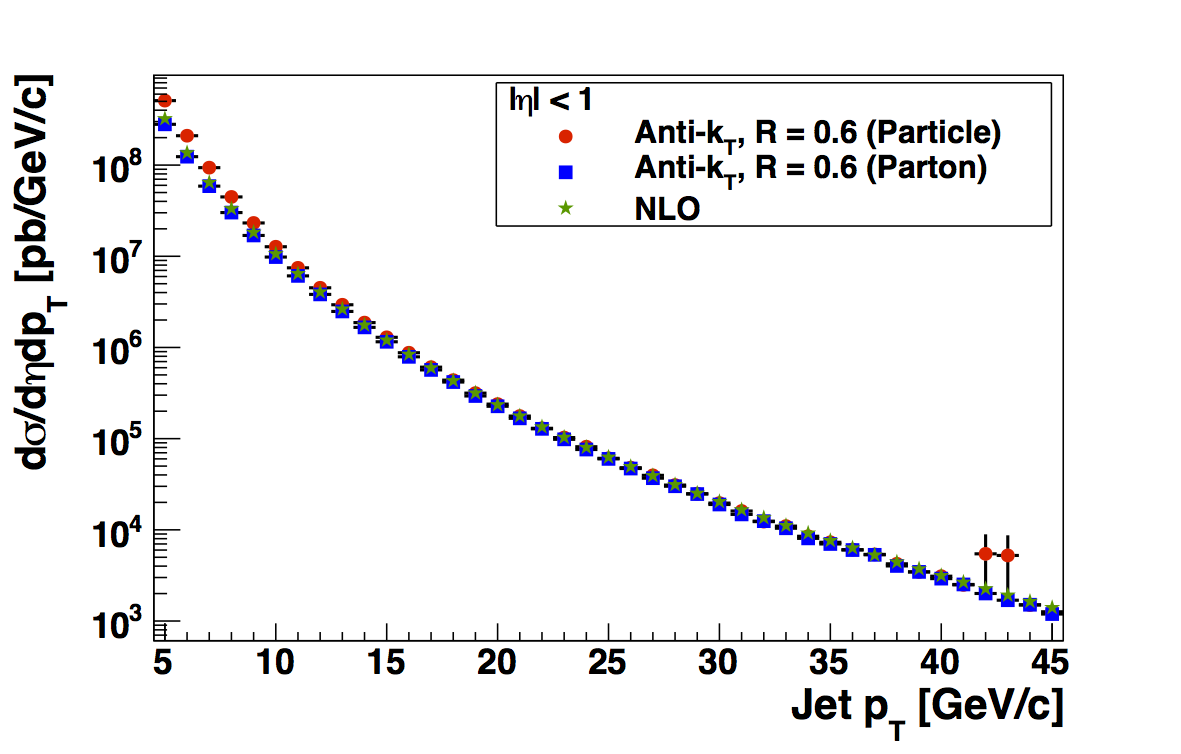 |
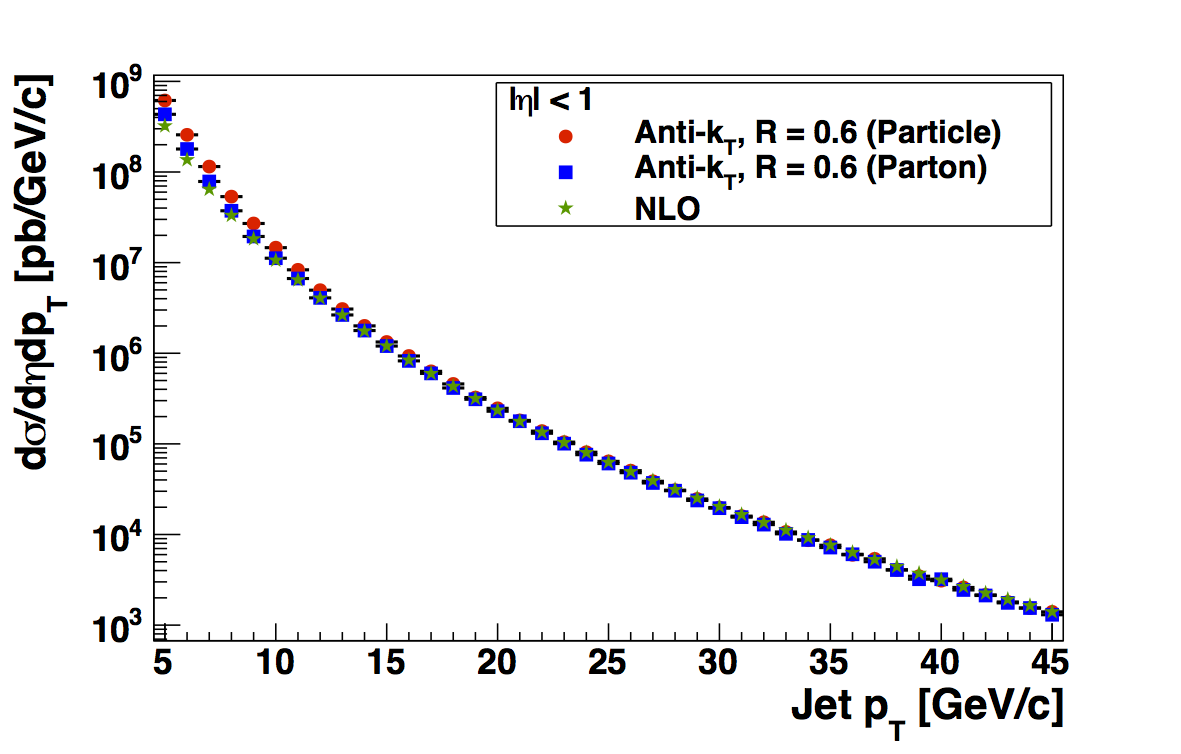
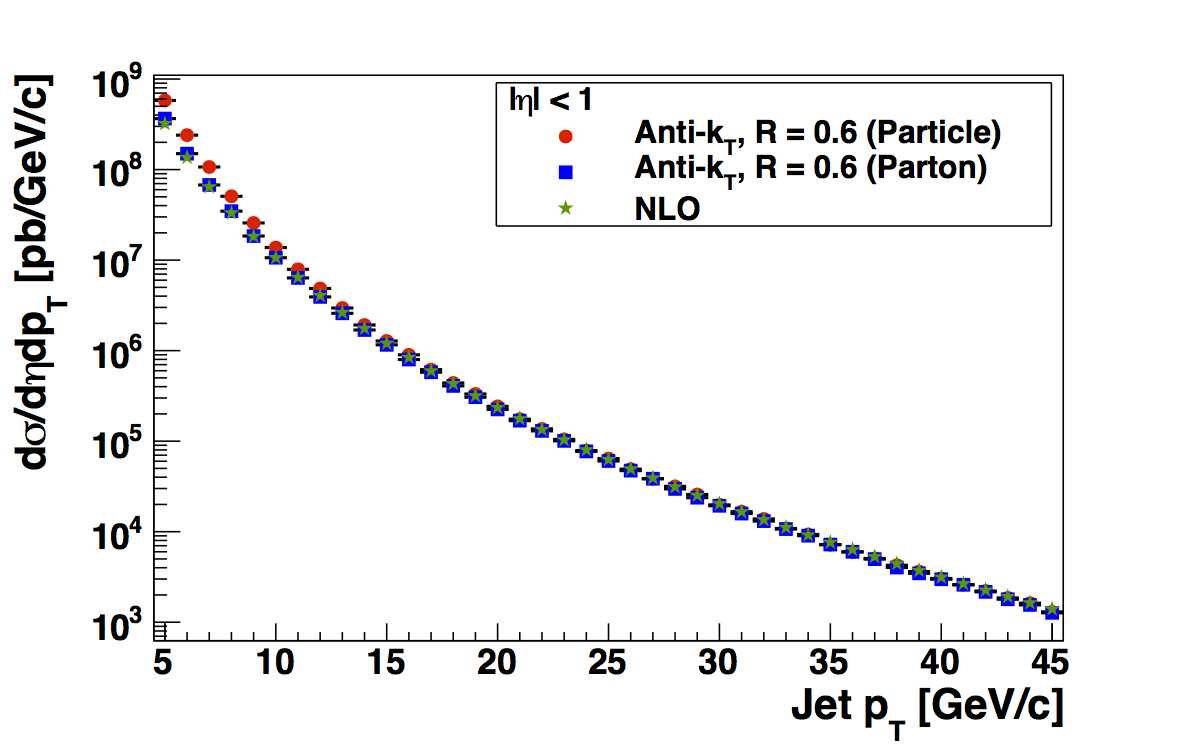
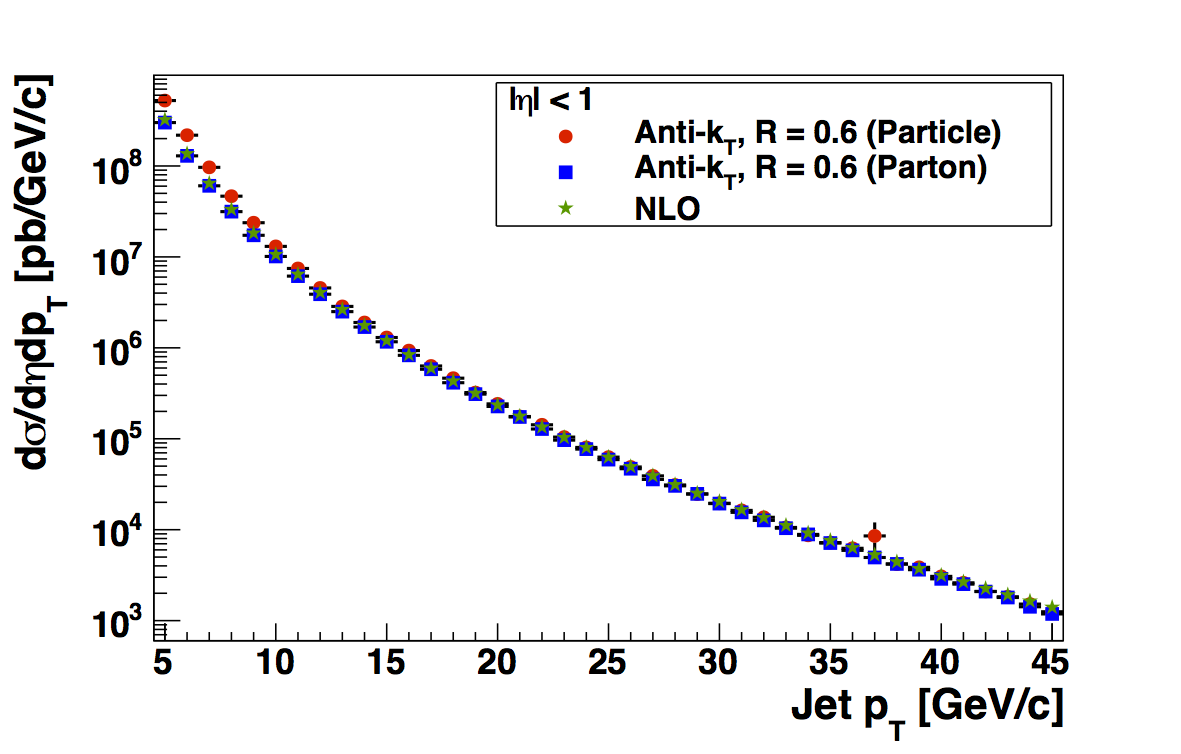
In Fig. 1 I overlay the parton jet and particle jet cross sections from PYTHIA with the jet cross section from NLO pQCD, as calcualted by Zilong. The cross section is calculated across a consistent bin width from that of the data and plotted at the bin center, as are the data. Thus, L-W issues should be completely removed. In this case, I have used the kT = 1 GeV/c fudge factors for both the kT = 1 GeV/c and kT = 0.5 GeV/c samples. One can see that in general the shapes match quite well at high jet pT. At low pT, particle jets are enhanced relative to parton jets and NLO.
Figure 3
| kT = 2 GeV/c | kT = 1.5 GeV/c |
 |
 |
| kT = 1 GeV/c | kT = 0.5 GeV/c |
 |
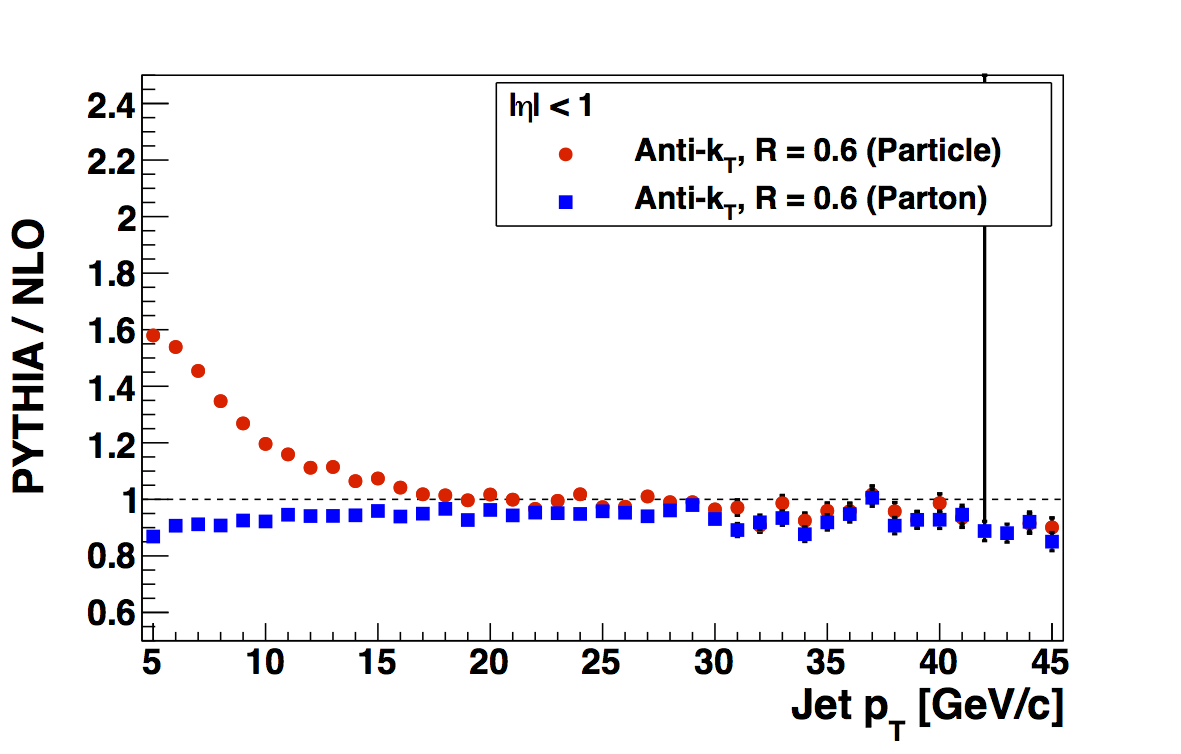 |
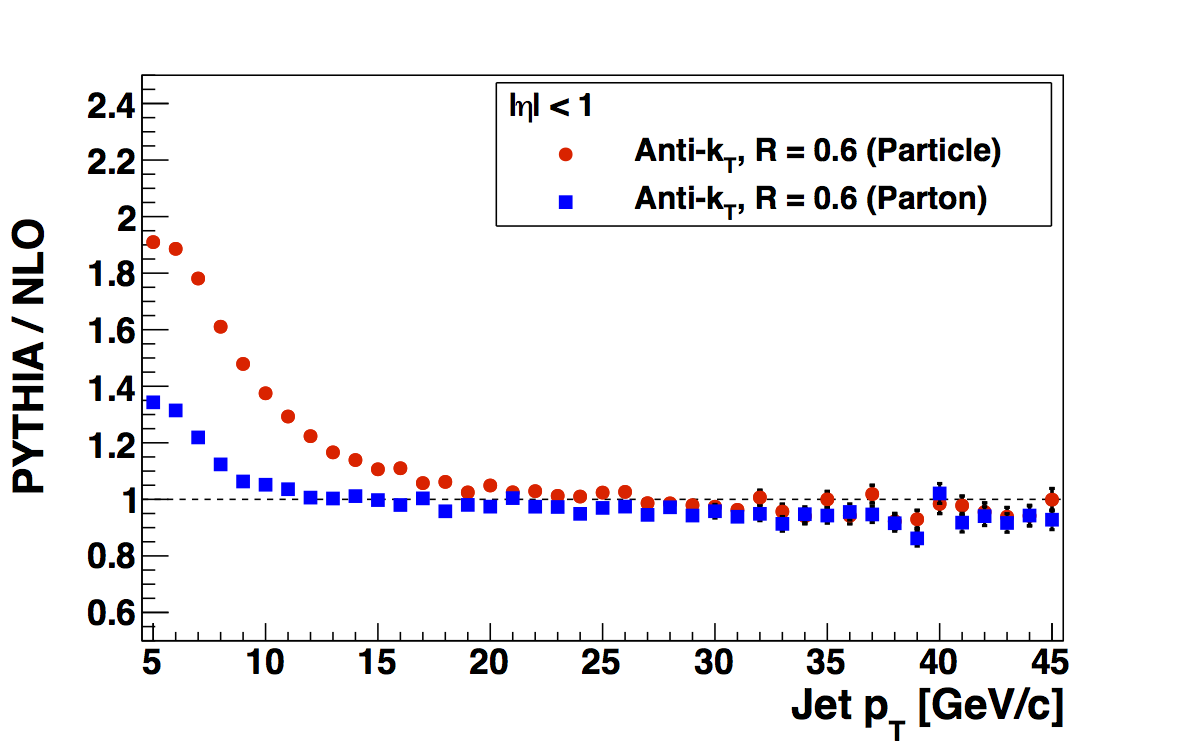
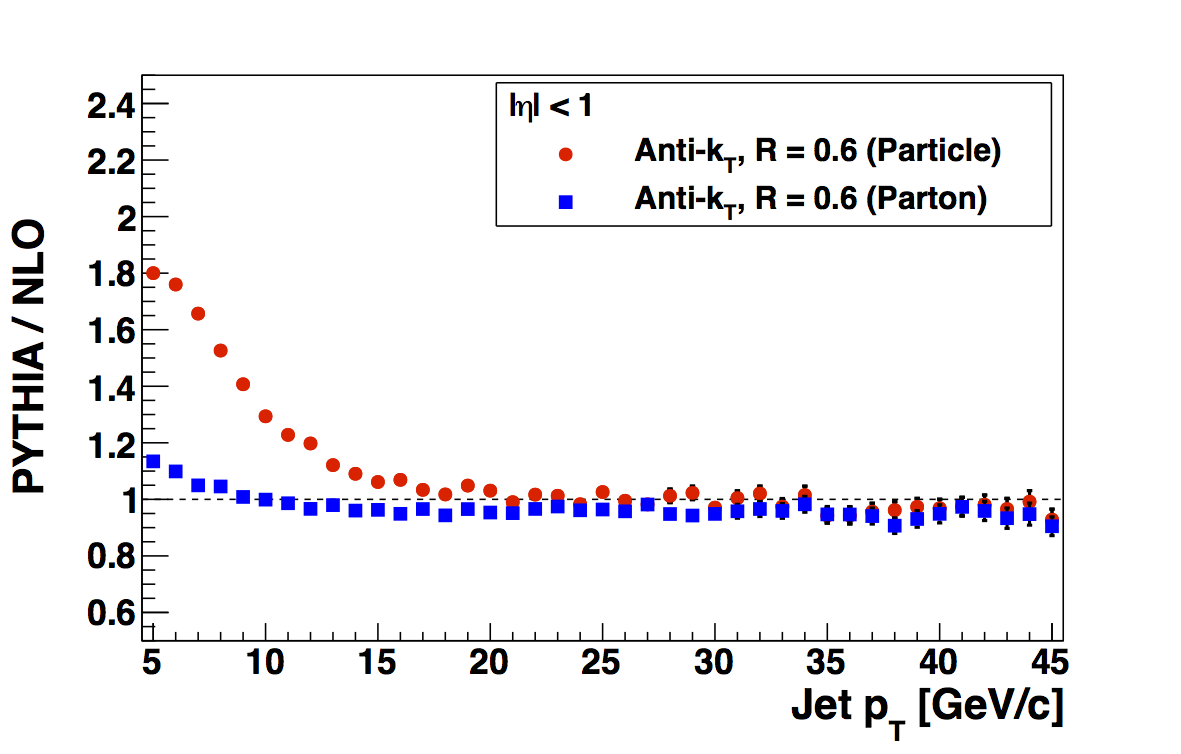
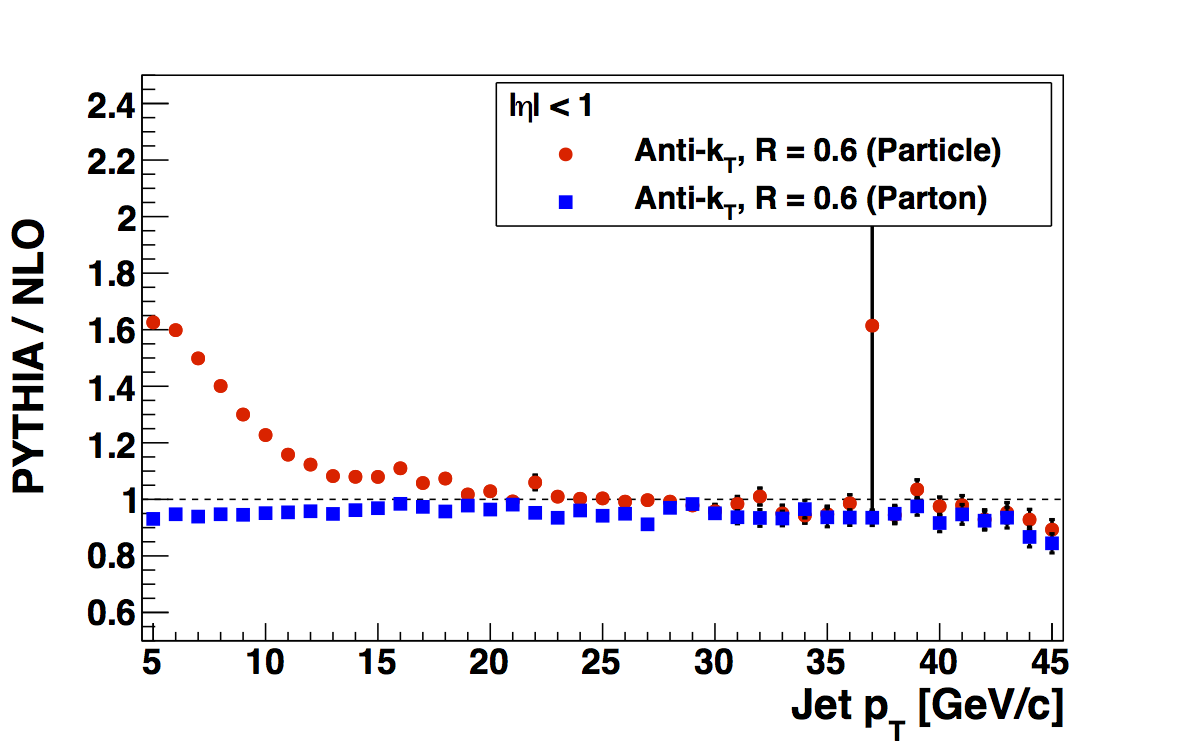
In Fig. 3 I show the ratios of PYTHIA to NLO pQCD for the different samples of primordial kT. Again, I use the kT = 1 GeV/c fudge factors for both kT = 1 GeV/c and kT = 0.5 GeV/c samples. One can much more clearly see a divergence from NLO for both particle jets and parton jets for kT = 2 and 1.5 GeV/c. For the kT = 1 samples the parton jet cross section is rather close to NLO pQCD, while the kT = 0.5 GeV/c sample appears to undershoot NLO. In all cases, the particle jet cross sections are enhanced relative to NLO at low jet pT. This is qualitatively quite similar to that observed by Pibero in the 200 GeV PYTHIA sample. If it is indeed real, this could account for a portion of the low-pT JP0 enhancement relative to the data I see in the embedding and possibly also the high-pT divergence seen for several years, now, in both 200 and 500 GeV.
Figure 4
| kT = 0.5 GeV/c with kT = 0.5 GeV/c FFs | kT = 0.5 GeV/c with kT = 1 GeV/c FFs |
 |
 |
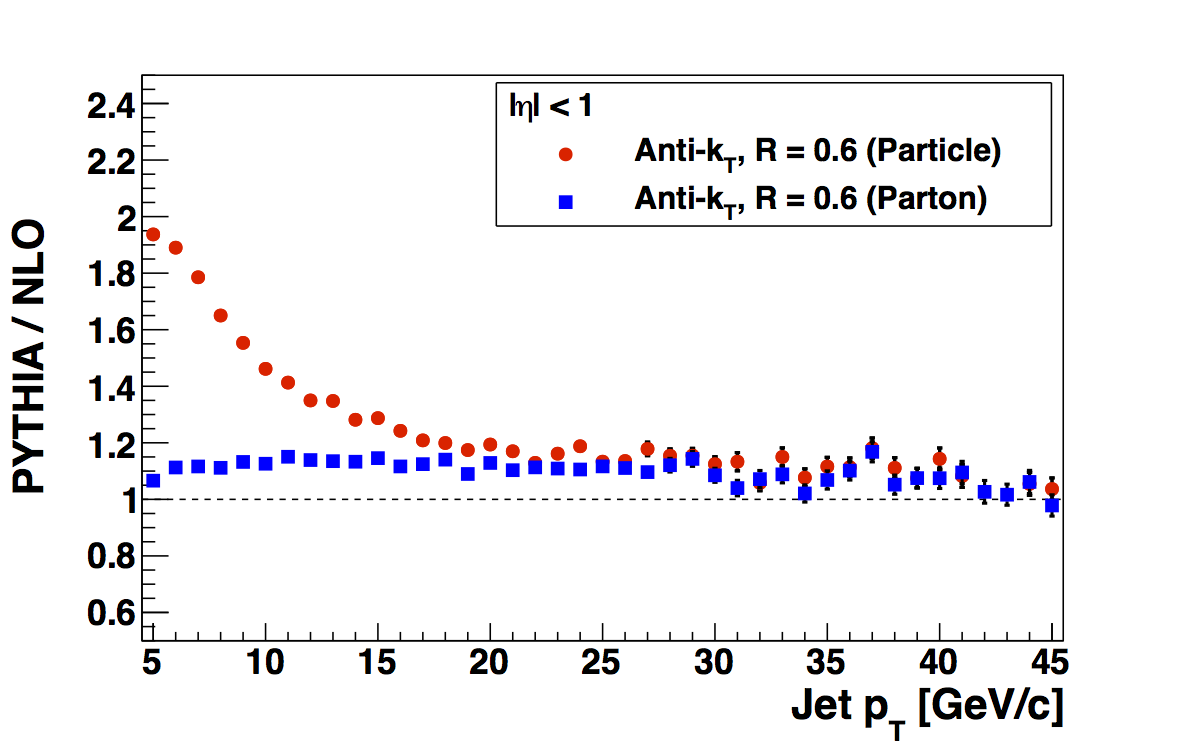
In Fig. 4 I compare PYTHIA/NLO for the kT = 0.5 GeV/c sample using the independently calculated FFs for the kT = 0.5 GeV/c sample vs. using those of the kT = 1 GeV/c sample. The shapes are qualitatively similar, e.g., low-pT enhancement for particle jets. Using the 0.5 GeV FFs there appears to be a vertical offset ~+10% and a bit of an enhancement in the low-pT, particle-jet divergence relative to the 1 GeV/c FF sample. The 1 GeV/c FF sample seems more consistent with the big picture in Fig. 3, thus, I am inclined to believe the 1 GeV/c FFs are more realistic. This opinion should be taken with a heaping tablespoon of salt.
Table 2: kT = 2 GeV/c Fudge Factors for Different Fit Functions
| pT Bin [GeV/c] | Mine | Pibero's | % Diff | χ2/ν (Mine) | χ2/ν (Pibero's) | Probability (Mine) | Probability (Pibero's) |
| 2-3 | 0.551 | 0.626 | 12.7 | 389.16/2 | 0.164/0 | 3.12e-85 | N/A |
| 3-4 | 0.805 | 0.893 | 10.5 | 39.91/2 | 0.0360/0 | 2.15e-9 | N/A |
| 4-5 | 0.912 | 1.003 | 9.50 | 14.76/2 | 2.02/0 | 6.23e-4 | N/A |
| 5-7 | 0.949 | 1.040 | 9.18 | 20.47/6 | 6.20/4 | 2.28e-3 | 0.185 |
| 7-9 | 0.978 | 1.090 | 10.8 | 6.68/6 | 17.57/4 | 0.352 | 1.495e-3 |
| 9-11 | 0.992 | 1.037 | 4.46 | 5.82/6 | 5.65/4 | 0.444 | 0.227 |
| 11-15 | 0.999 | 1.058 | 5.69 | 21.28/14 | 19.53/12 | 0.0947 | 0.0766 |
| 15-20 | 1.023 | 1.076 | 4.98 | 31.75/18 | 30.98/16 | 0.0236 | 0.0135 |
| 20-25 | 1.036 | 1.082 | 4.32 | 30.62/18 | 29.79/16 | 0.0318 | 0.0191 |
| 25-35 | 1.028 | 1.098 | 6.53 | 35.05/38 | 33.68/36 | 0.607 | 0.580 |
| 35-45 | 1.052 | 1.097 | 4.22 | 24.04/38 | 24.03/36 | 0.962 | 0.936 |
| 45-55 | 1.029 | 1.091 | 5.80 | 31.66/38 | 30.45/36 | 0.756 | 0.730 |
| 55-65 | 1.000 | 1.032 | 3.14 | 35.73/38 | 35.59/36 | 0.575 | 0.488 |
| 65-75 | 1.017 | 1.064 | 4.59 | 43.82/38 | 41.87/36 | 0.238 | 0.231 |
| 75-∞ | 1 | 1 | 0 | 212.71/206 | 212.59/204 | 0.359 | 0.326 |
Pibero used a different fit function to calculate the fudge factors for the 200 GeV embedding. As a sanity check, I have also recalculated the fudge factors for the kT = 2 GeV/c sample using Pibero's fit function (exp(pol2)). A comparison is shown in Table 2. The fudge factors differ by ~10% from 2-9 GeV/c and ~5% for partonic pT > 9 GeV/c (save the highest bin defined to be 1). In general, my current fit procedure gives a better fit probability above 7 GeV/c. Below this, Pibero's fit function has more parameters so that for the current binning, the χ2 probability does not really apply. If I adopt a hybrid strategy of Pibero's function below 7 GeV/c and mine above, I find, in order of the low bins to high bins, the following new fudge factors: 0.585, 0.835, 0.937, and 0.973 (different by 6%, 3.7%, 2.8%, and 2.5% compared to my previous values). I conclude this will not make a qualitative difference from the current version.
- drach09's blog
- Login or register to post comments
