Barring the unforeseen, the last analysis task is to finalize the pion contamination estimate. My preference would be to treat this as a correction, but in order to do so, I need a more robust estimate than those existing. Previously, the nσ(π) distributions were fit with a three-Gaussian function. However, closer examination suggests that a three-Gaussian function may not be sufficient. Further, the fitted centroids, in particular, of the electron peak, are not nearly as stable as I would expect. I believe this is due to the comparably small electron peak shifting underneath the pion peak. The proceeding study looks at both the raw fits as well as the dependence on pT to see if a reasonable trend is observed. This may allow a more accurate estimate of the background yields under the pion peak.
High pT
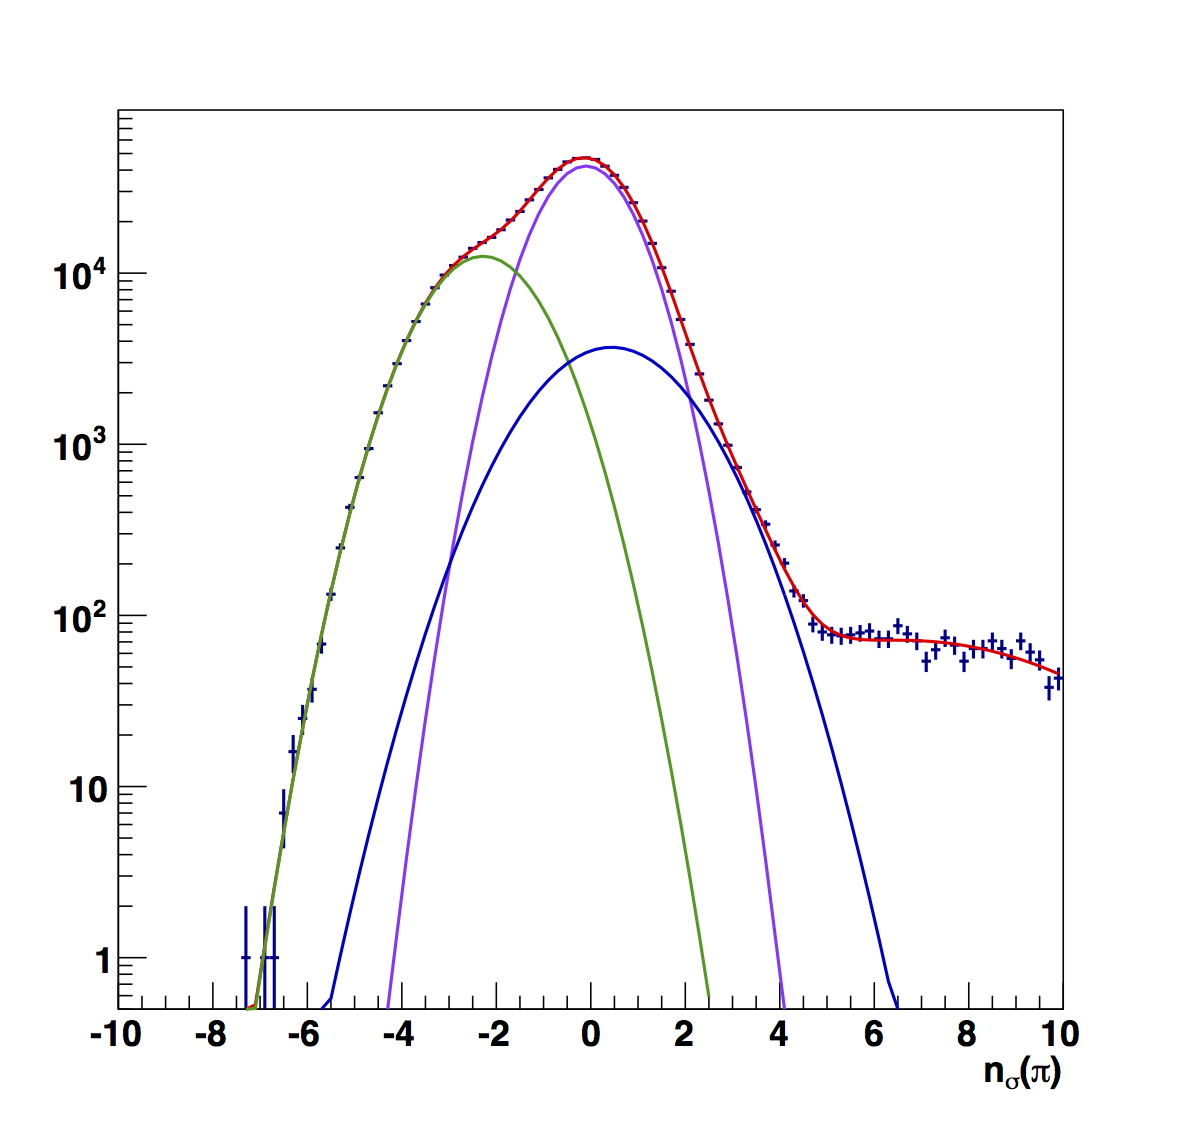
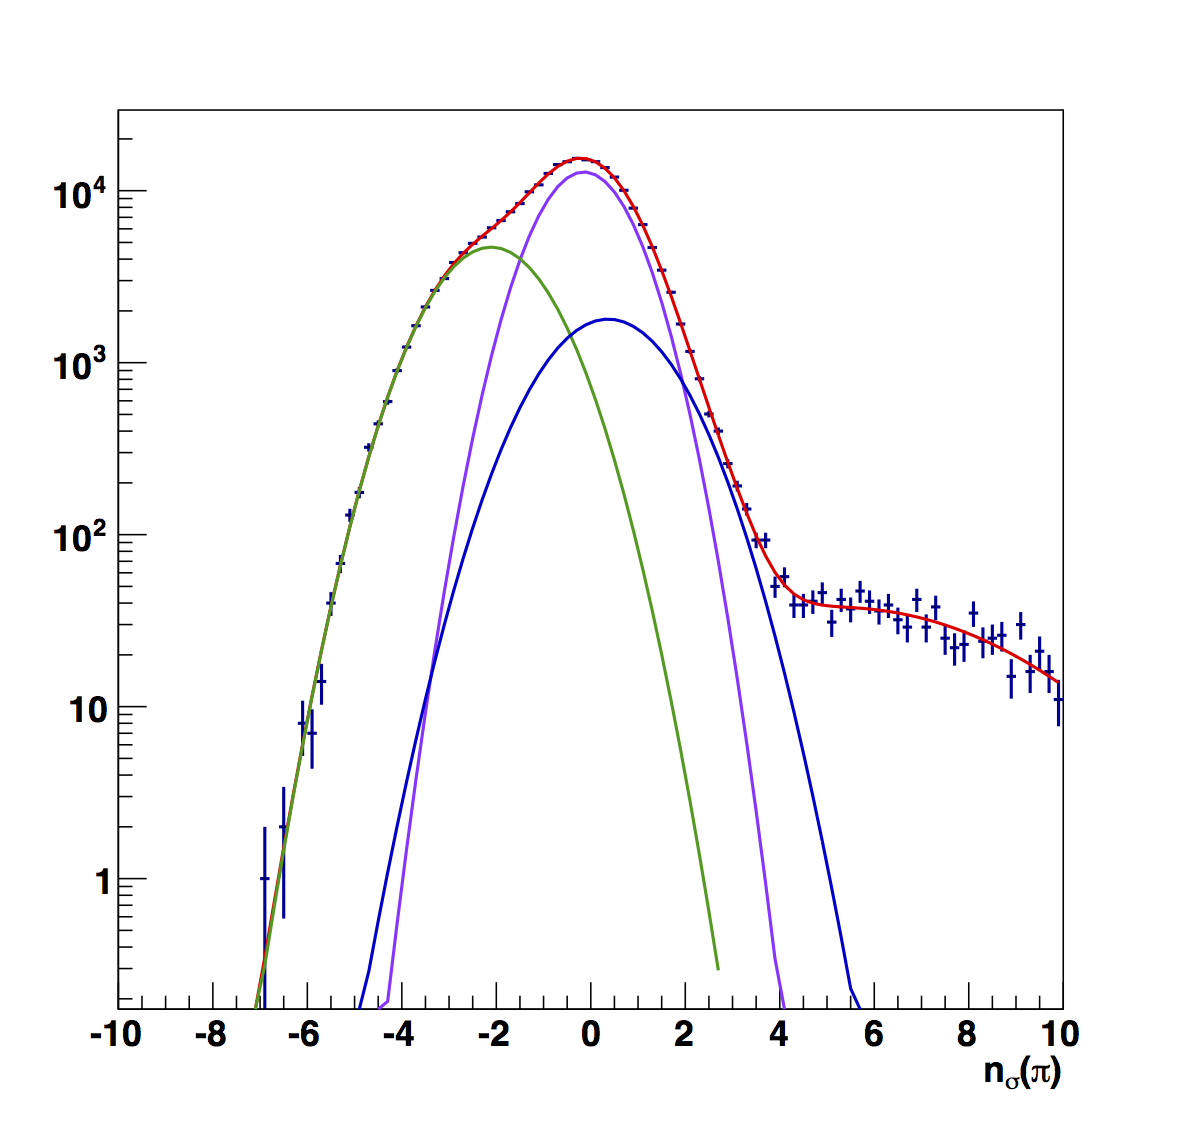
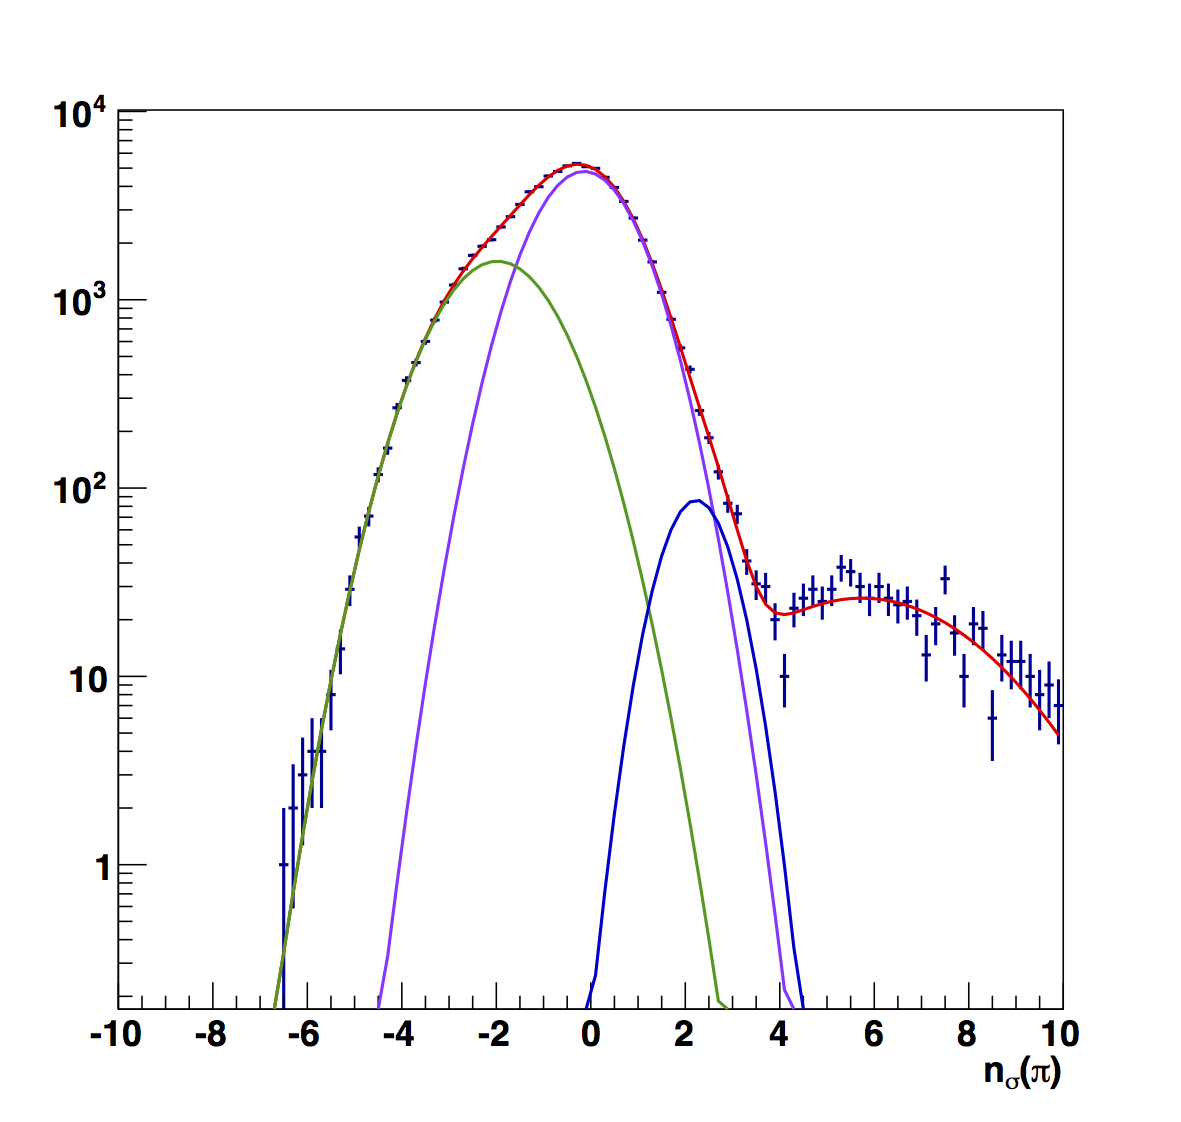
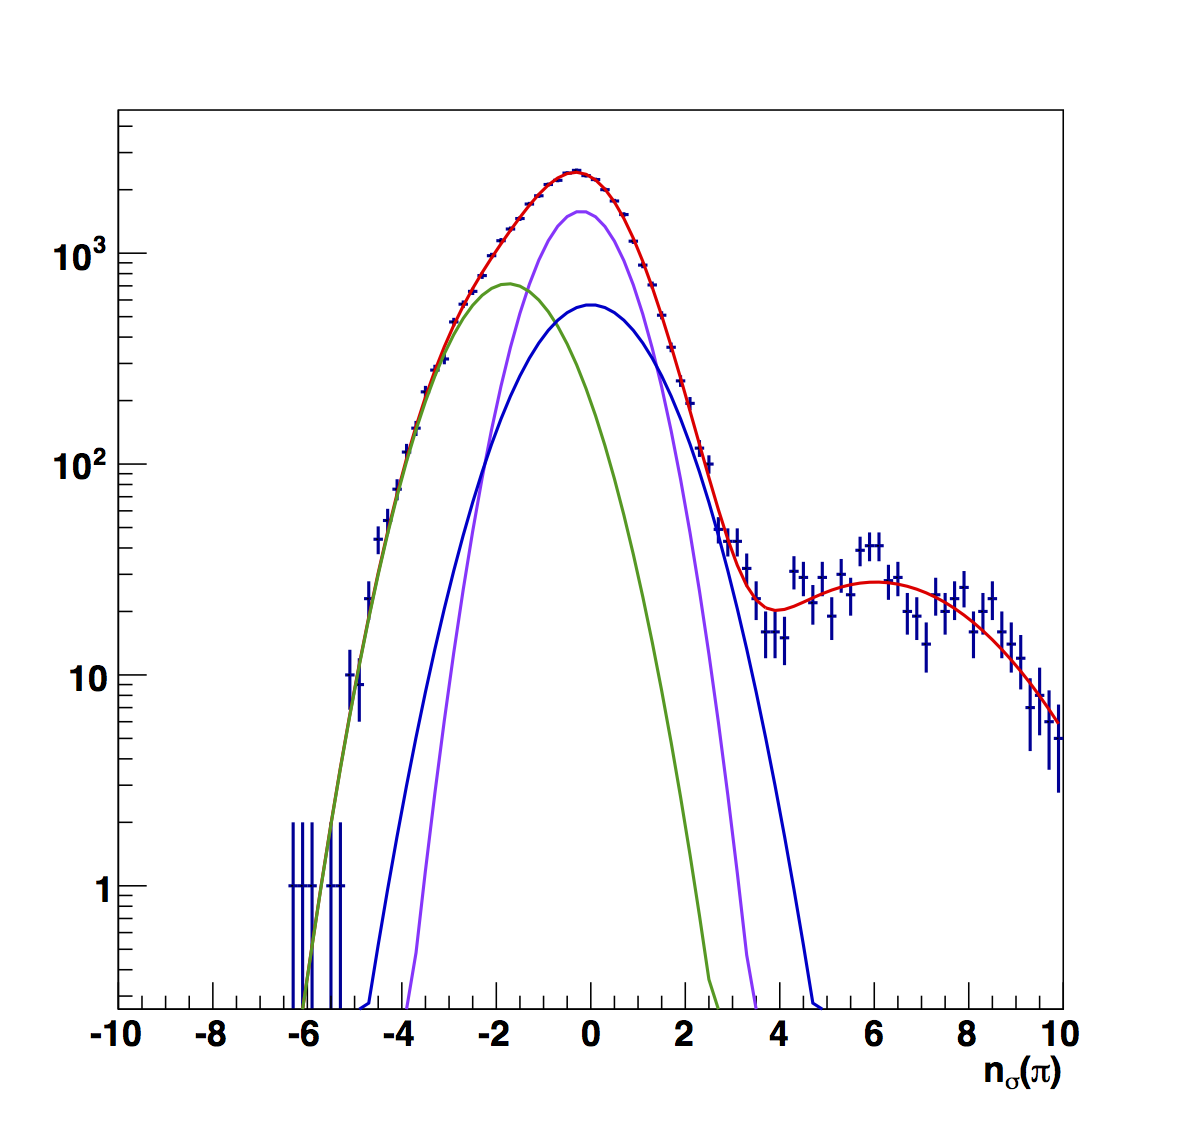
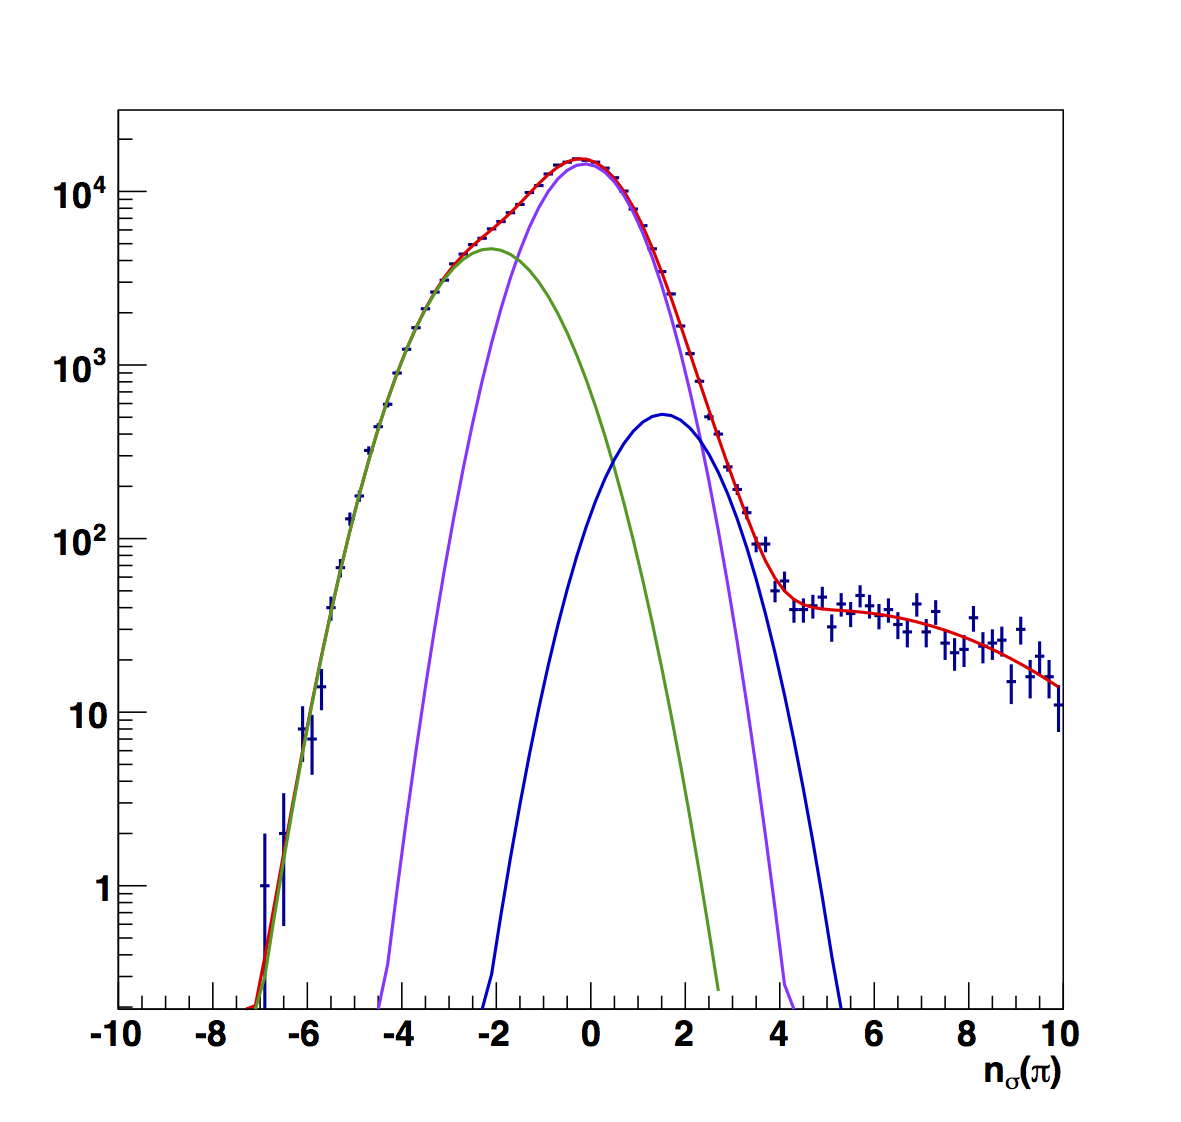
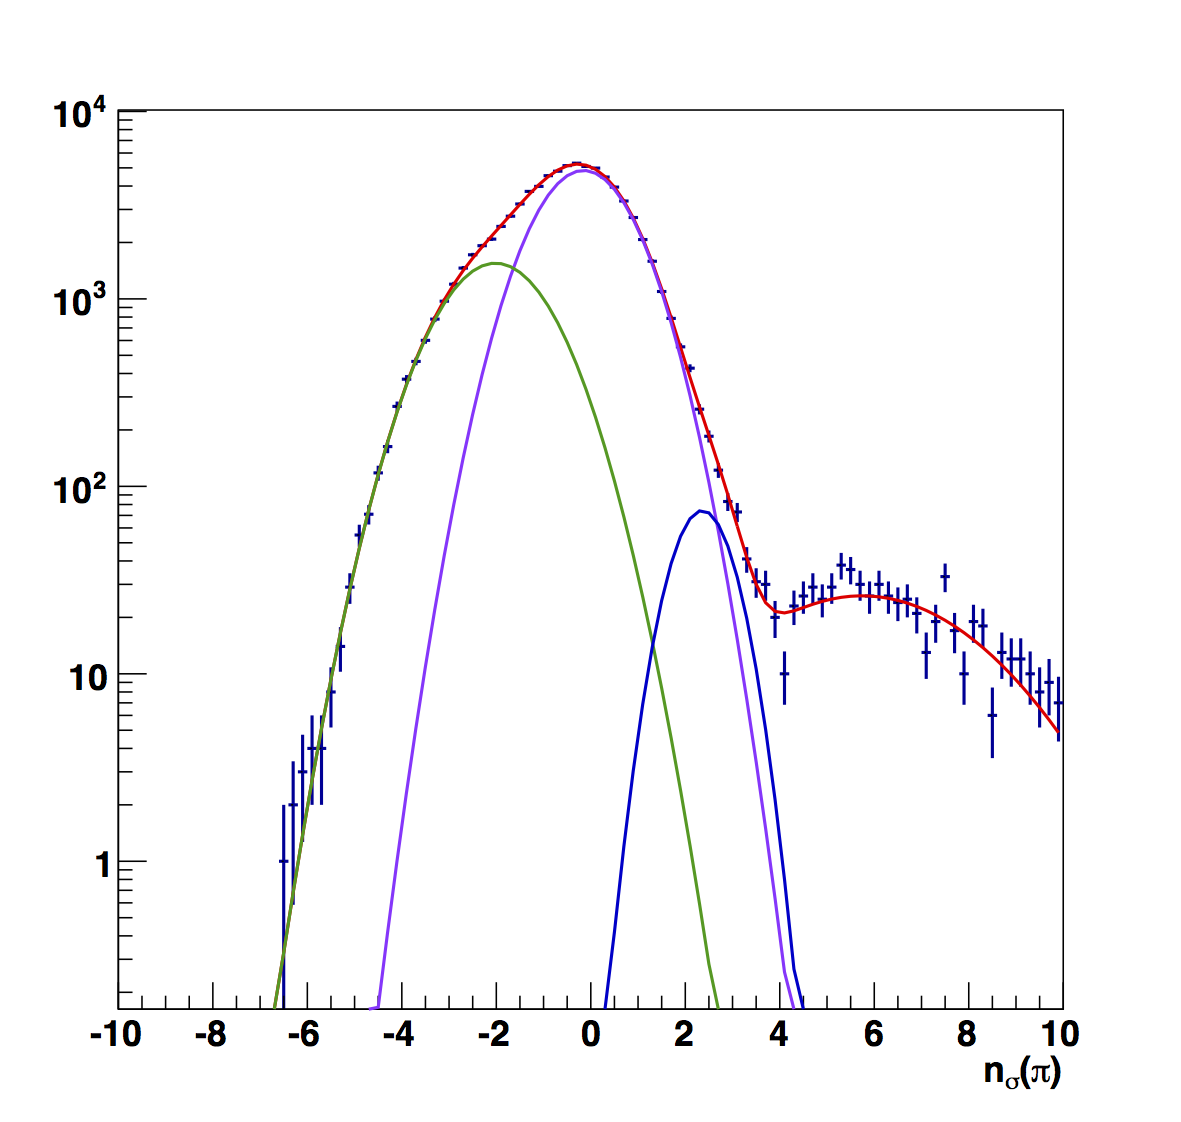
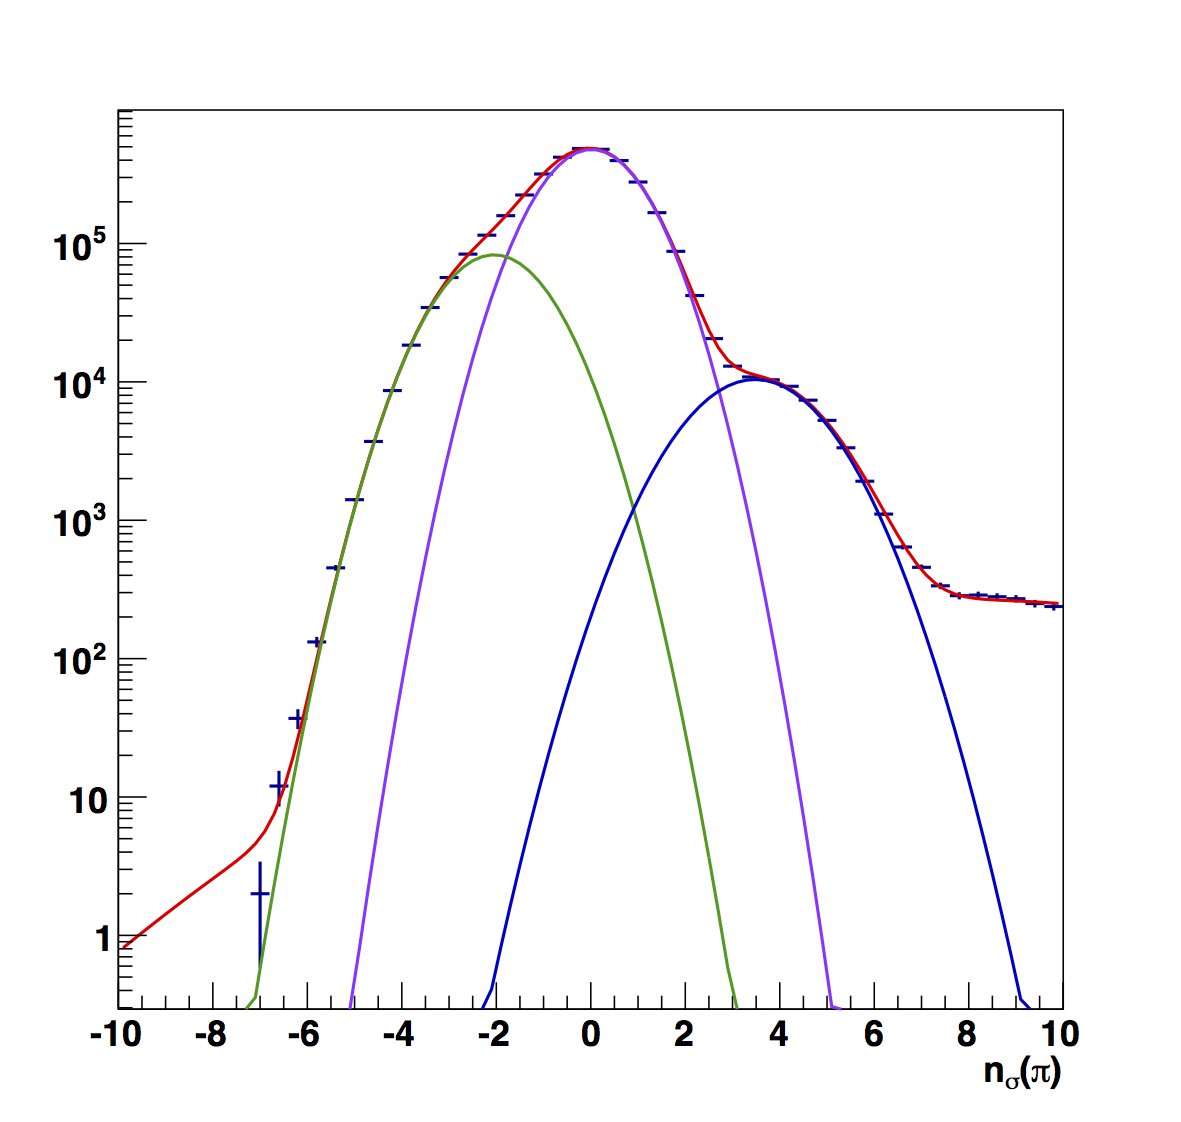
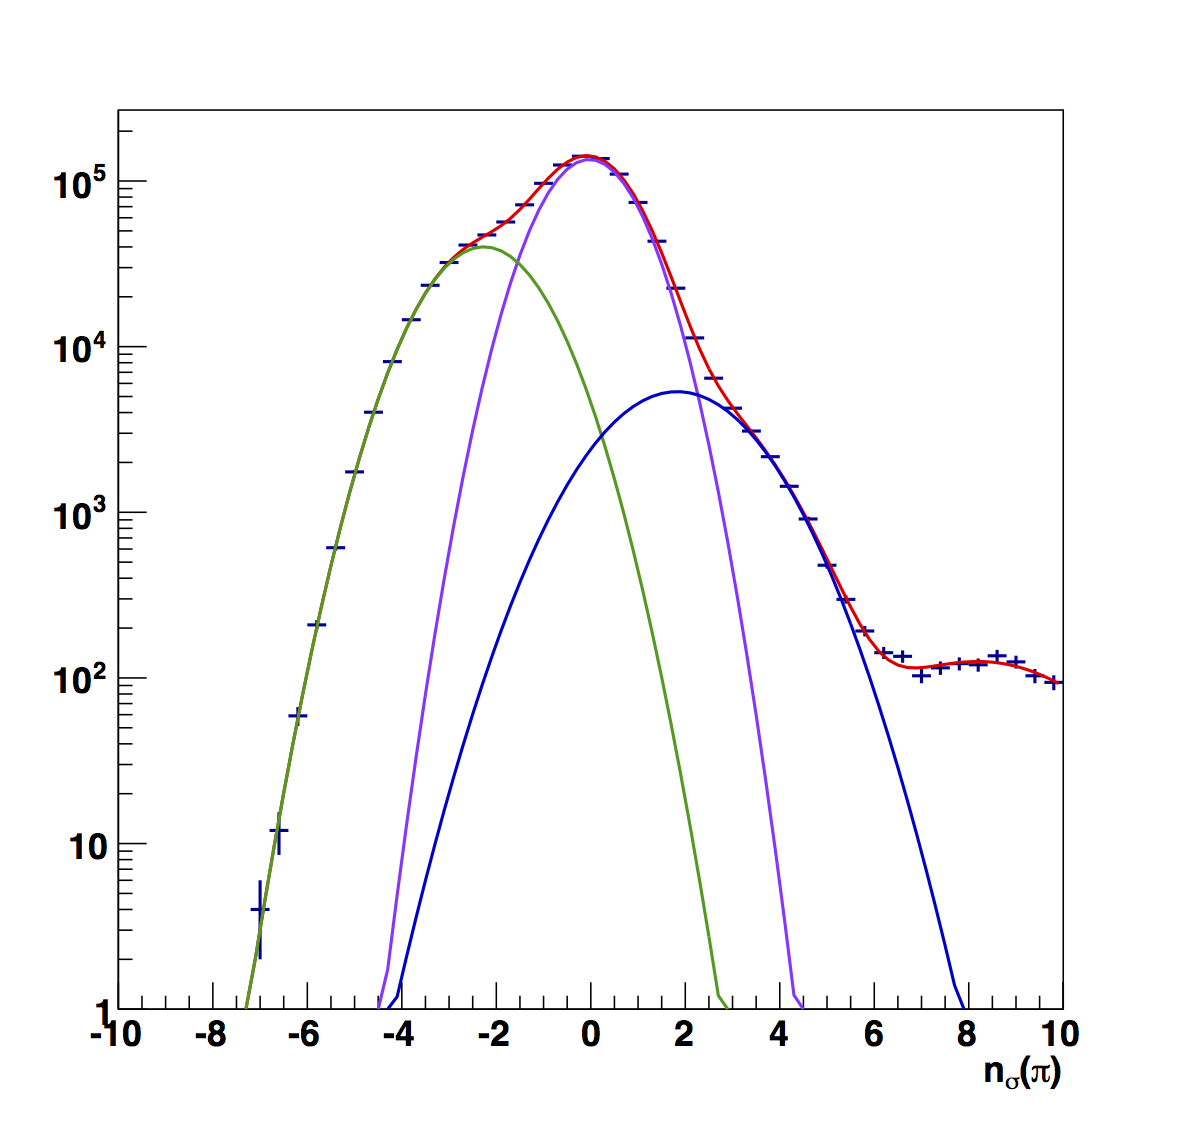
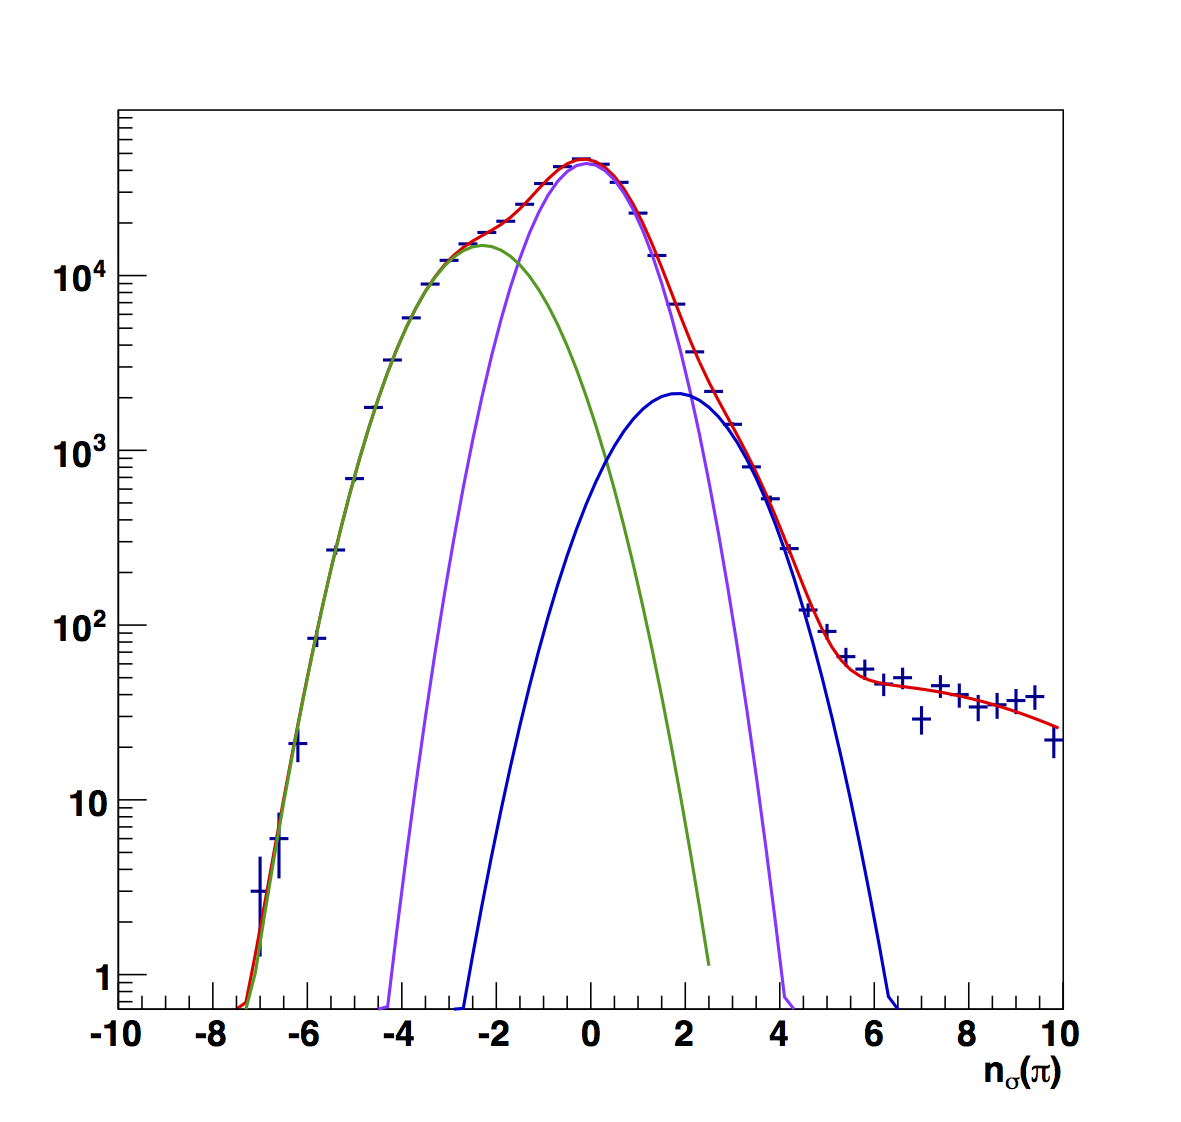
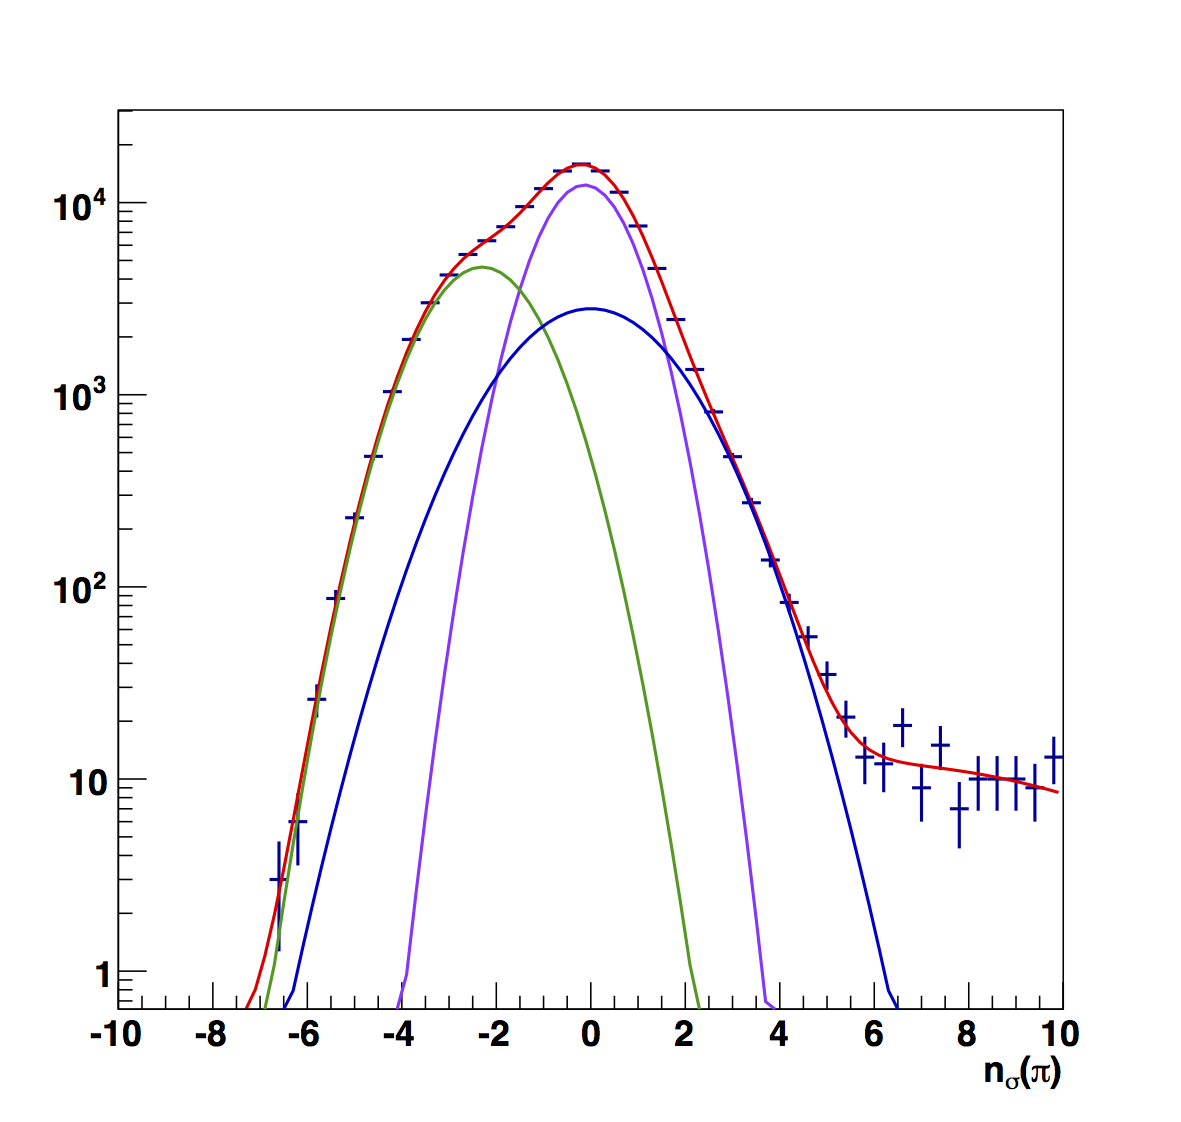
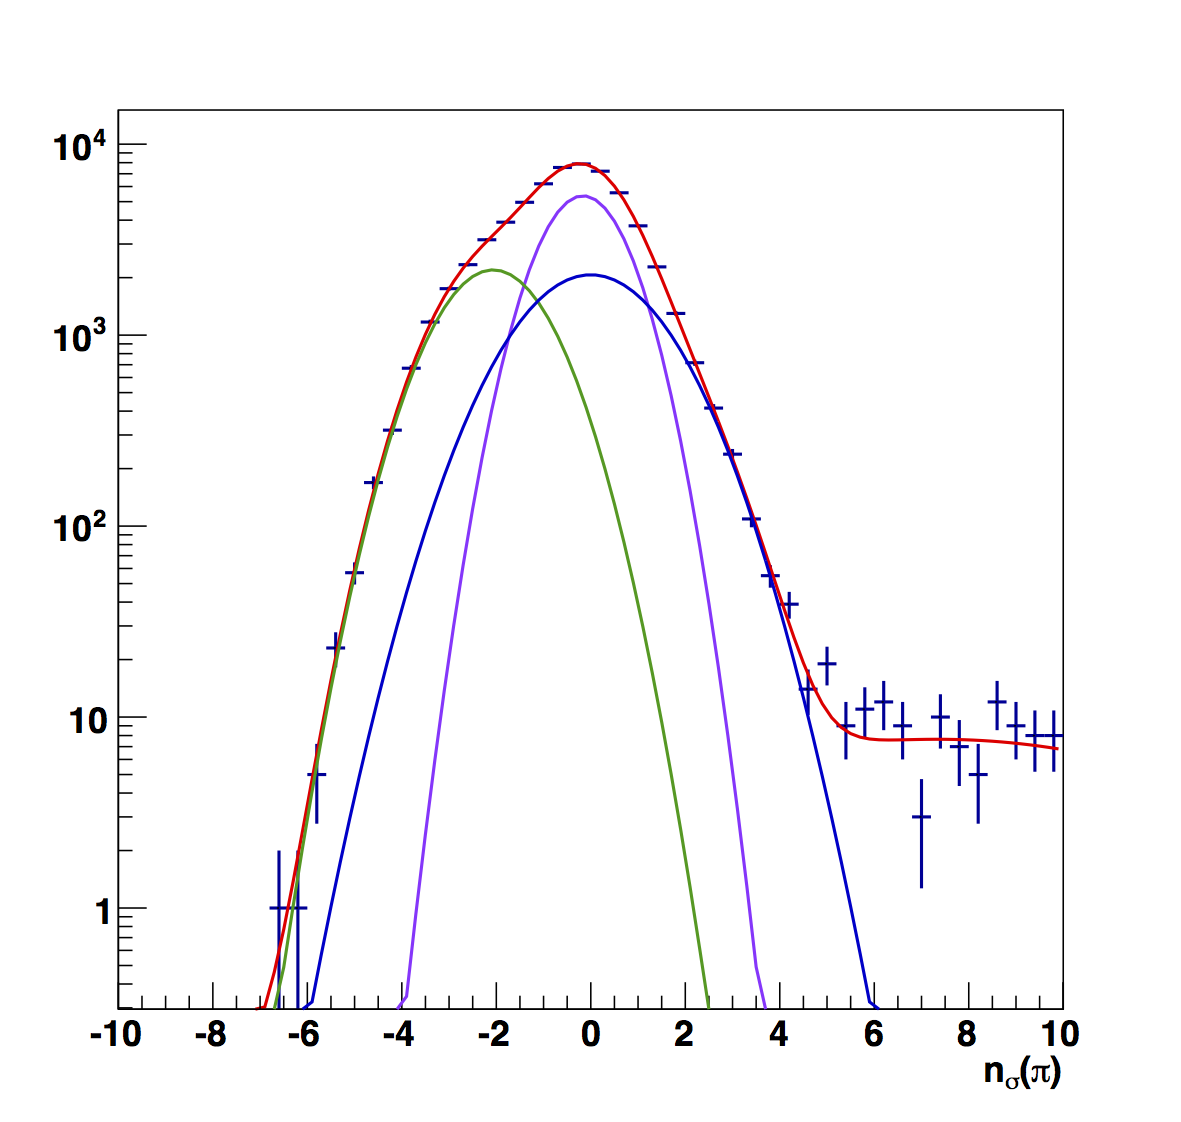
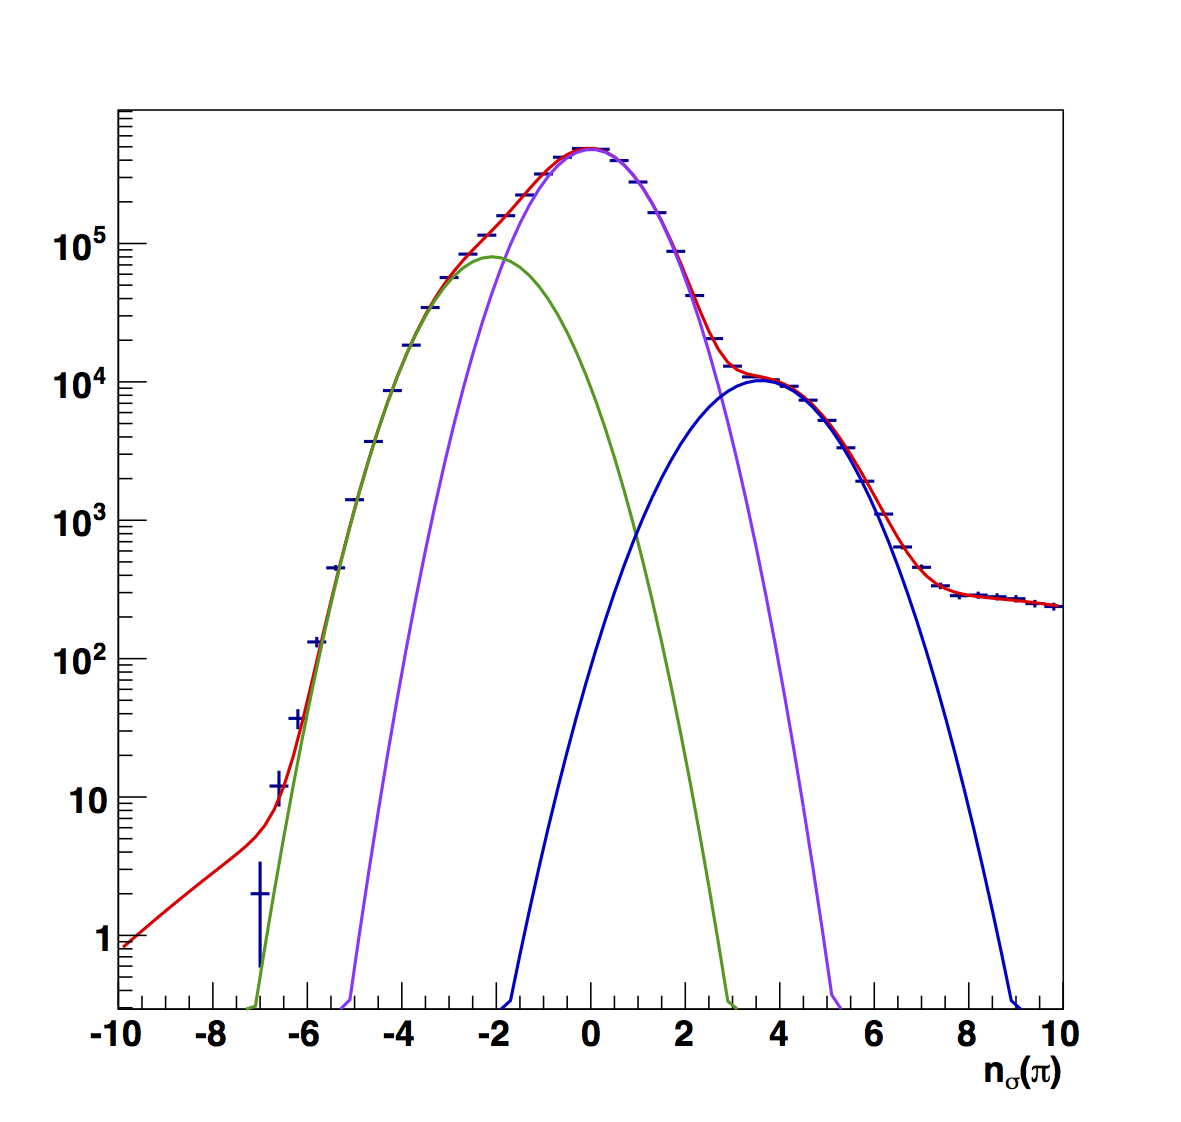
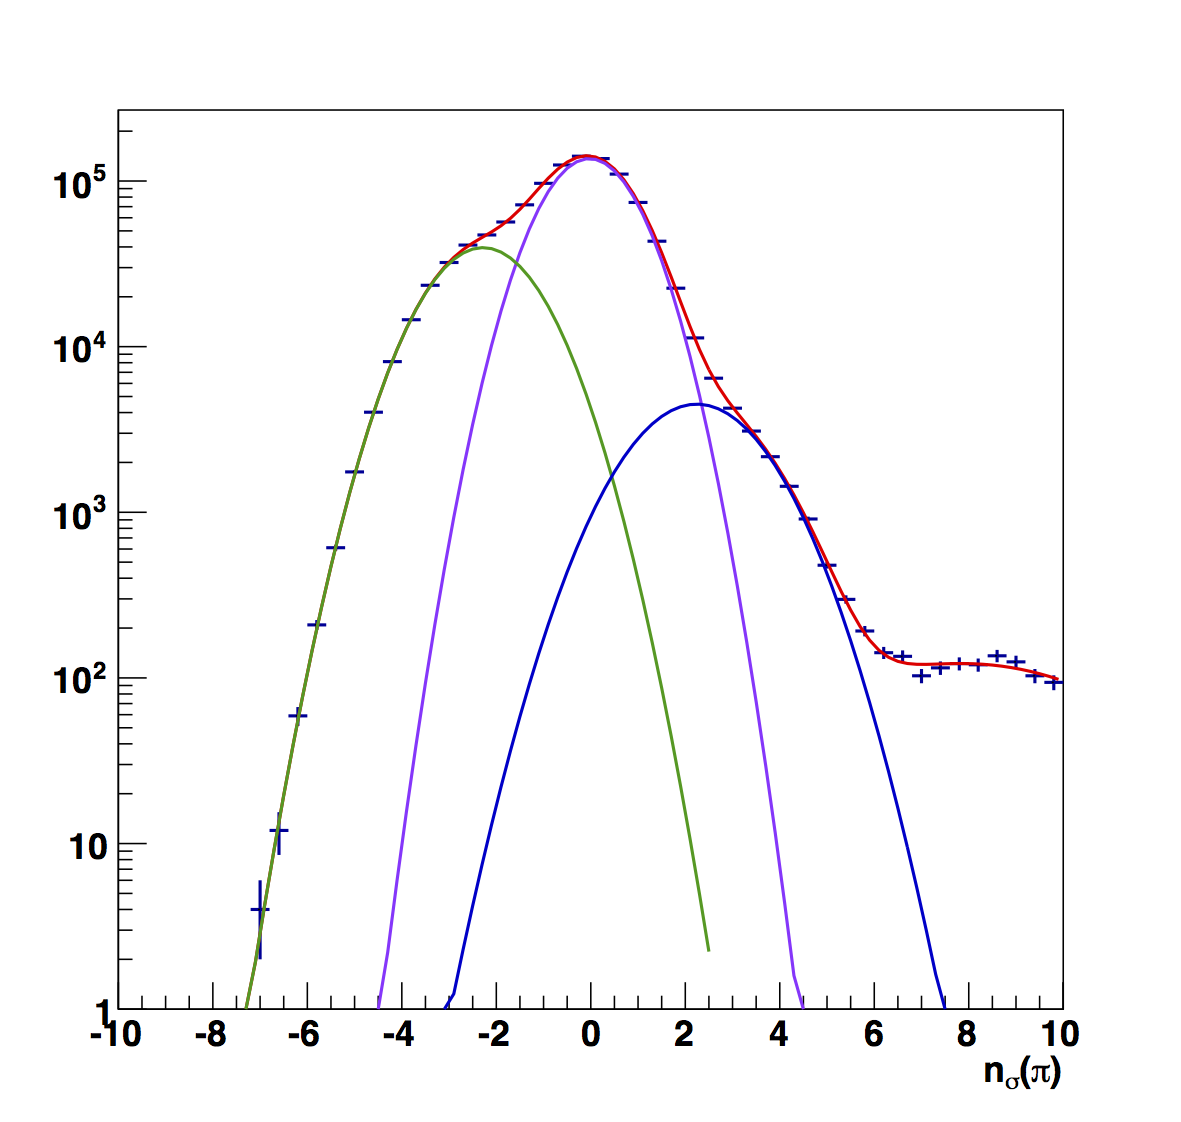
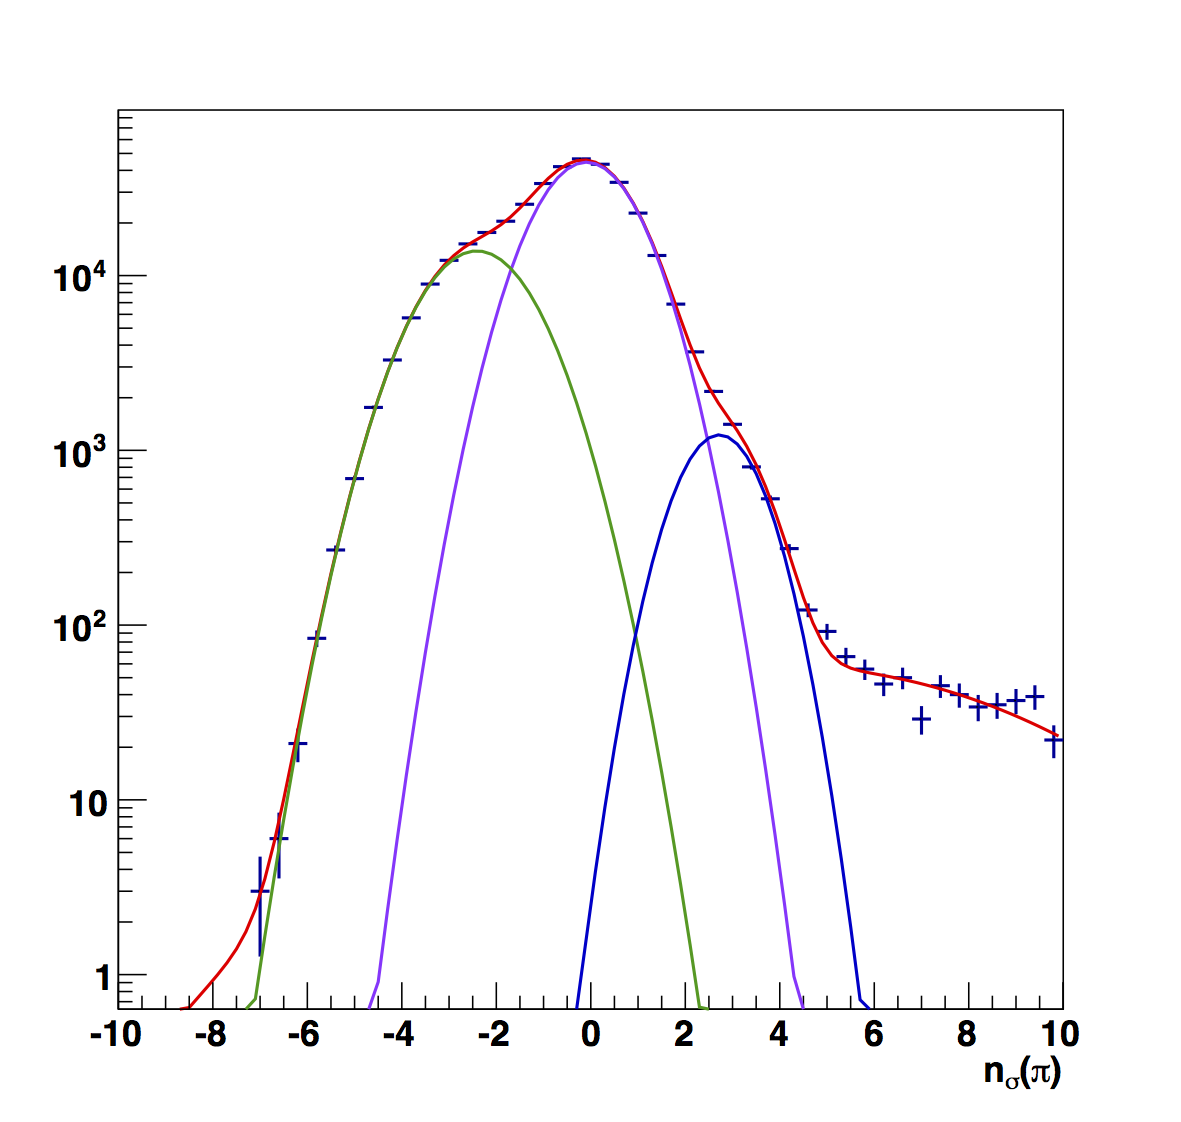
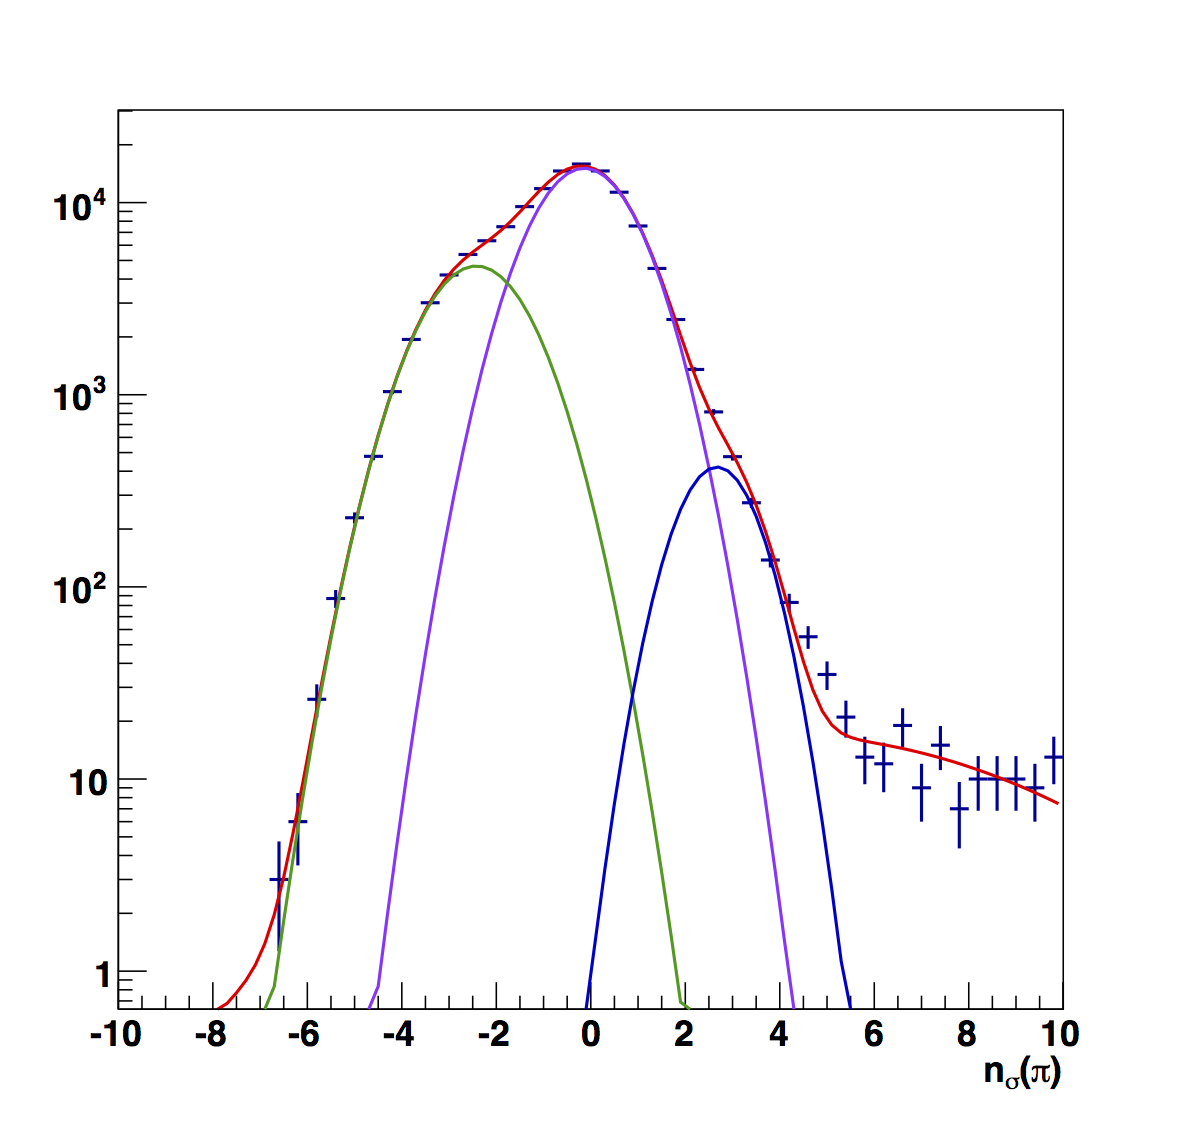
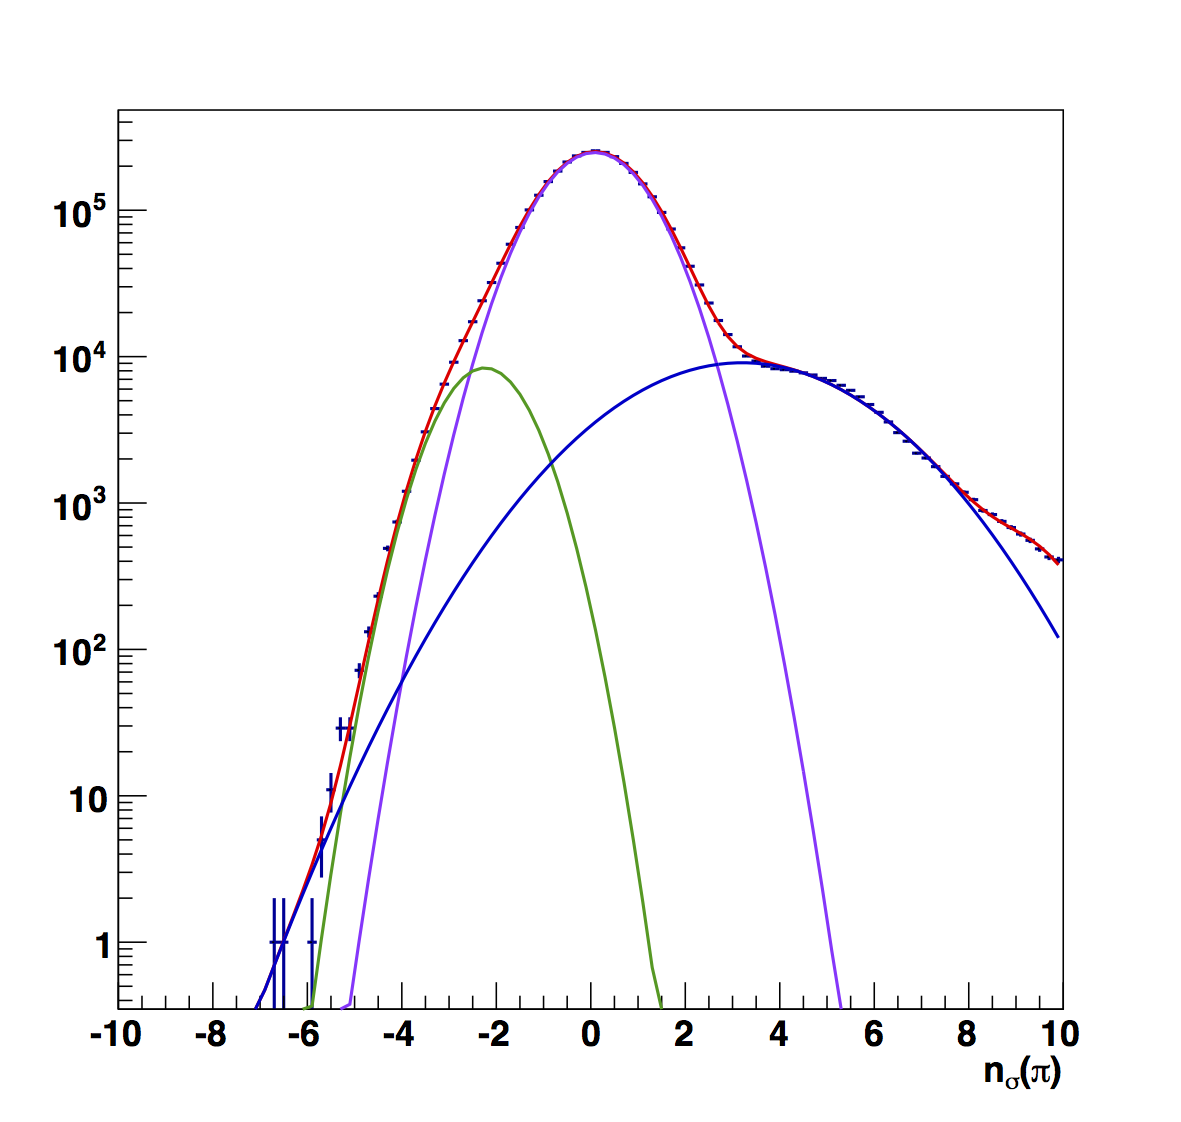
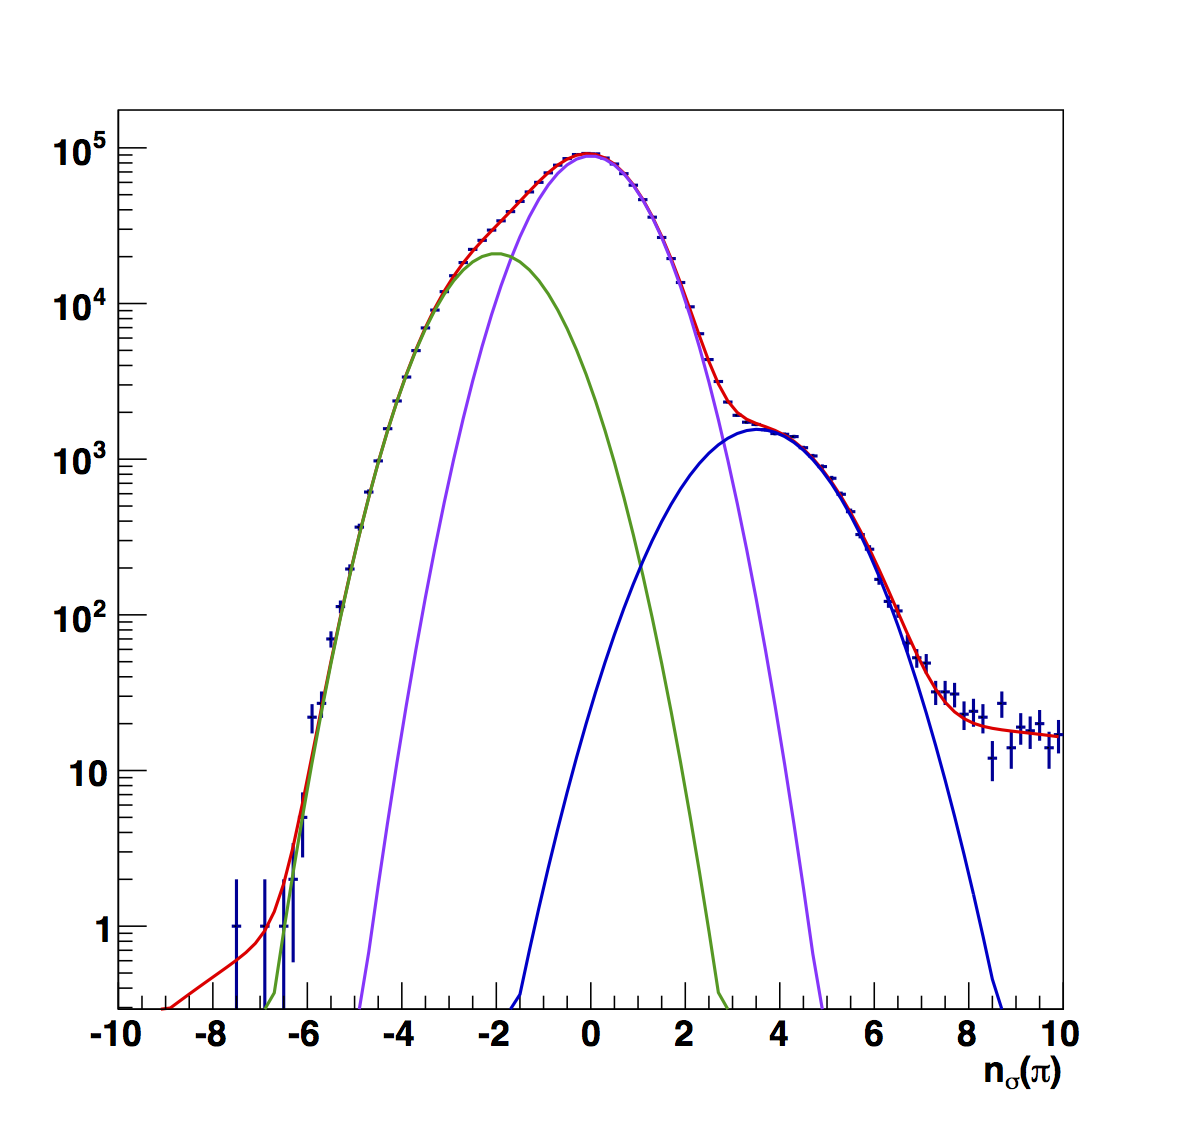
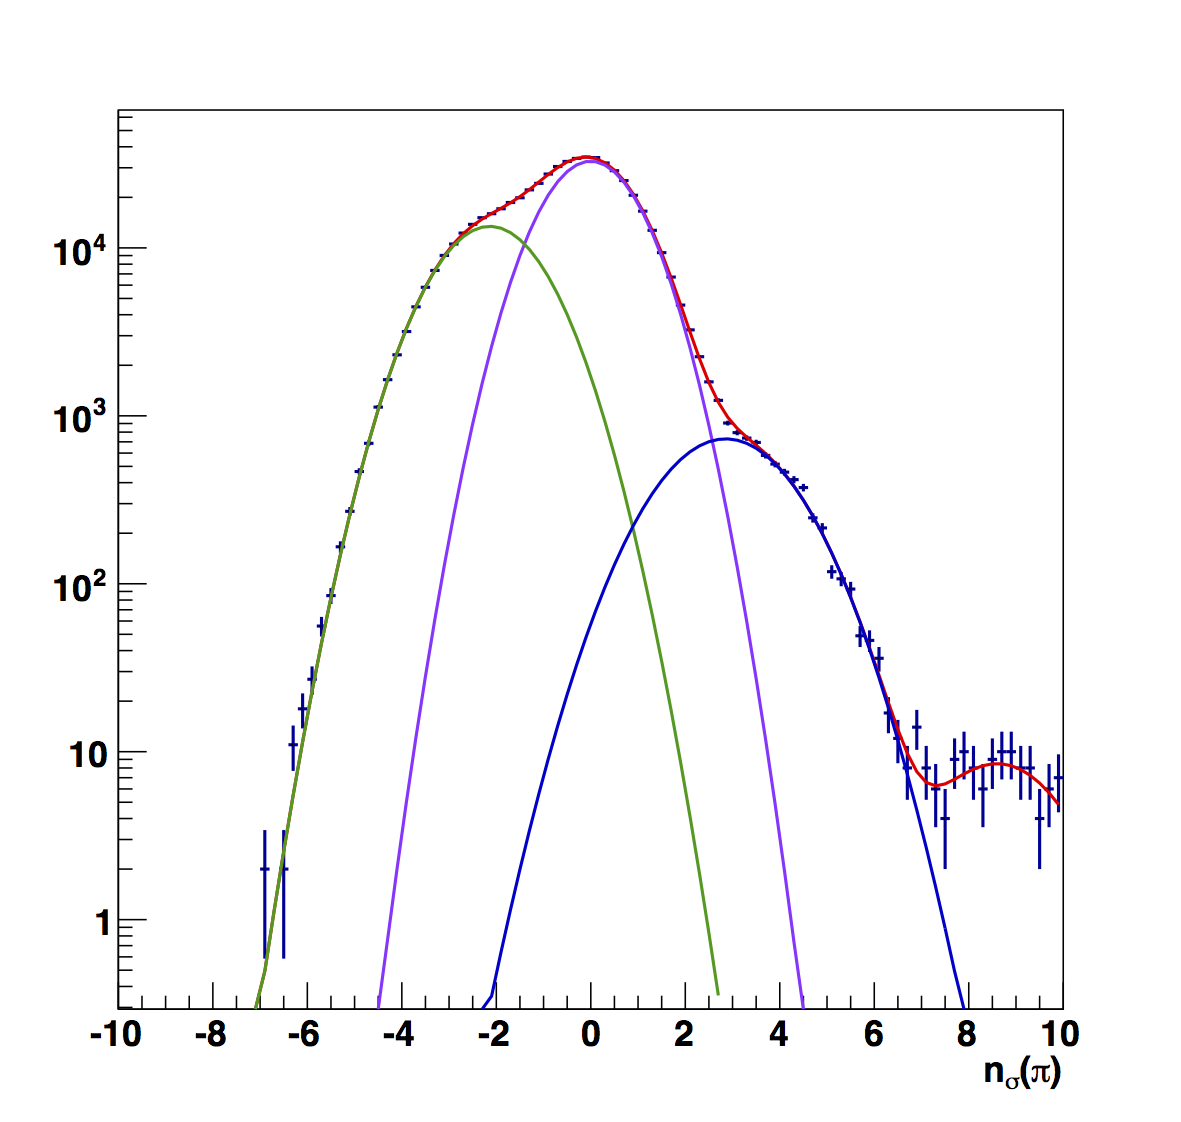
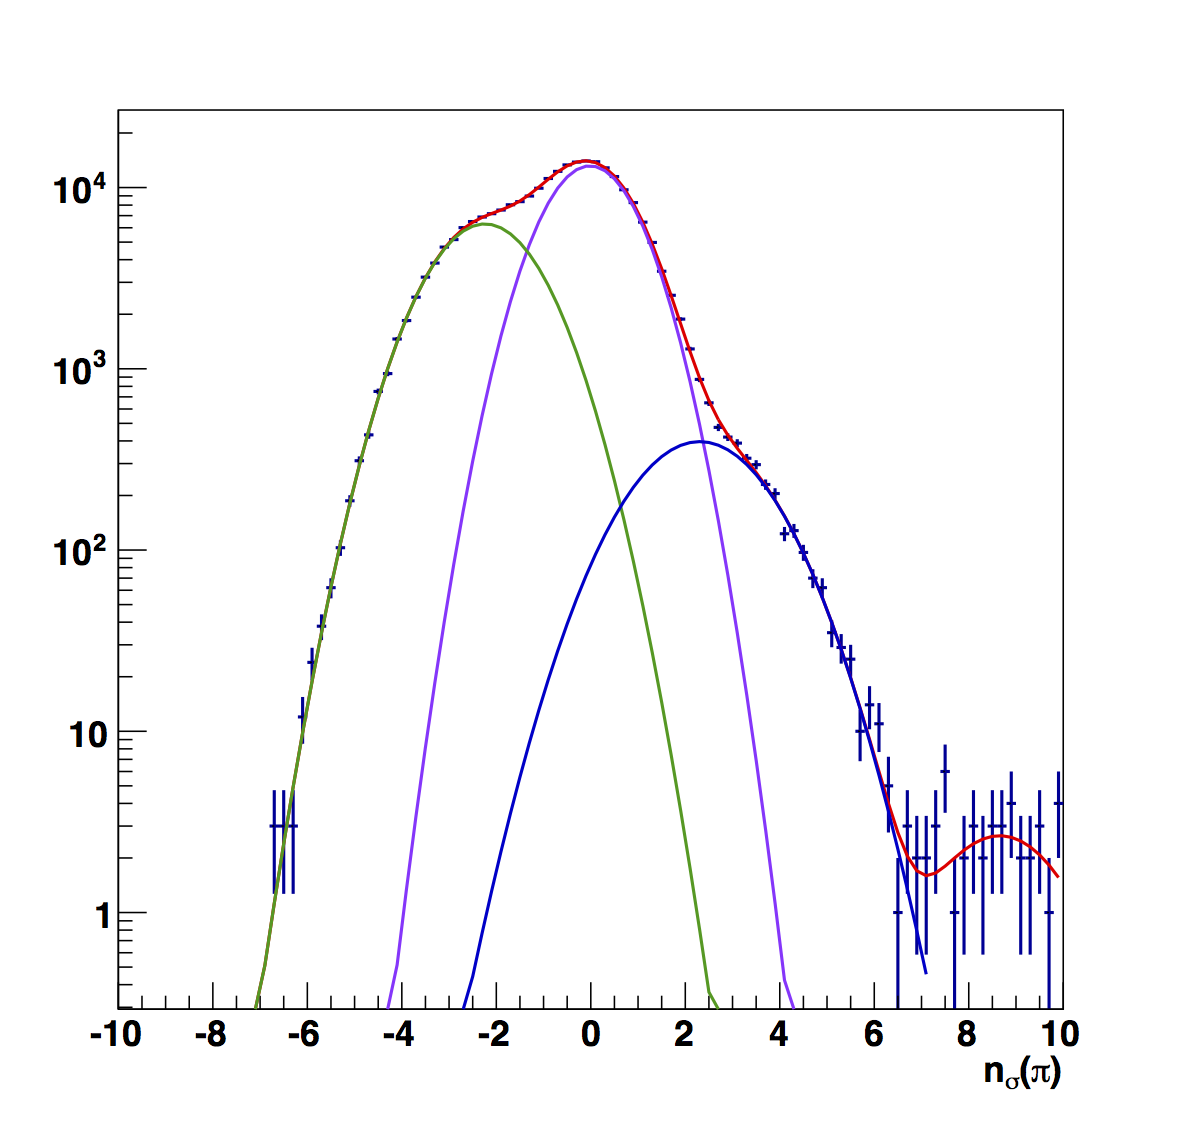
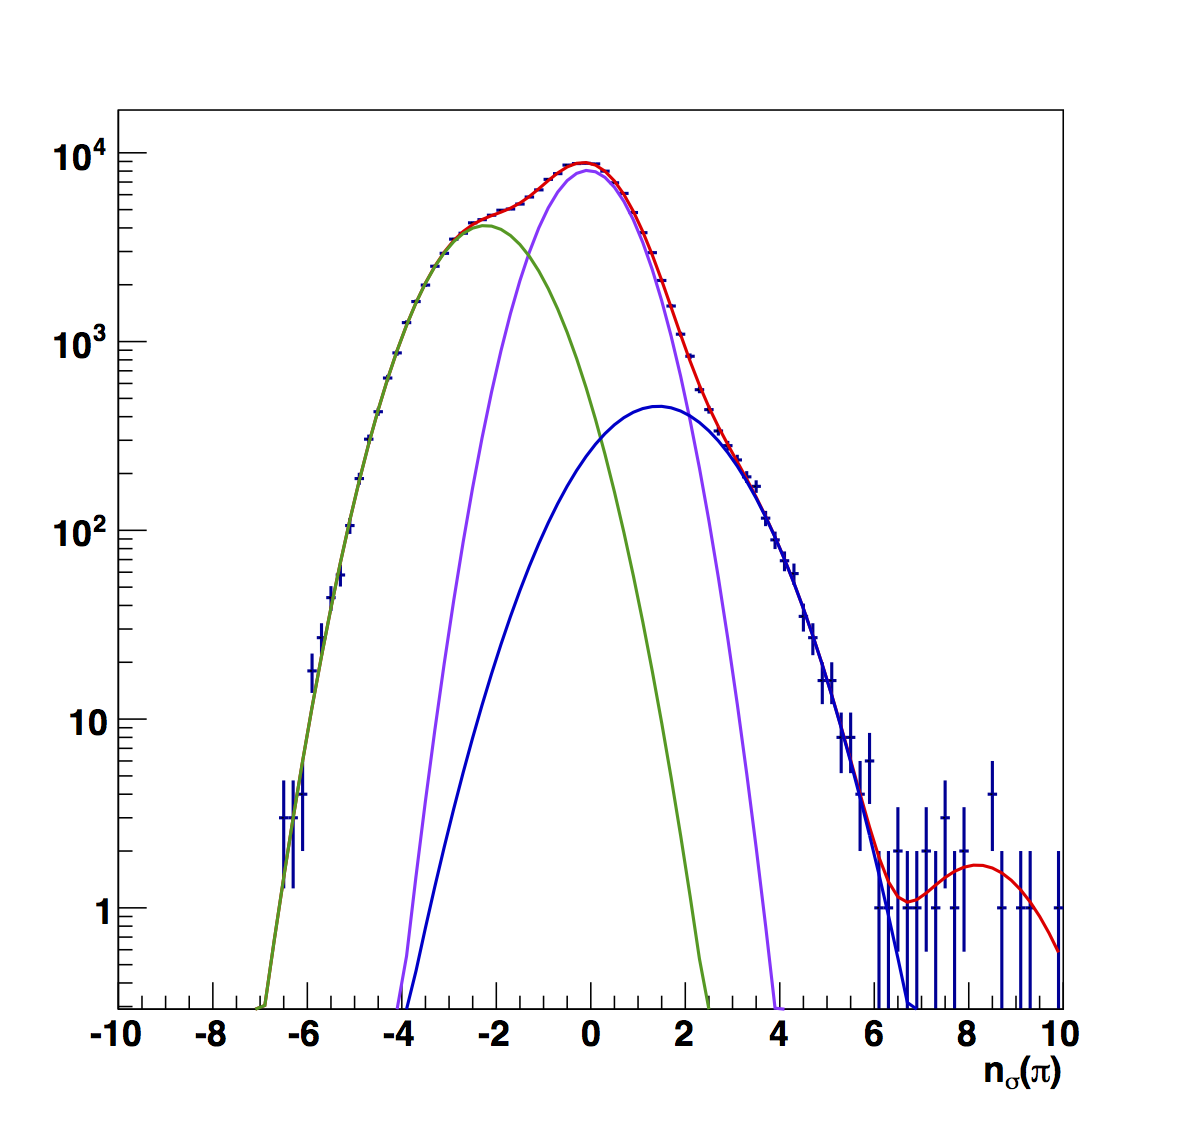
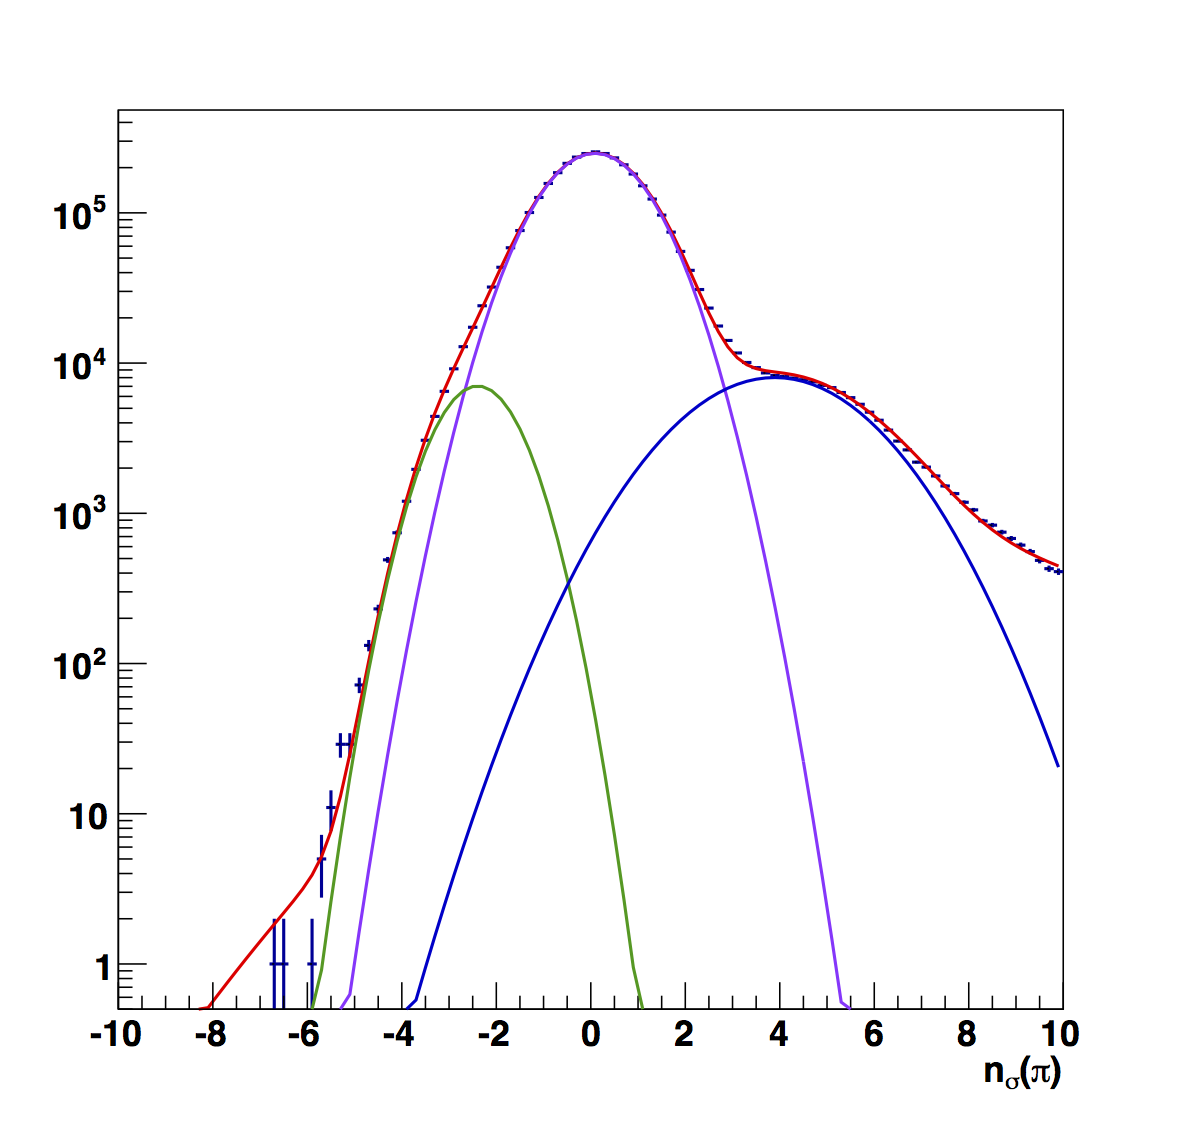
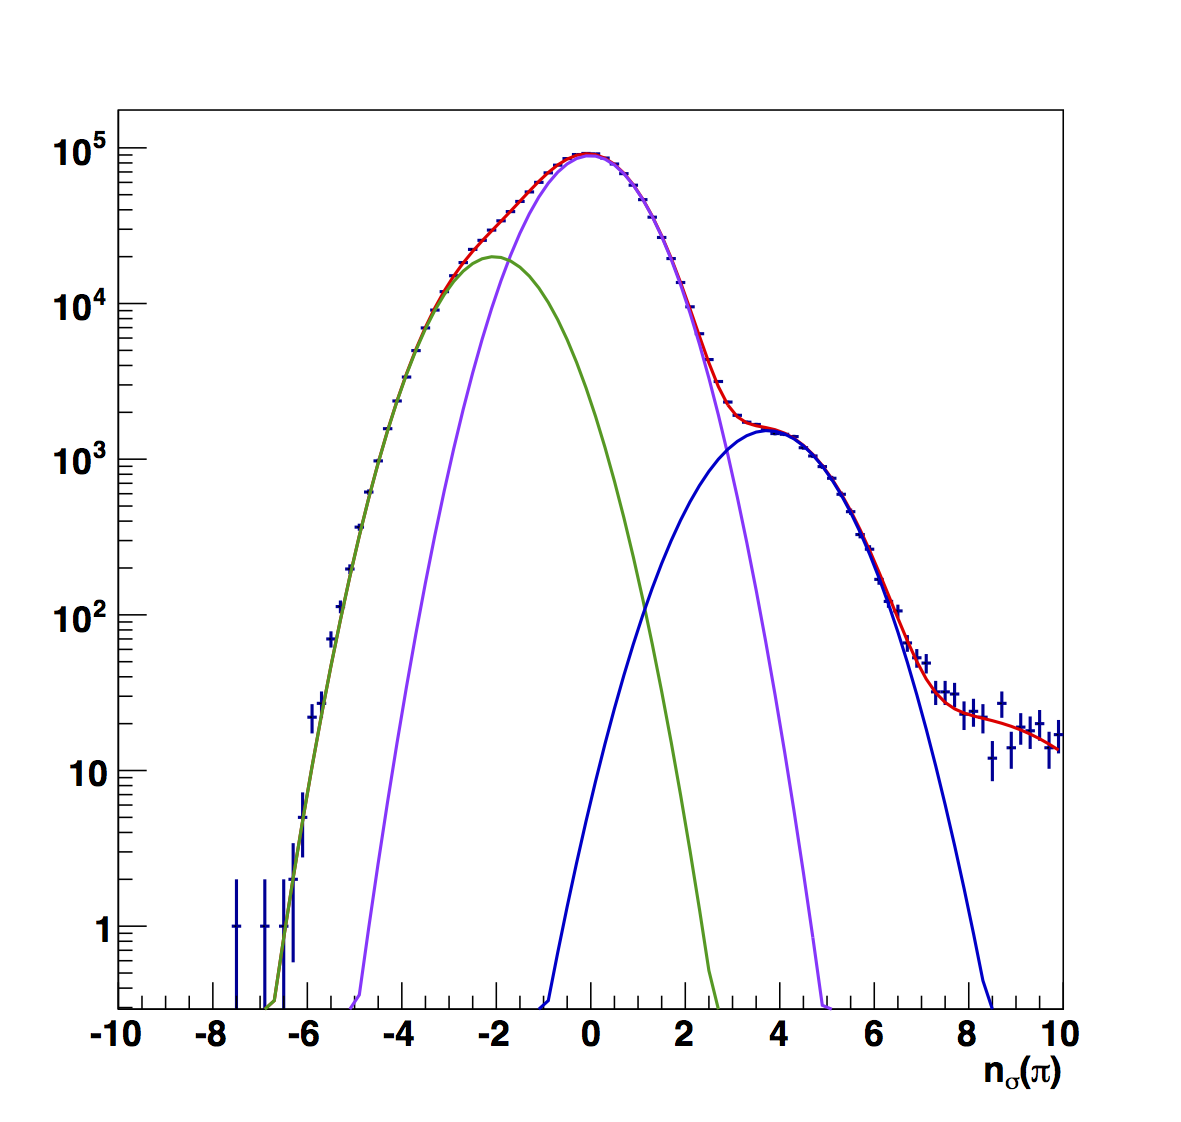
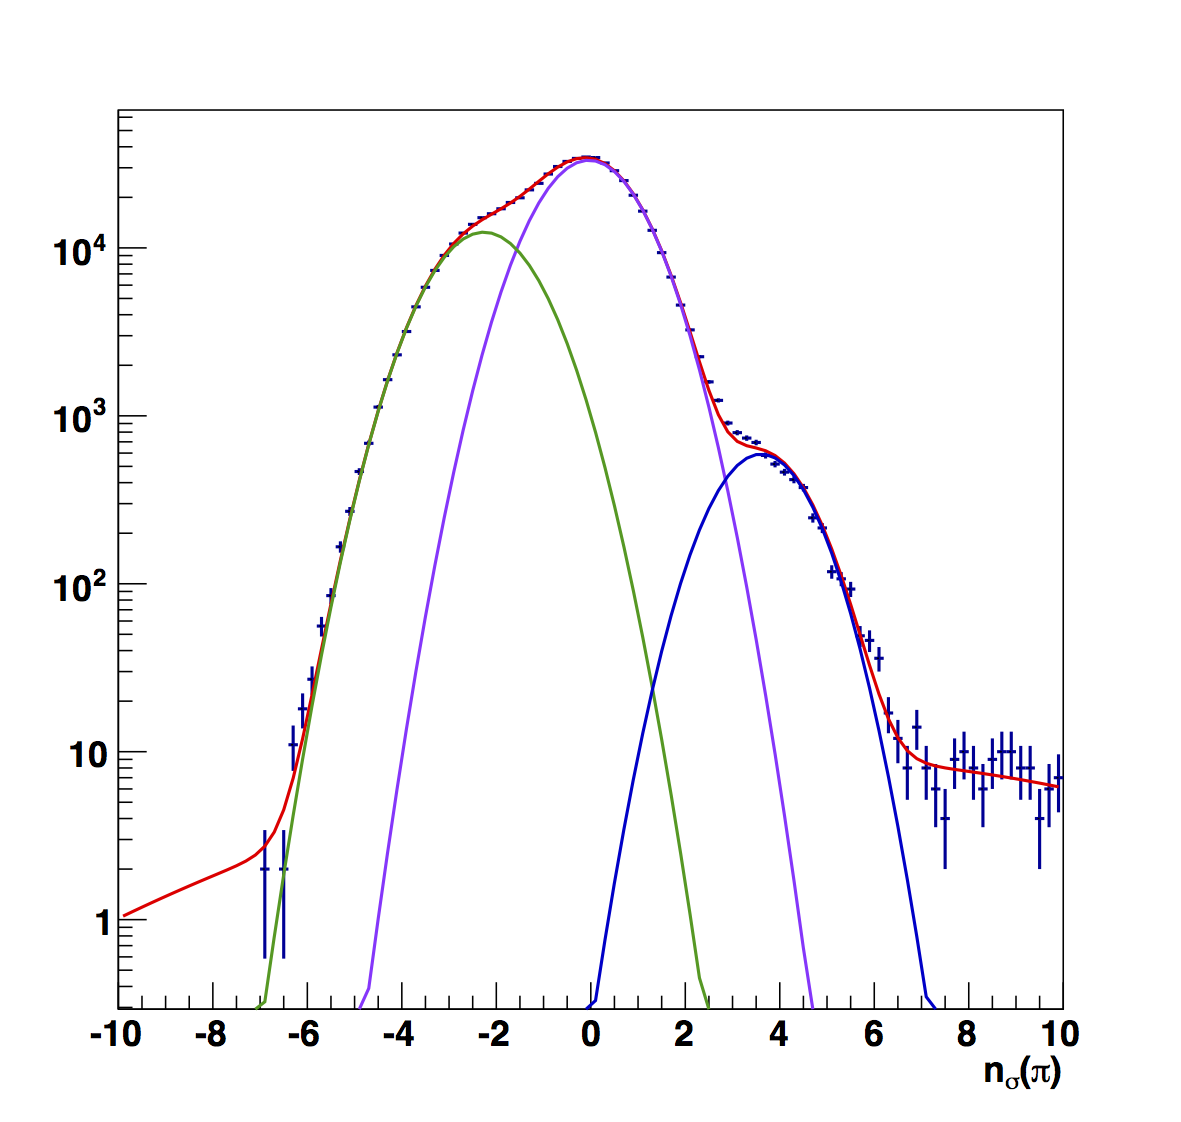
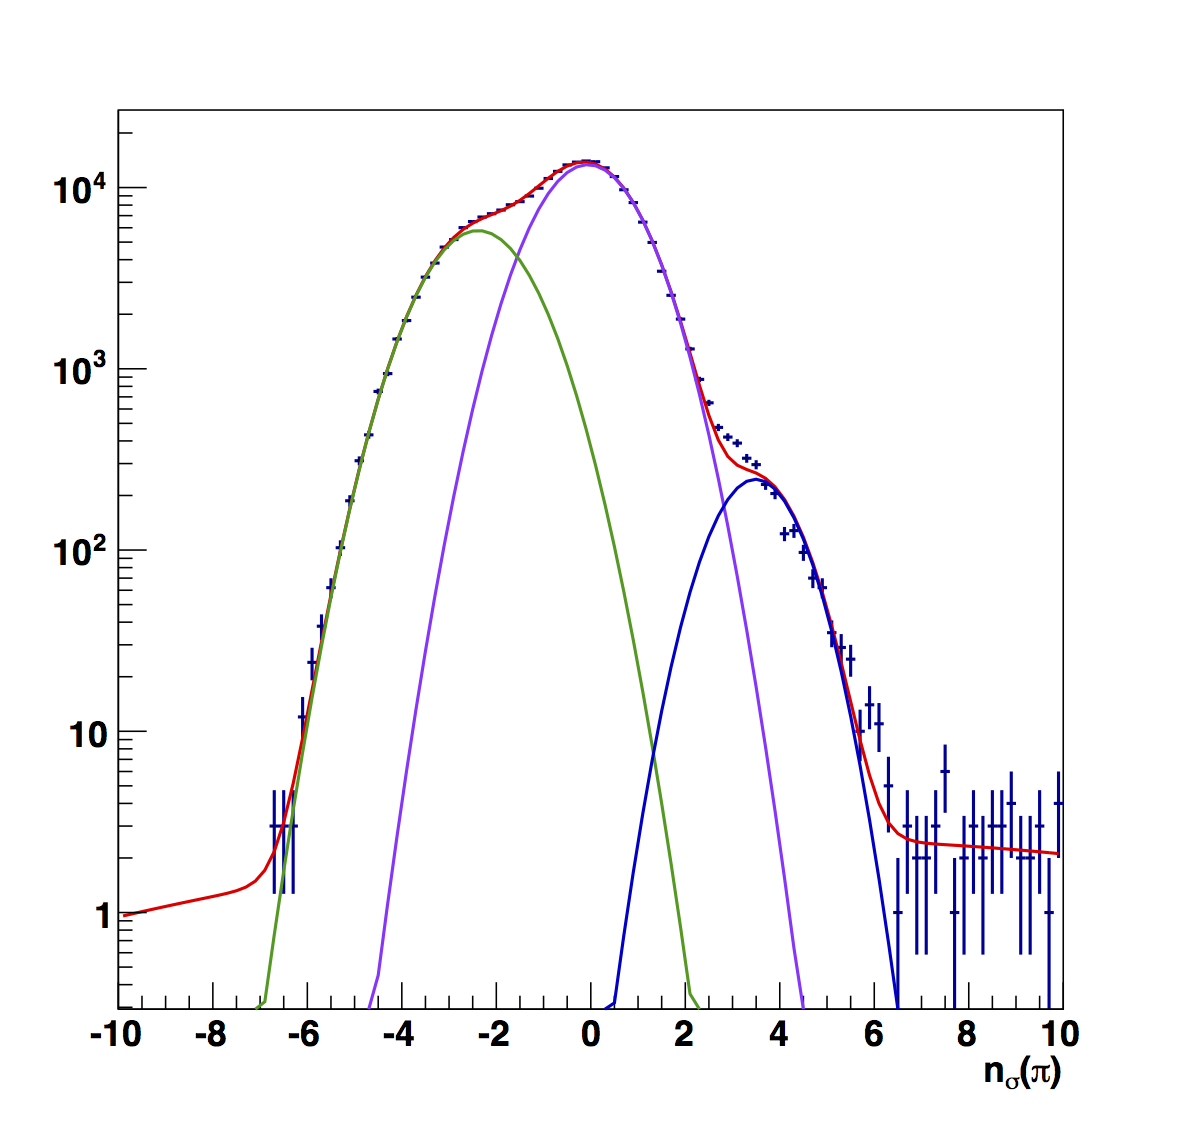
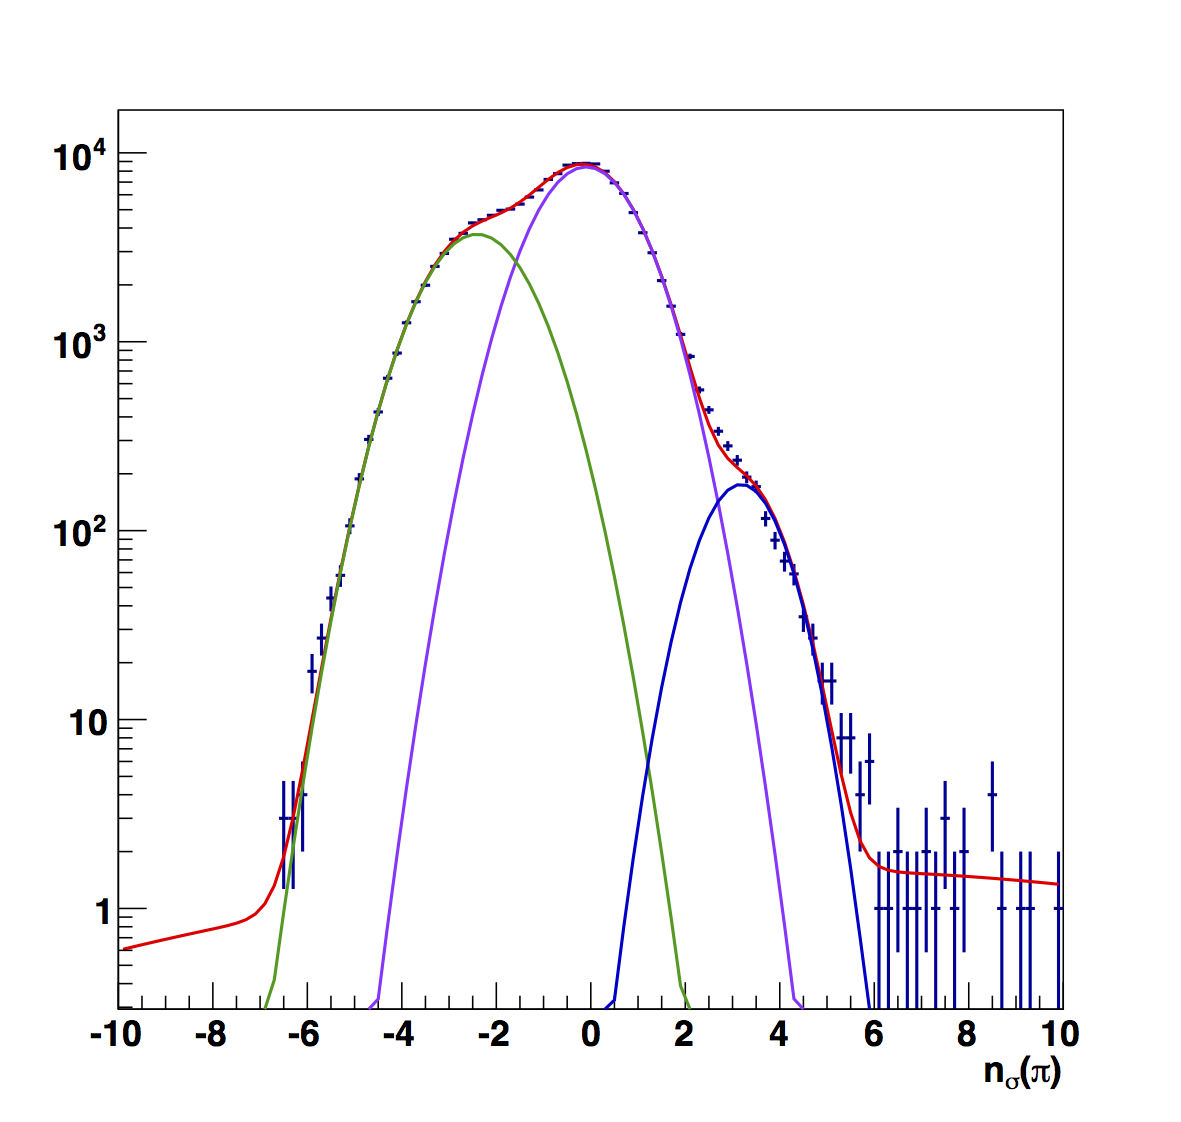
Figure 1: Raw Fits in Bins of z
| 0.1 < z < 0.2 |
0.2 < z < 0.3 |
0.3 < z < 0.4 |
 |
 |
 |
| 0.4 < z < 0.5 |
0.5 < z < 0.8 |
|
 |
 |
|
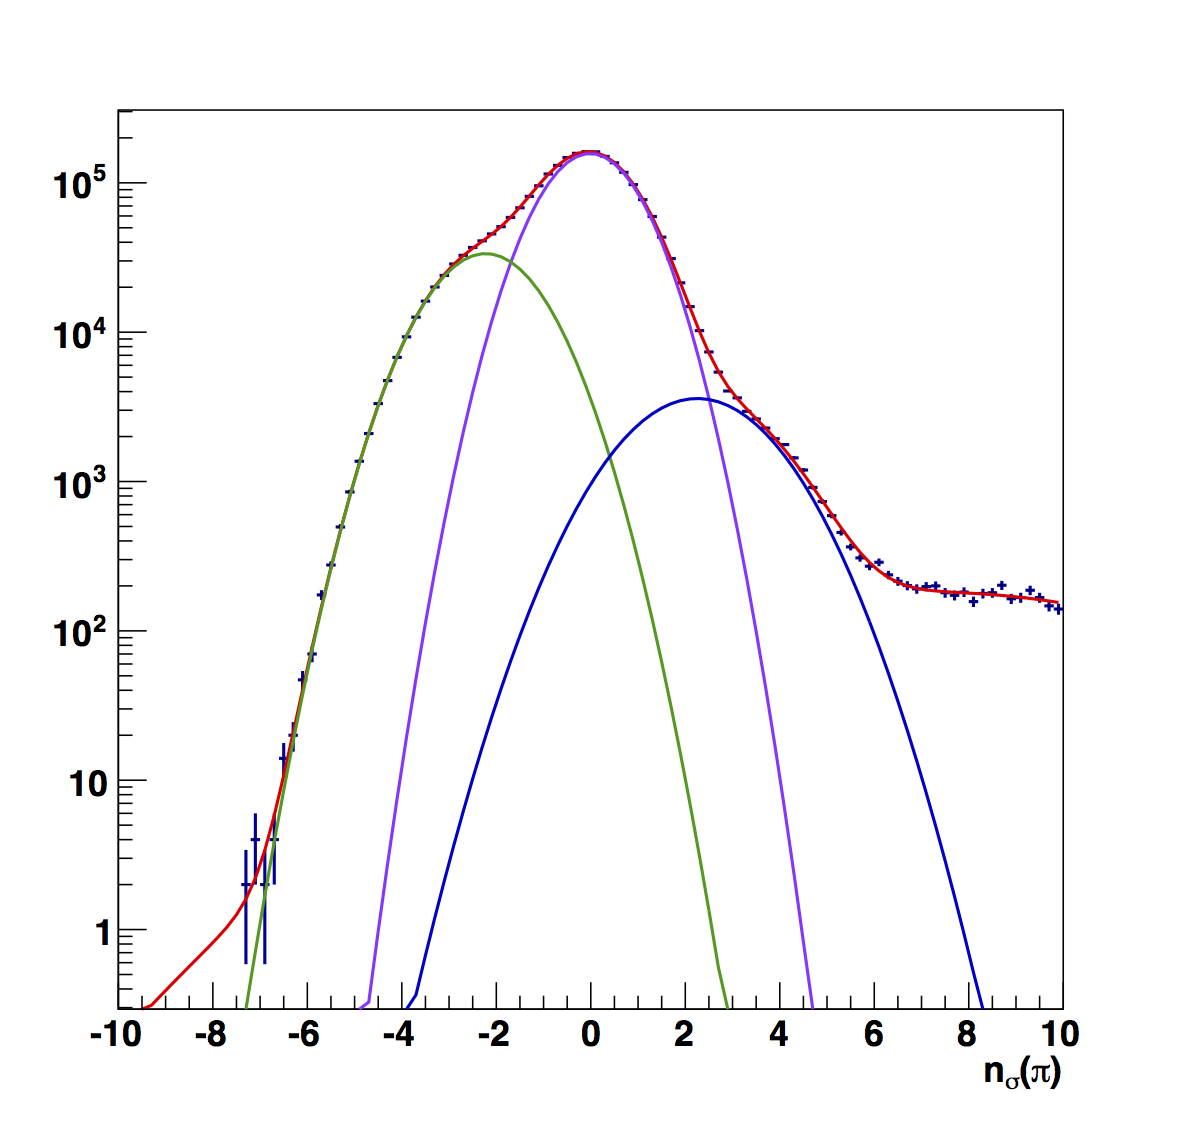
In Fig. 1 I show the raw fits to the nσ(π) distributions in z-bins (pions in purple, kaons/protons in green, and electrons in blue). One can see (e.g. in the first bin) that a three-Gaussian function is not sufficient to describe the distribution. I have added a fourth Gaussian function to cover the events at the high-positive edges. Once done, the electron peak sits closer to the center of the pion peak than in previous estimates. The effect is to lower the pion fractions (see Table 1). However, one also sees that in several cases the fitting function prefers to stack the pion and electron peaks on top of each other. This can lower the pion fractions by 10% compared to previous estimates. Therefore, before I apply a correction, I want to dig deeper to deterimine if this is correct.
Table 1
| z Range |
Pion Fraction |
e± Centroid |
| 0.1-0.2 |
0.919 |
2.16±0.10 |
| 0.2-0.3 |
0.823 |
0.44±2.02 |
| 0.3-0.4 |
0.754 |
0.37±3.63 |
| 0.4-0.5 |
0.870 |
2.23±0.20 |
| 0.5-0.8 |
0.581 |
0.00±2.60 |
One other motivation for care is that the function finds a dramatic swing in the location of the electron peak. The first bin is comfortable with the electron peak centered 2.16σ from the center. The very next bin drops all the way inside 0.5σ. However, the fourth bin is comfortable, again, out near 2.2σ. This is not how I would naïvely expect the peaks to behave. Perhaps, better inuition can be gained by looking at the z-bins as a function of jet pT. Suspicious, as well, are the large uncertainties on the electron centroids.
Figure 2
| 0.4 < z < 0.5 |
0.5 < z < 0.8 |
 |
 |
 |
 |
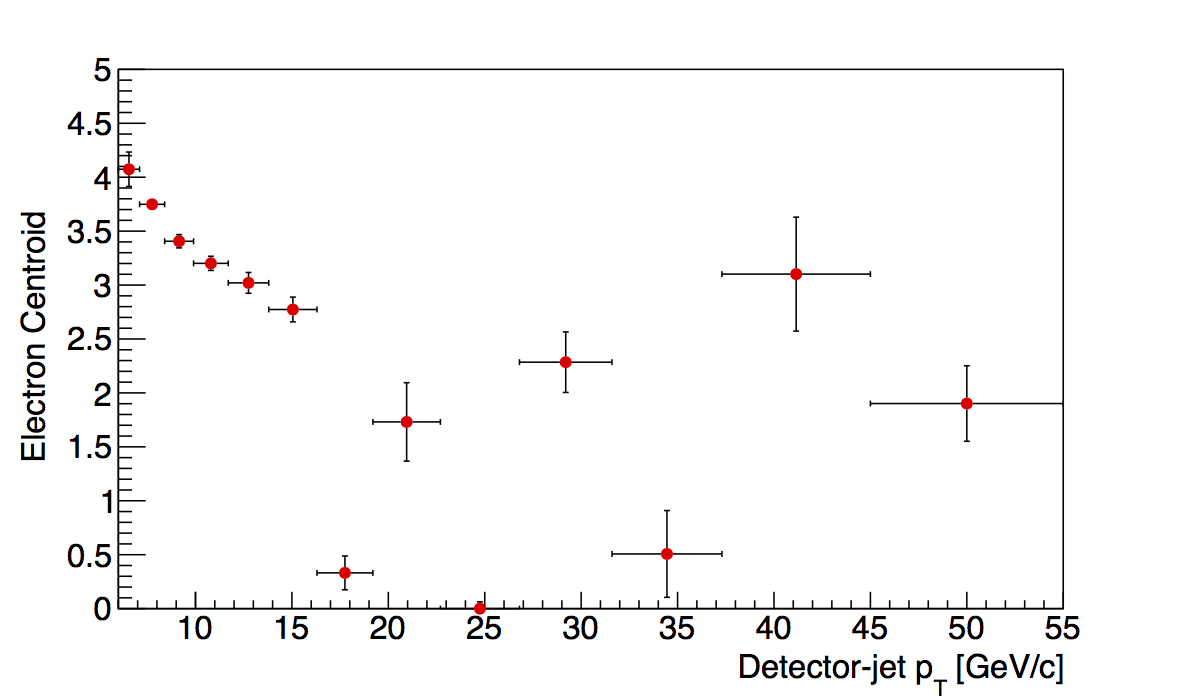
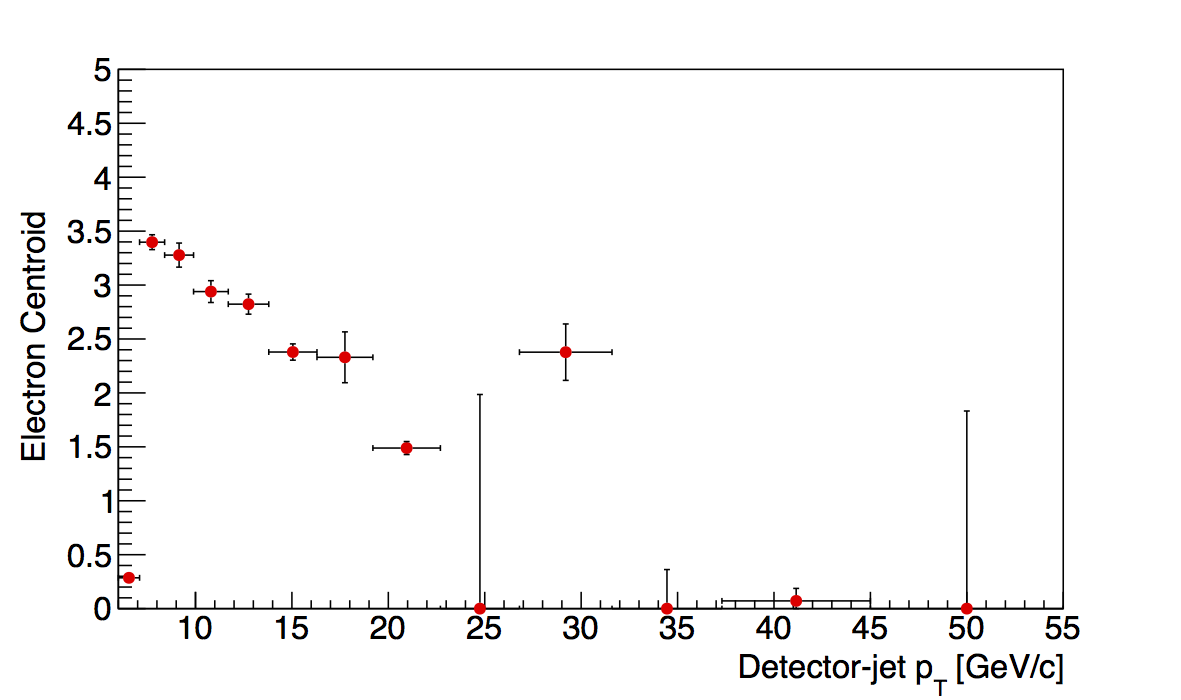
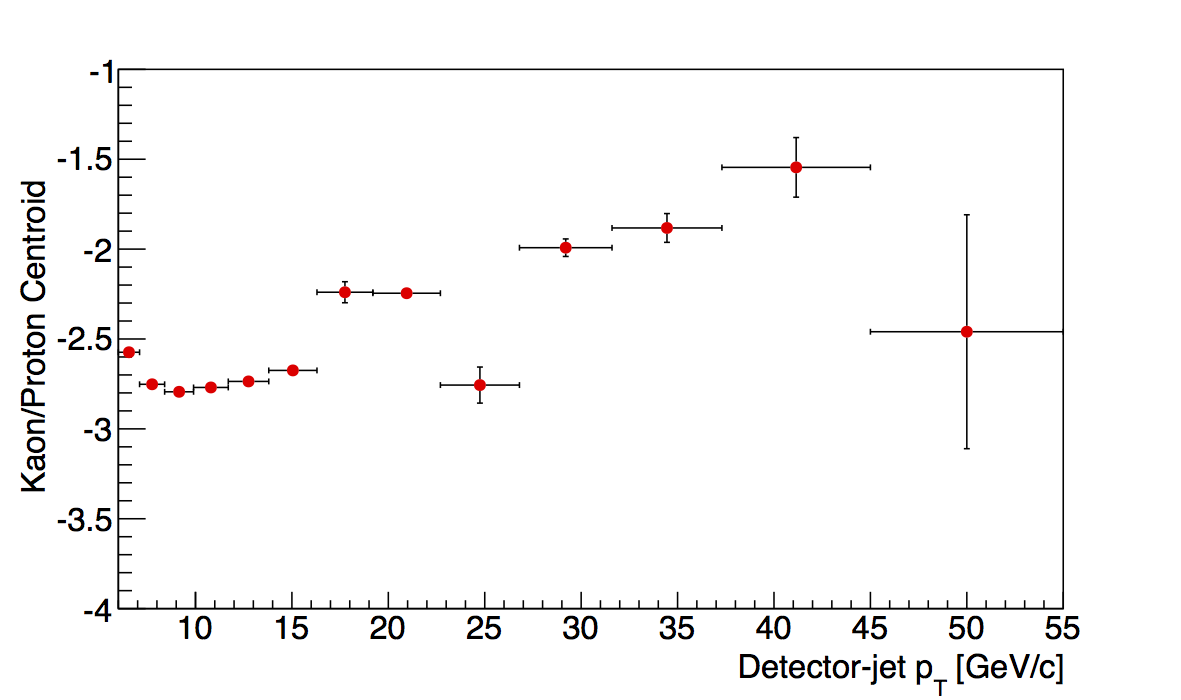
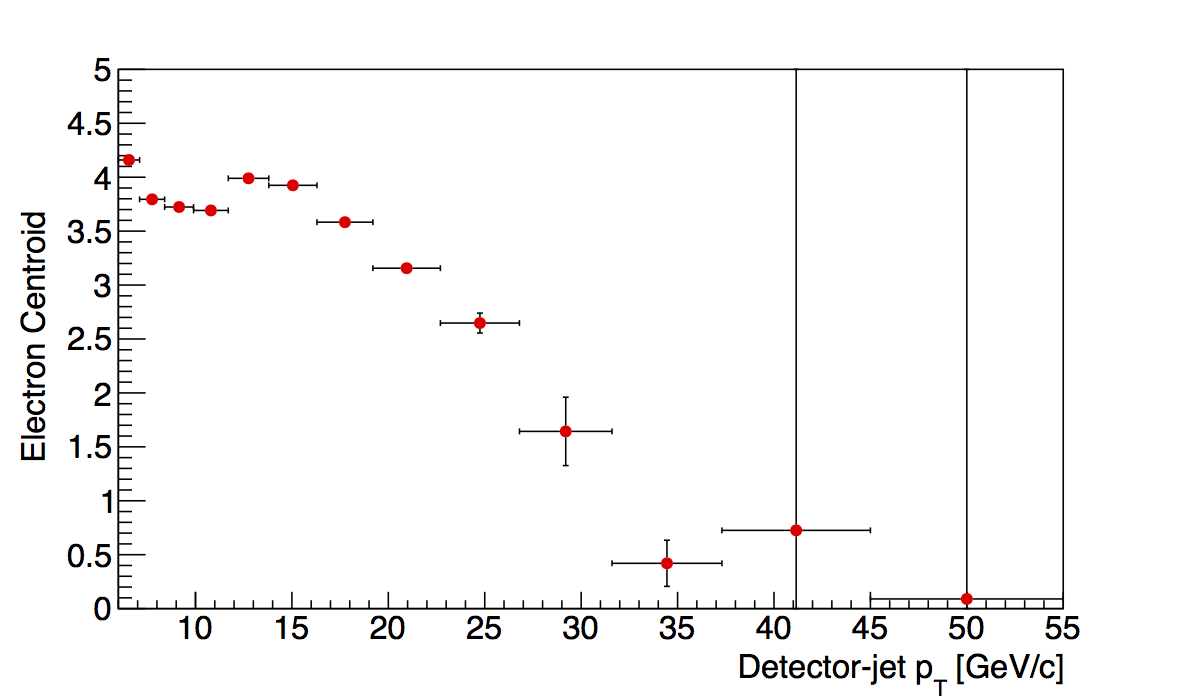
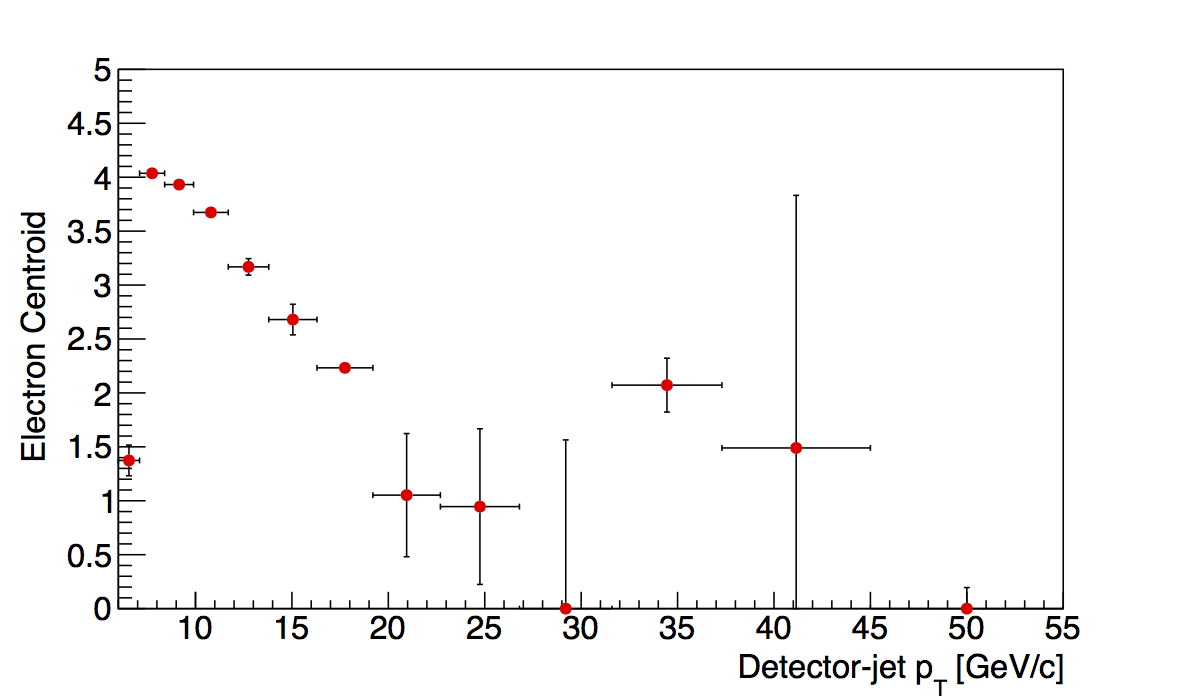
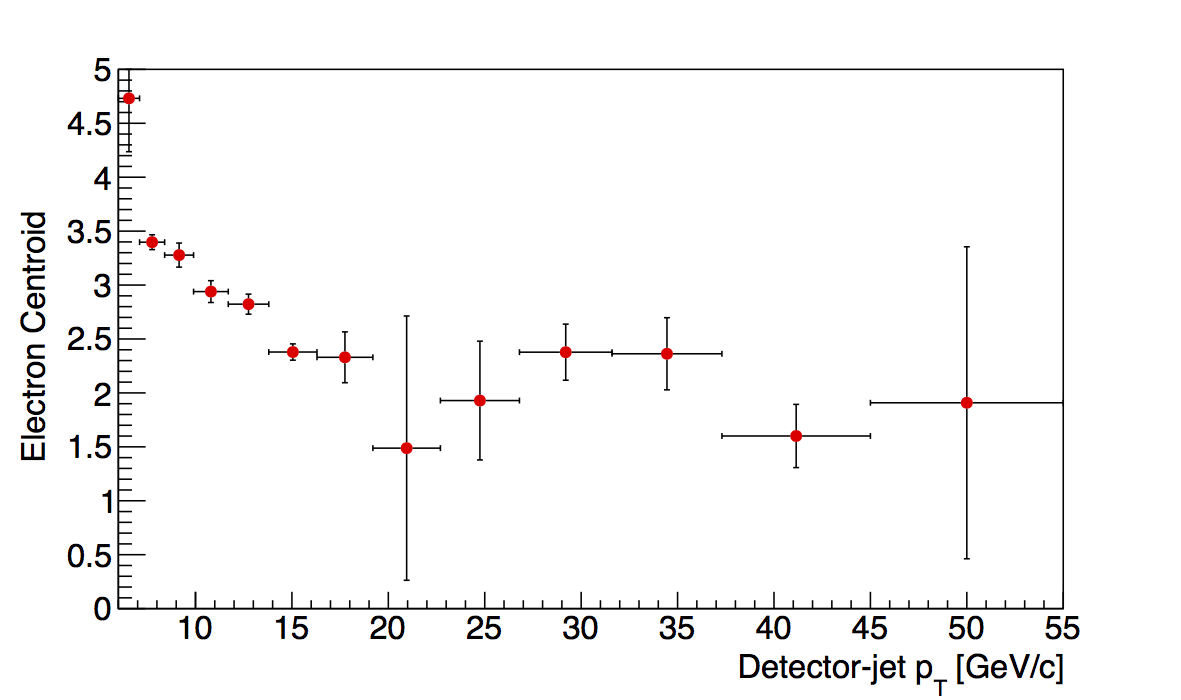
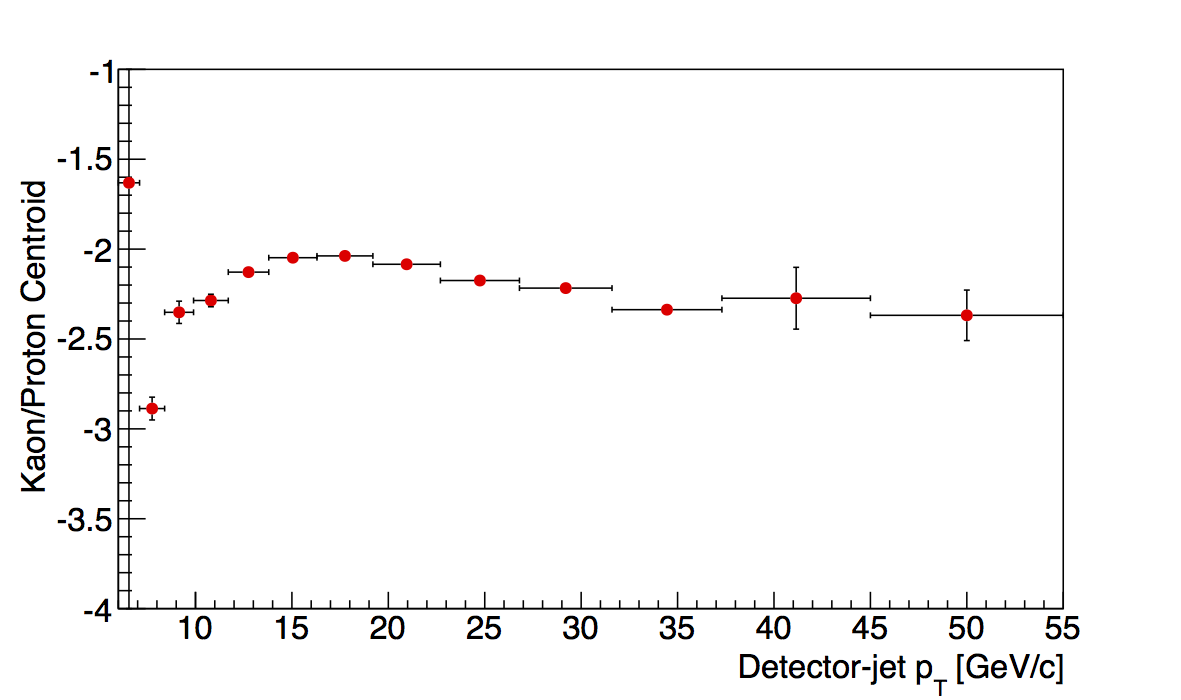
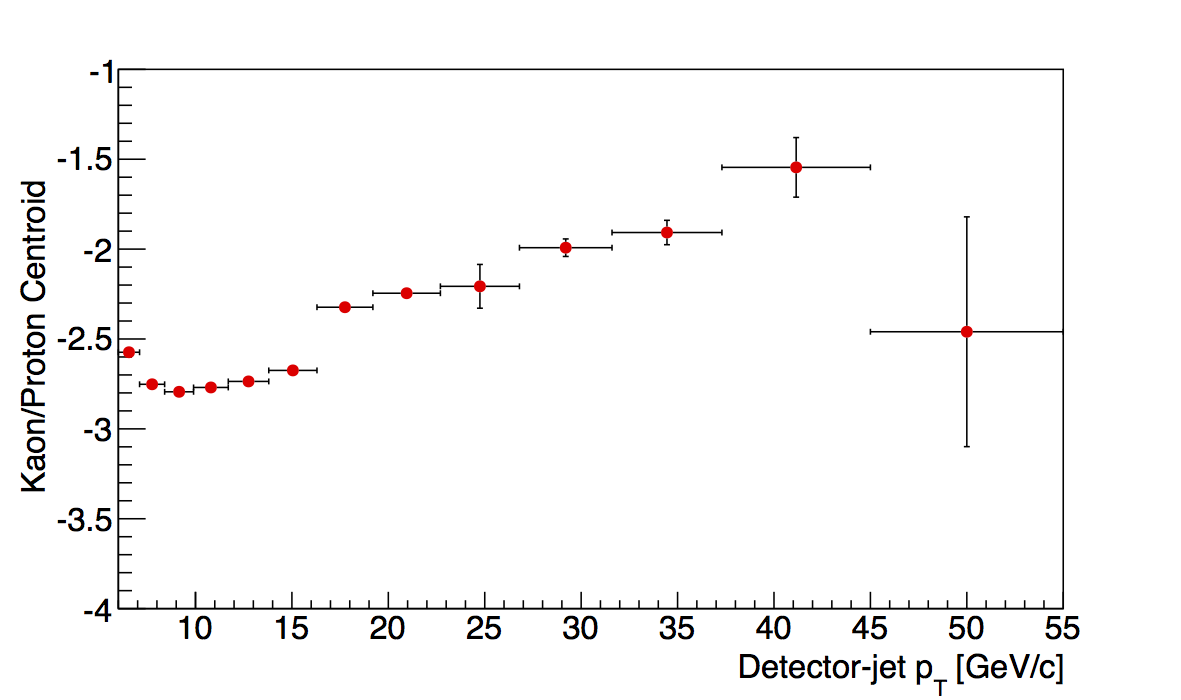
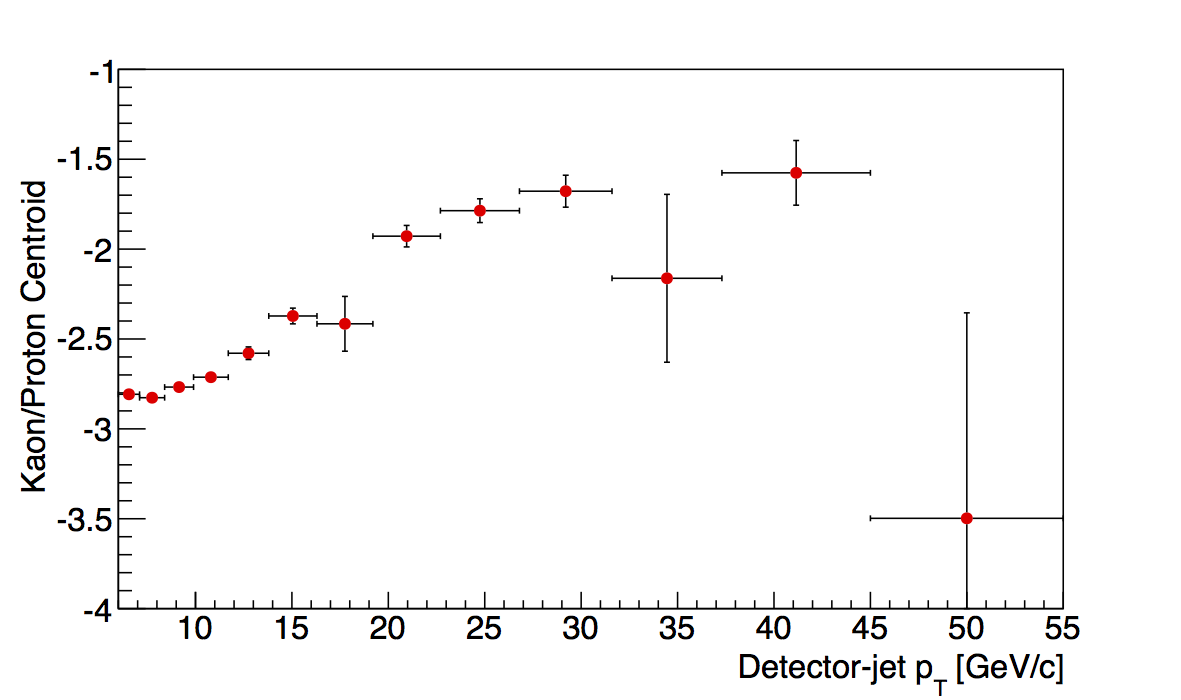
In Fig. 2 I show, as examples, the last two z-bins as functions of jet pT. While the others seem to show fairly smooth trends, out of the box, these show some rather harsh fluctuations. In the 0.4-0.5 bin a smooth trend is observed until the 7th pT-bin, where the centroid seems to drop off the table. Afterward, the centroids fluctuate quite wildly. In comparison, the kaon/proton cenroids are more smooth, but still show some odd behavior seemingly correlated with the flucutations in the electron peak. Similarly, the 0.5-0.8 bin shows some large fluctuations with the centroids basically going to zero above 34 GeV/c. Here, also, seemingly correlated, the kaon/proton centroids seem to behave erratically.
Figure 3
| 0.1 < z < 0.2 |
0.2 < z < 0.3 |
0.3 < z < 0.4 |
 |
 |
 |
| 0.4 < z < 0.5 |
0.5 < z < 0.8 |
|
 |
 |
|
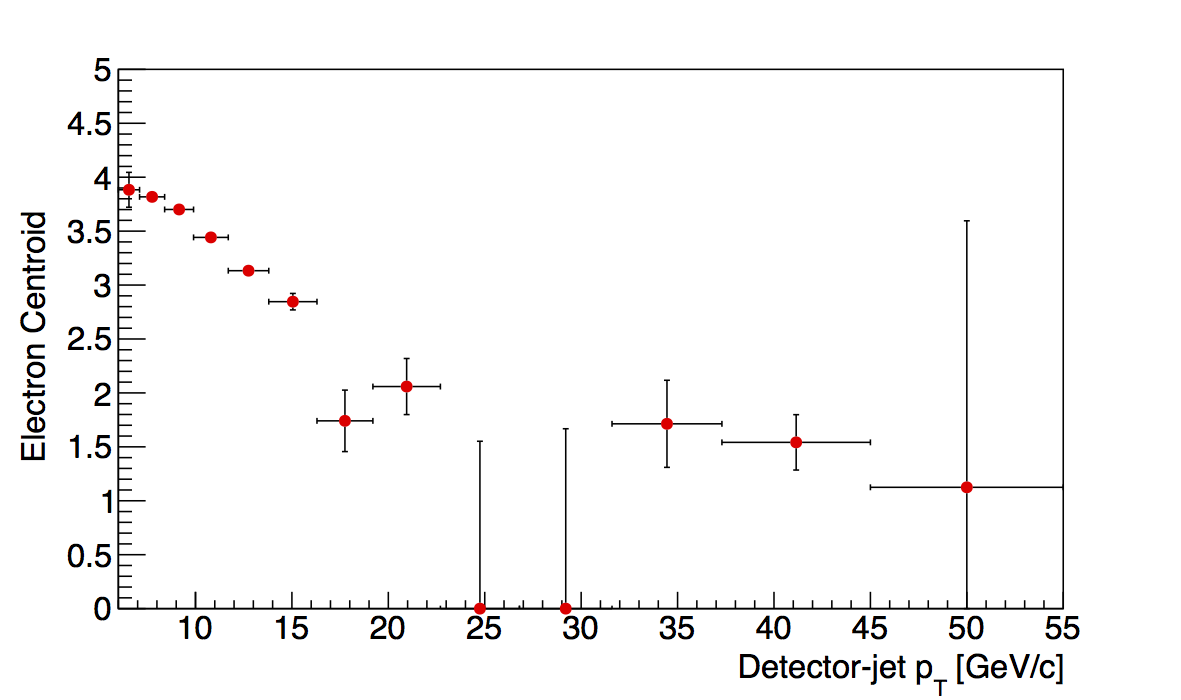
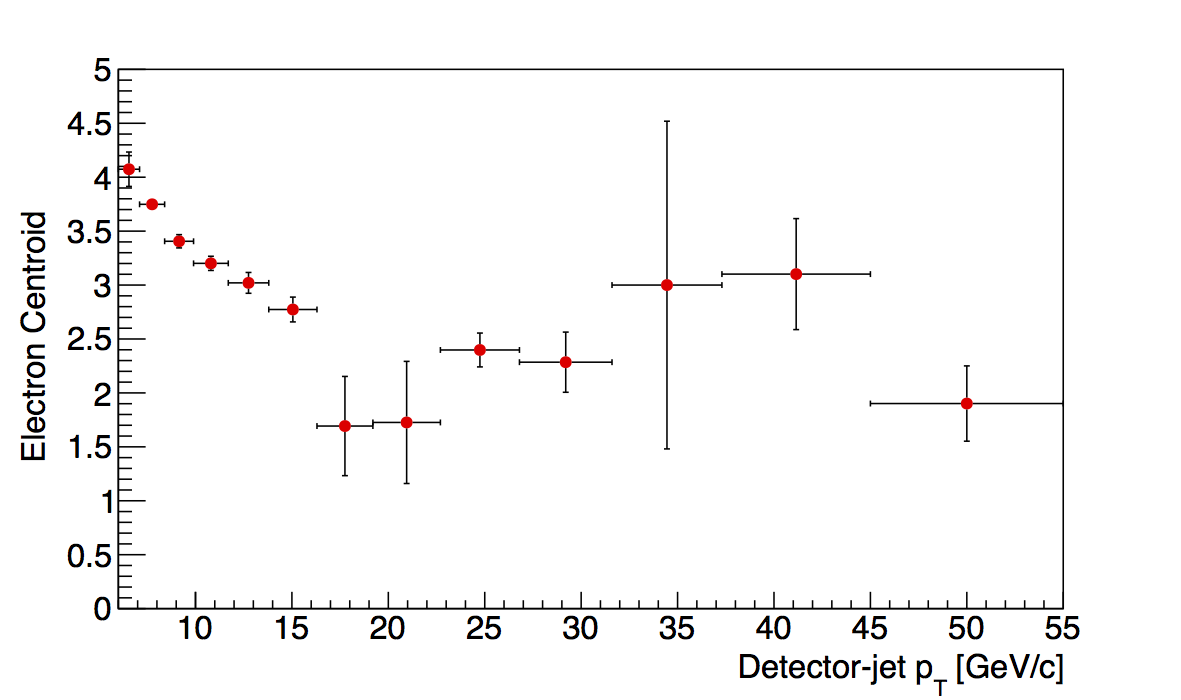
In Fig. 3, I show all bins and their dependence upon jet pT. For the highest two bins, I have placed some restrictions on the location of the electron centroids. I recognize this is a tricky game. However, so chosen, the fits find centroid locations which suggest a smooth trend without banging against the parameter limits for the centroids. The behavior seems to mimic the other z bins more than in Fig. 2. Also, across the high pT range, the centroids seem fairly flat. This may suggest a way to get a more accurate estimate of the electron centroid is to average the centroids for the various bins of pT.
Figure 4
| 0.1 < z < 0.2 |
0.2 < z < 0.3 |
0.3 < z < 0.4 |
 |
 |
 |
| 0.4 < z < 0.5 |
0.5 < z < 0.8 |
|
 |
 |
|
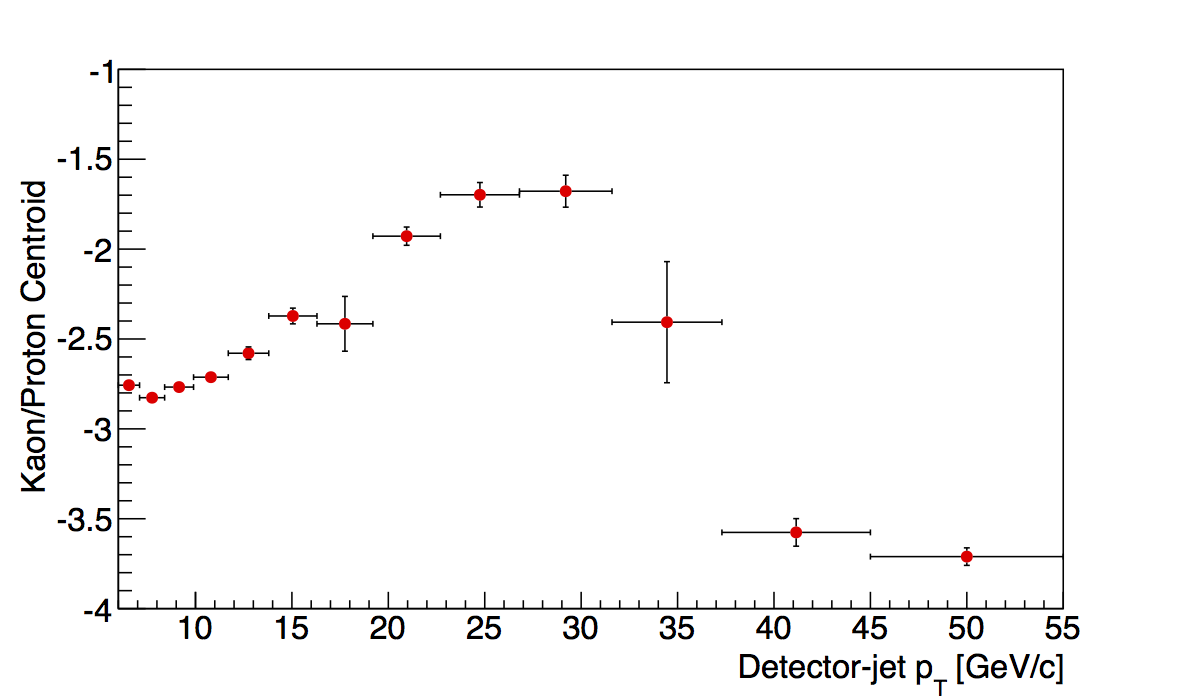
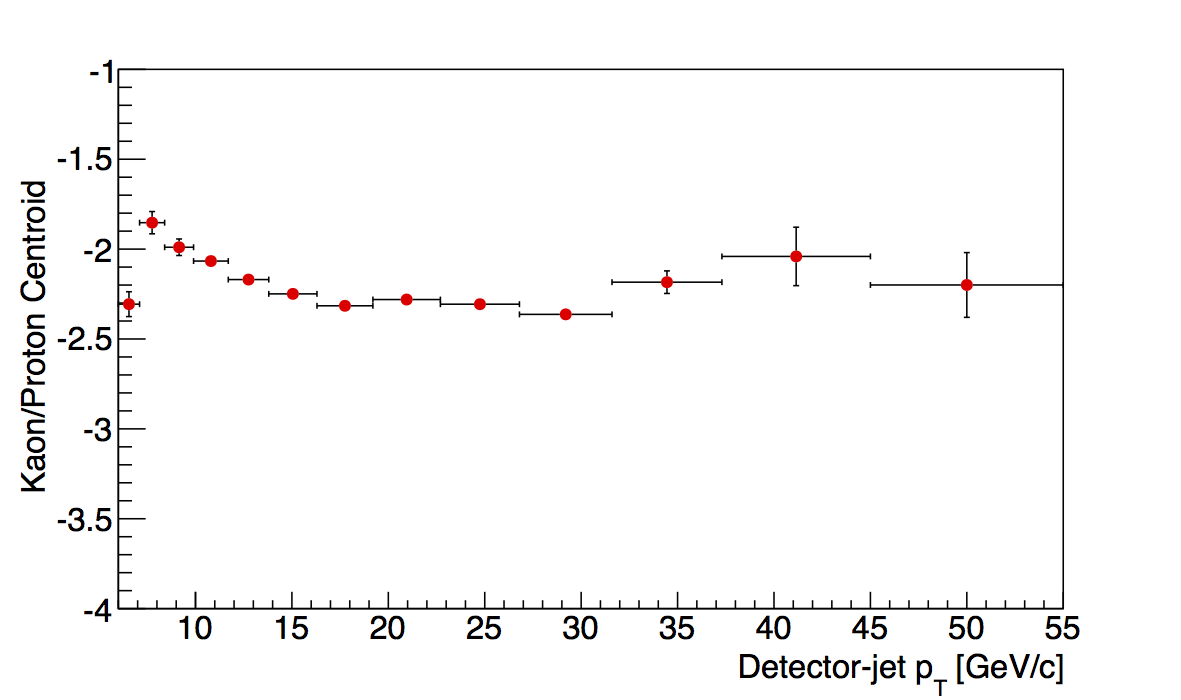
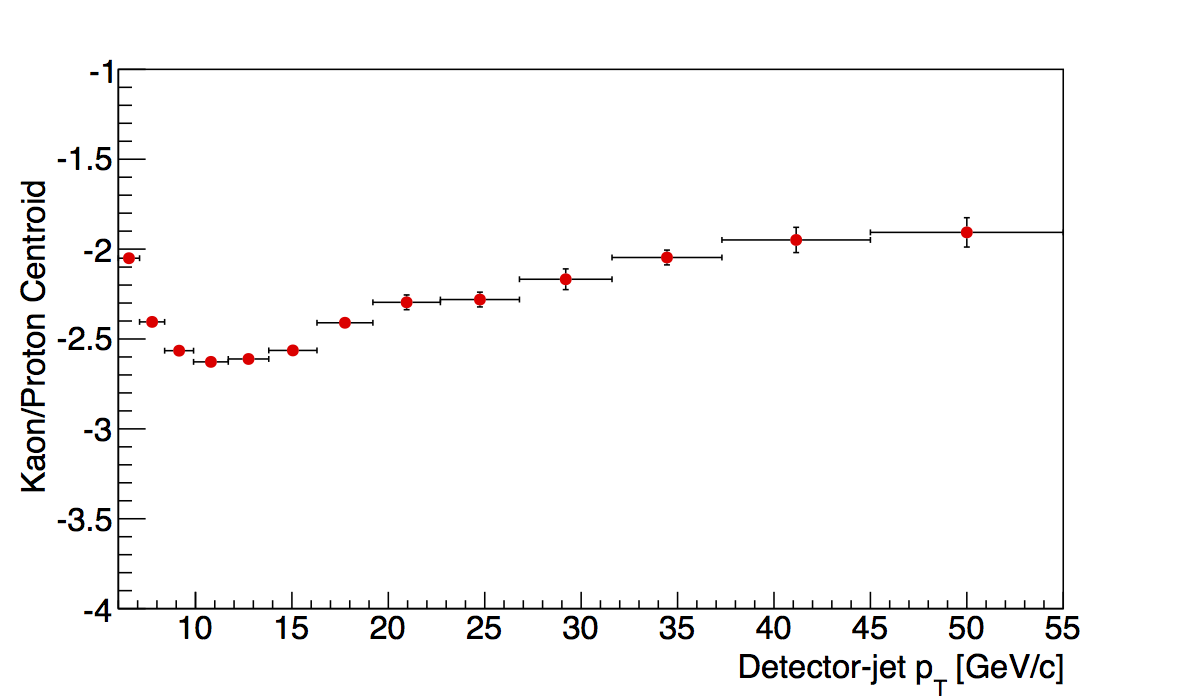
Another sanity check is to examine the pT dependence of the kaon/proton centroids. These were more stable to begin with, and after the "tuned" electron centroids, the kaon/proton behavior seems more smooth for the two highest z-bins.
Table 2
| z Range |
e± Centroid |
e± Centroid (Fitted) |
Pion Fraction |
Pion Fraction (Fitted) |
| 0.1-0.2 |
2.16±0.10 |
2.256±0.082 |
0.919 |
0.922 |
| 0.2-0.3 |
0.44±2.02 |
1.90±0.23 |
0.823 |
0.907 |
| 0.3-0.4 |
0.37±3.63 |
1.53±0.21 |
0.754 |
0.866 |
| 0.4-0.5 |
2.23±0.20 |
2.36±0.12 |
0.870 |
0.883 |
| 0.5-0.8 |
0.00±2.60 |
2.10±0.16 |
0.581 |
0.895 |
Table 2 presents a summary of the most relevant information using both the "raw" electron centroids and a "tuned" version where I have fit a constant to the high-pT portions of Fig. 3 (labeled "fitted"). For the 0.1-0.2 and 0.4-0.5 bins, the fitted centroids agree qualitatively with the raw versions, as do the resulting pion fractions. In the other cases, the fitted centroids, thus, the pion fractions, are quite different from the raw. The fitted fractions do seem more reasonable than the raw.
Figure 5
| 0.1 < z < 0.2 |
0.2 < z < 0.3 |
0.3 < z < 0.4 |
0.4 < z < 0.5 |
0.5 < z < 0.8 |
|
|
|
|
|
 |
 |
 |
 |
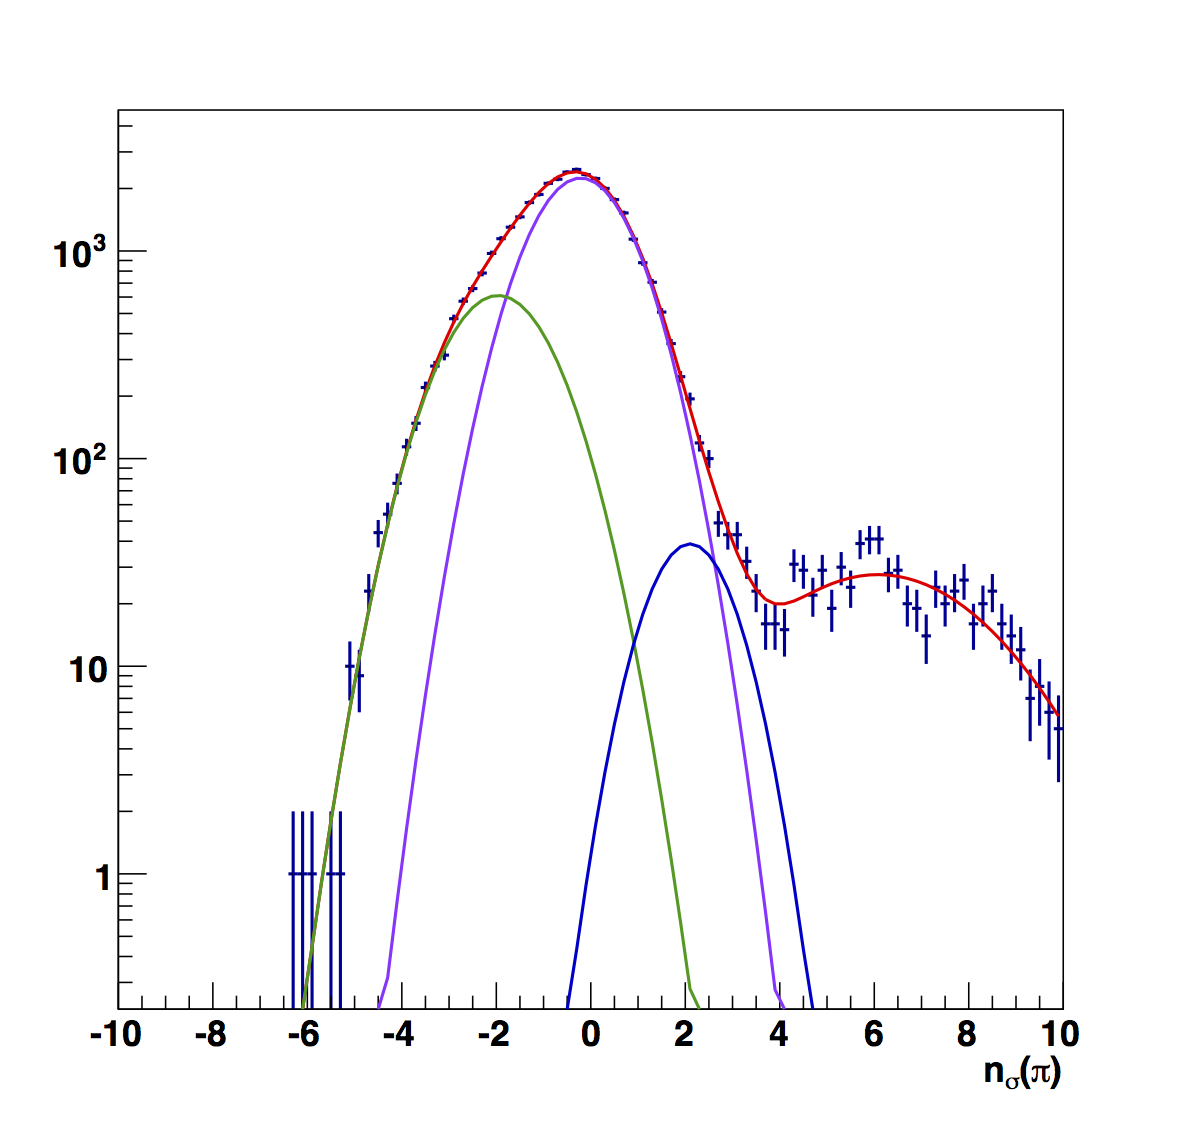 |
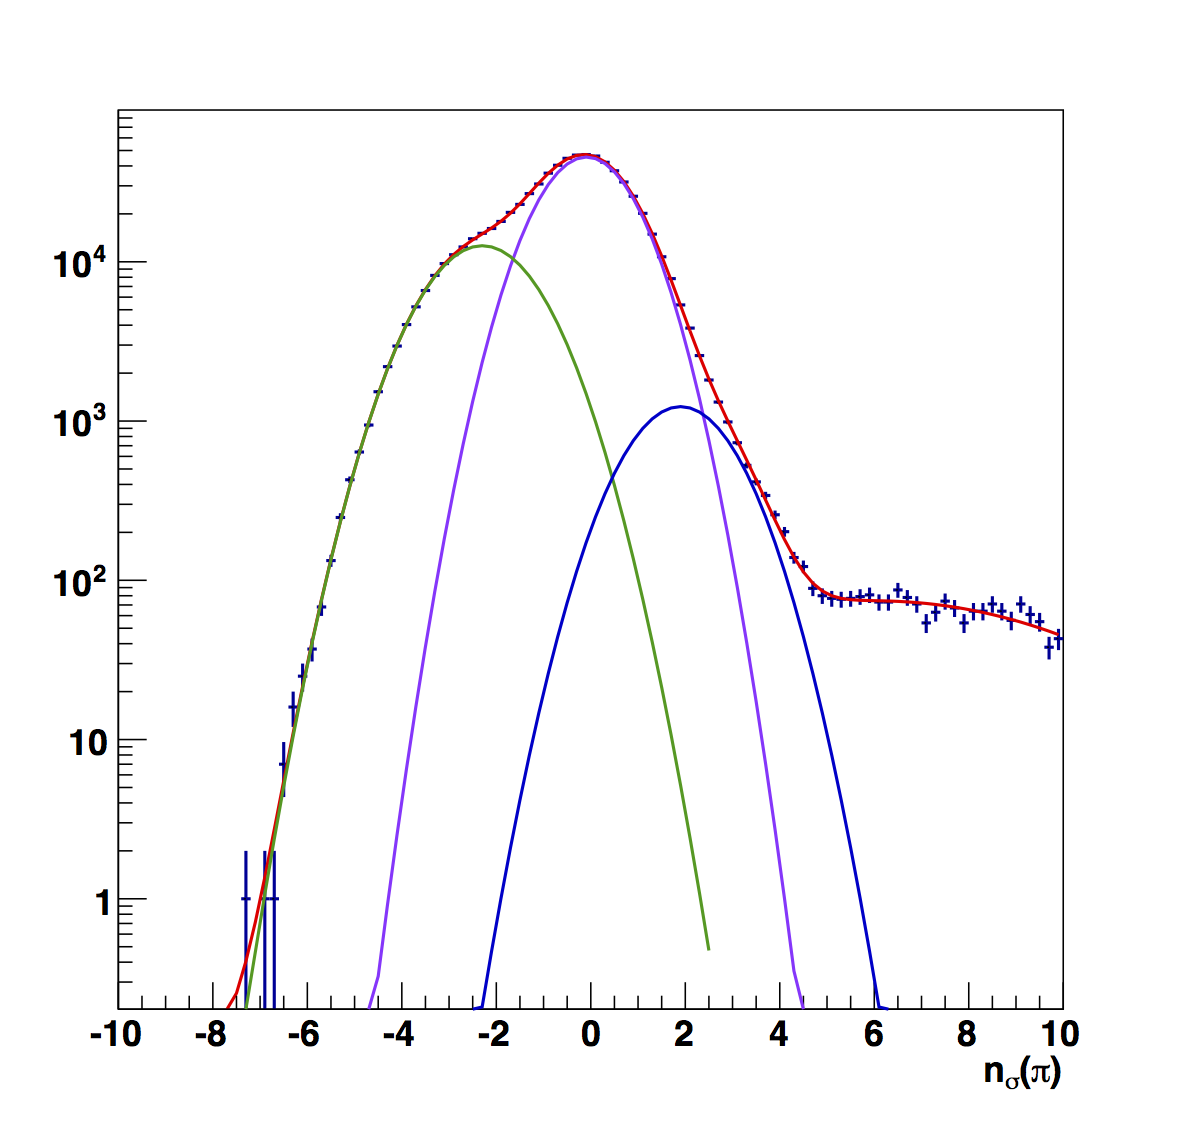
Figure 6 compares the nσ(π) fits between the (top) "raw" versions and the (bottom) "fitted," i.e. constant fits to high-pT. To my eye, the "fitted" versions look more reasonable. Aside from the peak position varying more smoothly, the widths are also more narrow, closer to my naïve expectation.
Mid pT
Figure 6
| 0.1 < z < 0.2 |
0.2 < z < 0.3 |
0.3 < z < 0.4 |
 |
 |
 |
| 0.4 < z < 0.5 |
0.5 < z < 0.8 |
|
 |
 |
|
Figure 6 shows the raw nσ(π) fits for the mid-pT range. One can see that the electron peak is more noticeable from 0.1 < z < 0.4 than in the high-pT case. However, above this, the peak is less visible and the fits prefer to stack Gaussians. So, we need to verify if this is reasonable. Referring to Fig. 3 (and even Fig. 2 to a large extent), one can see that for the mid-pT range (13.8 < pT < 22.7 GeV/c) the trends suggest centroids much further from 0. Thus, a reasonable approach may, again, be to take the average of the "fitted" centroids.
Table 3
| z Range |
e± Centroid |
e± Centroid (Fitted) |
Pion Fraction |
Pion Fraction (Fitted) |
| 0.1-0.2 |
3.477±0.018 |
3.600±0.017 |
0.939 |
0.946 |
| 0.2-0.3 |
1.828±0.012 |
2.243±0.023 |
0.880 |
0.898 |
| 0.3-0.4 |
1.82±0.21 |
2.719±0.071 |
0.868 |
0.923 |
| 0.4-0.5 |
0.000±0.071 |
2.67±0.11 |
0.689 |
0.929 |
| 0.5-0.8 |
0.00±2.47 |
2.372±0.072 |
0.580 |
0.915 |
Table 3 summarizes the results of the "raw" vs. "fitted" methods. The first two bins yield qualitatively similar results. In the third bin, the results differ a bit, though the resulting pion fractions are only different by 6%. The last two bins are qualitatively quite different, as expected from the substantially different electron centroids. Again, I find the fitted versions easier to swallow; but care should be taken with such a study.
Figure 7
| 0.1 < z < 0.2 |
0.2 < z < 0.3 |
0.3 < z < 0.4 |
0.4 < z < 0.5 |
0.5 < z < 0.8 |
|
|
|
|
|
 |
 |
 |
 |
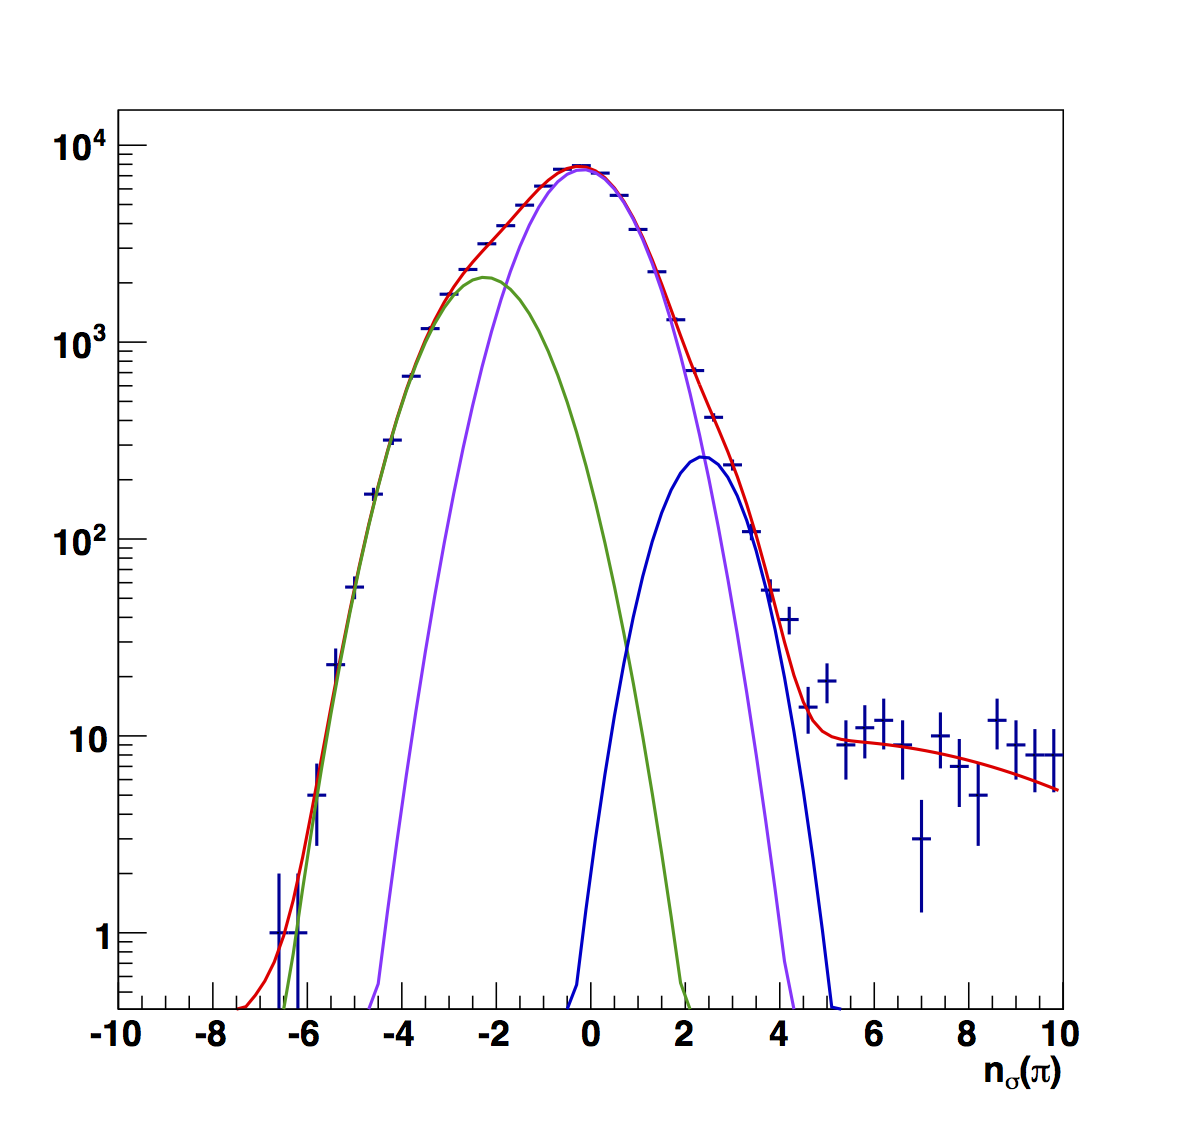 |
Figure 7 compares the nσ(π) peak fits for the (top) raw and (bottom) fitted versions. Again, electron peaks are generally more narrow in the fitted versions, and the smoother variation makes more sense to me.
Low pT
Figure 8
| 0.1 < z < 0.2 |
0.2 < z < 0.3 |
0.3 < z < 0.4 |
 |
 |
 |
| 0.4 < z < 0.5 |
0.5 < z < 0.8 |
|
 |
 |
|
Figure 8 shows the raw fits for the low pT range (6 < pT < 13.8 GeV/c). Here, the electron peak is more visible across the full range of z than the other pT ranges. The first bin seems a bit odd, mostly due to the large yield on the high-nσ side. The raw electron centroids are, everywhere, further from the center.
Table 4
| z Range |
e± Centroid |
e± Centroid (Fitted) |
Pion Fraction |
Pion Fraction (Fitted) |
| 0.1-0.2 |
3.206±0.029 |
3.893±0.013 |
0.964 |
0.984 |
| 0.2-0.3 |
3.534±0.033 |
3.741±0.023 |
0.921 |
0.932 |
| 0.3-0.4 |
2.856±0.085 |
3.606±0.021 |
0.872 |
0.913 |
| 0.4-0.5 |
2.31±0.18 |
3.489±0.030 |
0.853 |
0.913 |
| 0.5-0.8 |
1.43±0.44 |
3.184±0.044 |
0.810 |
0.914 |
Table 4 summarizes the results of the "raw" and "fitted" versions. The fitted centroids are even further from the center than the raw versions. The first two bins are still qualitatively similar, By the third bin, however, the differences are more magnified (though the largest pion-fraction difference is only 12%).
Figure 9
| 0.1 < z < 0.2 |
0.2 < z < 0.3 |
0.3 < z < 0.4 |
0.4 < z < 0.5 |
0.5 < z < 0.8 |
|
|
|
|
|
 |
 |
 |
 |
 |
For the first bin the fitted result makes far more sense to me. The raw electron peak seems far too wide for my taste. Aside from this, none of the results seem crazy. The fitted versions have narrower peaks, which I generally find more palatable. However, were it not for the results of Figs. 2 and 3 I would probably not question the raw results.
Bottom Line
My proposal would be to take the fitted results as the real values and some variation of the difference from the raw versions as the pion fraction systematic. There will also be a systematic from the uncertainty on the "non-pion" asymmetry portion of the correction. I am not really content to take the full and unquestioned difference from the raw fits as the systematic, as I simply do not believe some of their results. However, I think something along those lines could be reasonable. For the low-to-mid pT results, the effect will be completely negligible. Thus, I may decide to go with it for simplicity.