- drach09's home page
- Posts
- 2022
- 2020
- June (1)
- 2019
- 2018
- 2017
- 2016
- 2015
- 2014
- December (13)
- November (2)
- October (5)
- September (2)
- August (8)
- July (9)
- June (7)
- May (5)
- April (4)
- March (4)
- February (1)
- January (2)
- 2013
- December (2)
- November (8)
- October (5)
- September (12)
- August (5)
- July (2)
- June (3)
- May (4)
- April (8)
- March (10)
- February (9)
- January (11)
- 2012
- 2011
- October (1)
- My blog
- Post new blog entry
- All blogs
Run-11 Transverse Jets: Revisiting Trigger Bias (part III)
Updated on Tue, 2014-12-23 13:32. Originally created by drach09 on 2014-12-22 16:38.
Based upon my previous study, Renee has suggested a way to use the embedding studies to set limits on trigger bias. Here, I summarize these with a few tweaks since last time. Also, I post the first looks at x-coverage for the 2011 jet data.
Figure 1
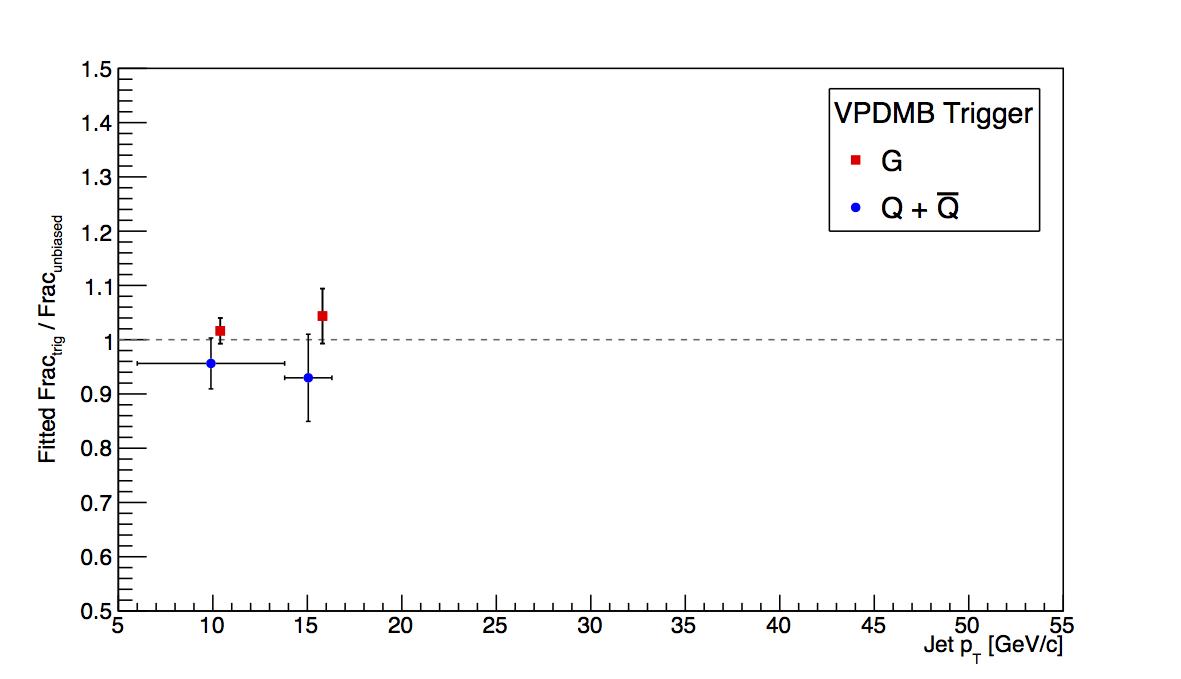
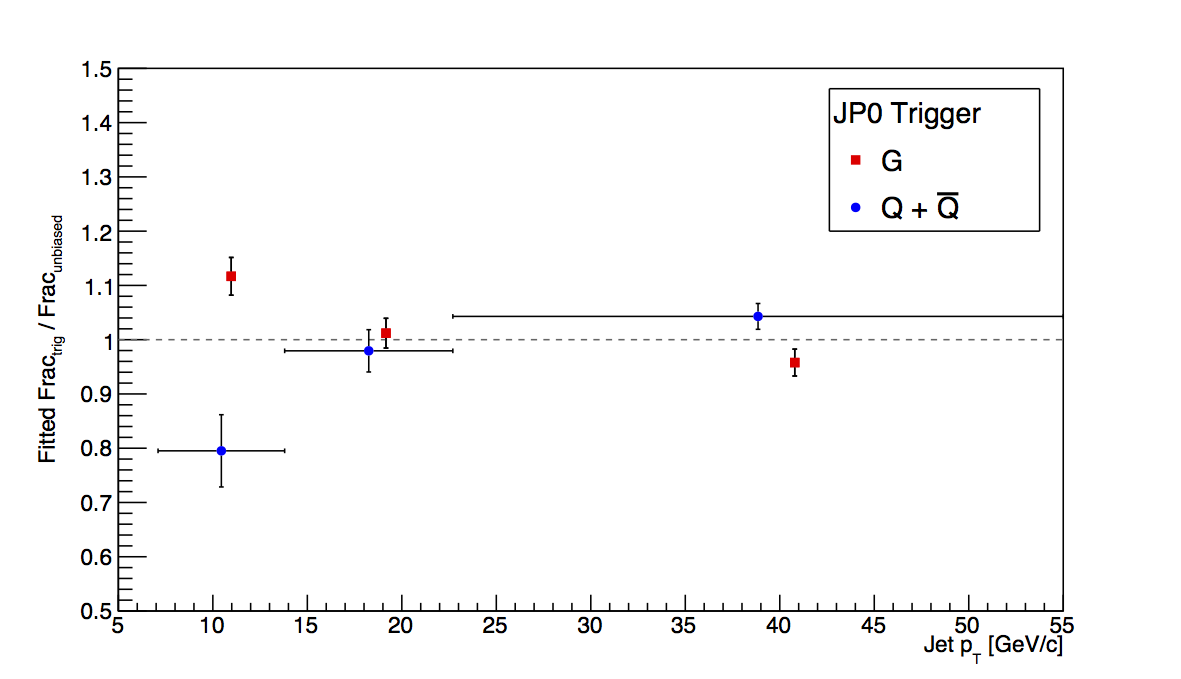
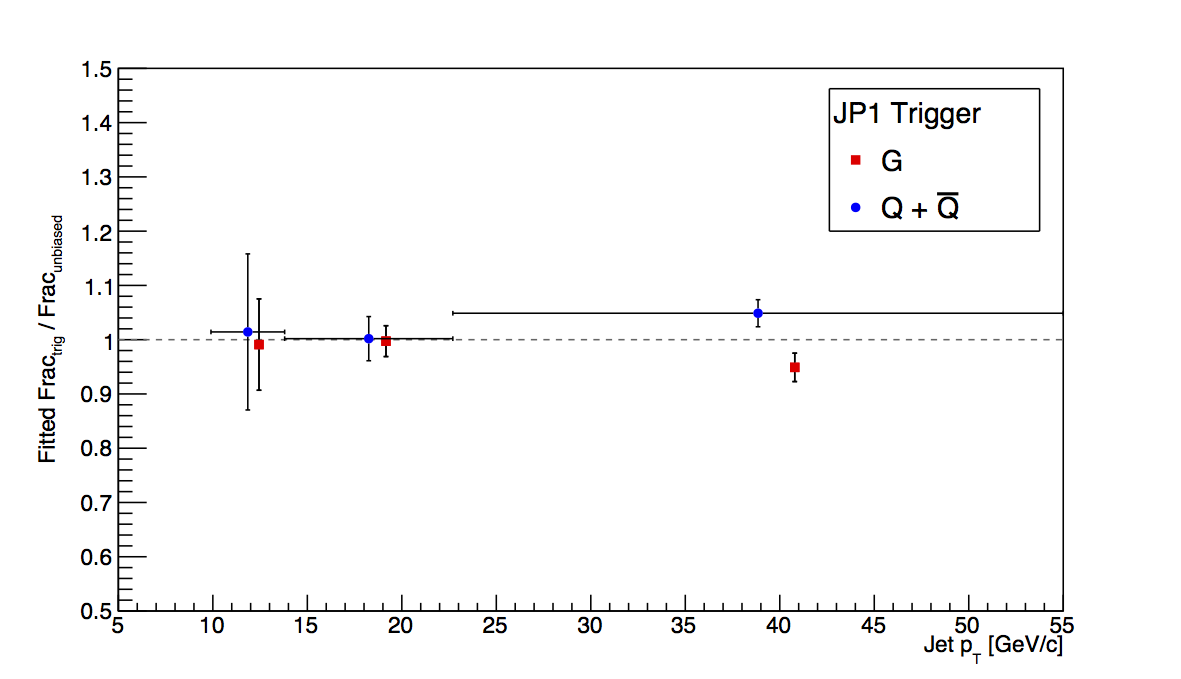
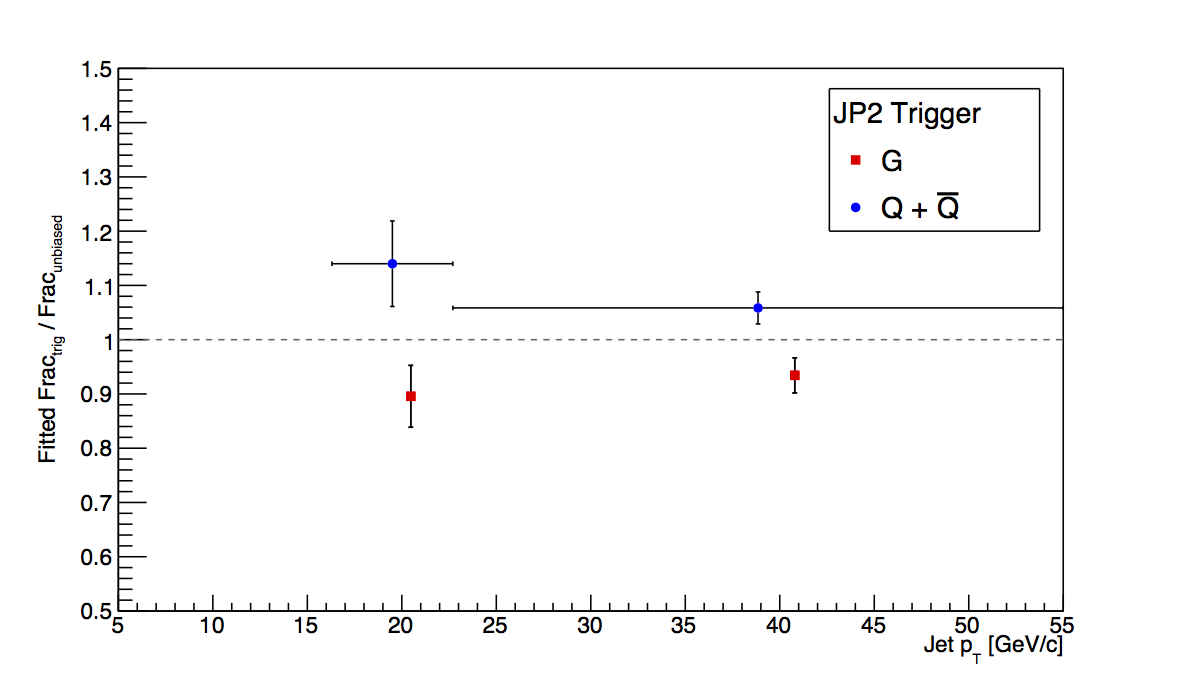
As before, I look at the ratio of triggered fractions to unbiased fractions averaging over the low, mid, and high pT ranges. Now, however, I separate only into quarks and gluons, i.e. combine quarks and anti-quarks. I do this, since for transversity effects, the total quark bias is the relevant quanity rather than the gluon bias. Table 1 summarizes the results.
Table 1: Fitted Ratios
| Trigger | Low pT (Quarks) | Mid pT (Quarks) | High pT (Quarks) | Low pT (Gluons) | Mid pT (Gluons) | High pT (Gluons) |
| JP0 | 0.795±0.067 | 0.979±0.039 | 1.043±0.024 | 1.117±0.035 | 1.012±0.027 | 0.958±0.025 |
| JP1 | 1.014±0.144 | 1.002±0.041 | 1.049±0.025 | 0.991±0.084 | 0.997±0.028 | 0.949±0.026 |
| JP2 | N/A | 1.140±0.079 | 1.059±0.030 | N/A | 0.896±0.057 | 0.934±0.032 |
We do not expect bias effects of more than 2-3% percent at high-pT. Unfortunately, our embedding sample is sufficiently limited to preclude firm conclusions beyond this order. The quark bias comes in at 6%±3% with our available statistics. Since 6% is higher than we expect and not a significant deviatiation from our expectation, 3% is perhaps an appropriate trigger bias systematic for high-pT Collins. For Sivers/ETQS and Collins-like, the gluon precision of 3% is probably also appropriate. Since the effects are small, I doubt even taking the full deviation of 7% would matter. For mid-pT, the choice is a bit more tricky, though I don't think it will matter, at the end of the day. The conservative approach would take the JP2 deviations--14% for quarks and 10% for gluons--while a case could be made for taking the uncertainties--8% for quarks and 6% for gluons. If this were a preliminary result, I would take the conservative approach. However, JP1 and JP0 contribute a non-negligible amount to mid-pT and their biases will be smaller than JP2 in this region. If I take a weighted average of the trigger bias, weighting each of the biases by their respective fractions of the mid-pT data (VPDMB-0.3%, JP0-13%, JP1-30%, and JP2-56%), I wind up with 7.7% bias for quarks and 5.8% for gluons. So, I am more inclined to take the weighted-average numbers that by chance happen to be equivalent to the uncertainties for JP2. For low-pT, I am quite unsure. The JP0 deviations just seem crazy. I am more inclined to take the JP1 uncertainties--14% for quarks and 8% for gluons. My proposal is summarized in Table 2.
Table 2: Bias Proposal
| pT Range | Collins | AN and Collins-like |
| Low | 17% | 10% |
| Mid | 8% | 6% |
| High | 3% | 3% |
For the above proposal, the trigger bias would be correlated across the full pT range. So, we should think about how to quote it and plot it. For example, we could fold it in with the polarization uncertainty as a scale systematic.
Figure 2
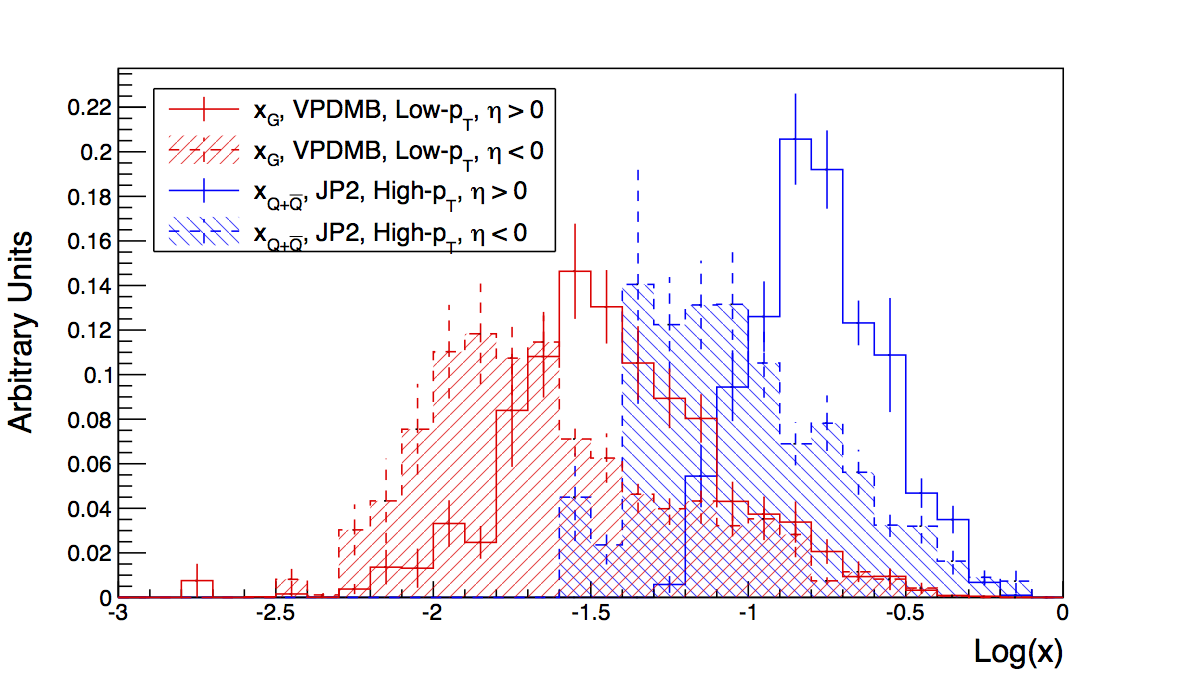
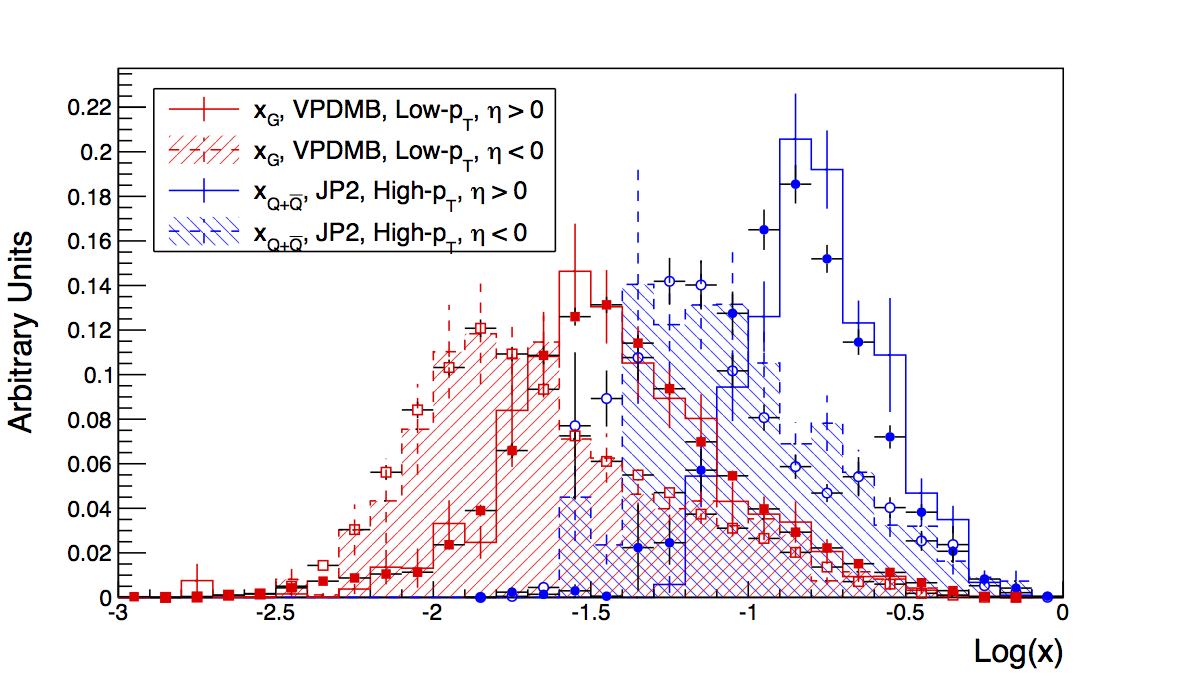
In Fig. 2 I plot the Log(x) distributions for a few of the most interesting cases: xG for low-pT VPDMB and xQ for high-pT JP2. Here, again, I combine anti-quarks with quarks for a total-quark distribution. For this study I have followed the procedure used by Kevin, Zilong, Mike, and Brian. I have matched detector jets all the way back to particles 7/8 in PYTHIA. Then, I fill the x distributions for the cases where lines 7 or 8 flavor match with lines 5 or 6. The η range is determined by the orientation of the jet to lines 5 or 6. The two plots are the same, except that in the right-hand case I have overlain the unbiased distribution in closed and open circles. You can readily see that the VPDMB case tracks the pure PYTHIA quite well. The only shifts should be from reconstruction effects. The JP2 distribution appears to be shifted a bit high, relative to the unbiased distribution, though statistics are pretty limited.
»
- drach09's blog
- Login or register to post comments