Run-11 Transverse Jets: TOF PID Plots
The PWGC preview for the 500 GeV IFF paper raised a concern about the contamination estimates based solely upon dE/dx information. The suggestion was to look at TOF information, where available. For this investigation, I look at particle mass using TOF timing coupled to TPC momentum within a modified nσ(π) (based upon the previous blog post). To be specific, the mass is computed as
where β is taken from the TOF information and the momentum, p, is the standard track momentum information. Both of these are stored in the standard data jet trees. The results are plotted separately for VPDMB and jet-patch triggered events. Finding a suitable set of functions to fit the peaks for extracting signal fractions is not trivial. In the end, the VPDMB mass peaks are fitted with a skewed Lorentz distribution and the kaons and protons with a skewed Gaussian. This function still does not adequately fit all of the peaks. The best job is done by fitting over a modified mass range, integrating the kaon and proton peaks and taking one minus the ratio of the integral with the total yield. The JP events are fitted with three skewed Lorentz distriutions. Results are detailed, below.
VPDMB Events
First, I will take the VPDMB events by themselves.
Figure 1: High pT
| 13.8 < pT < 22.6 GeV/c | 22.6 < pT < 55 GeV/c |
 |
 |
As is clear, from Fig. 1, it is difficult to learn much from TOF above the "low" pT region. The timing resolution degrates substantially for high momentum tracks. The 0.1 < z < 0.2 bin for "mid" pT shows a bit of a proton peak, but it is very difficult to discern a kaon peak from the pions. Using the fits to separate pions and kaons should be viewed with heaping piles of skepticism.
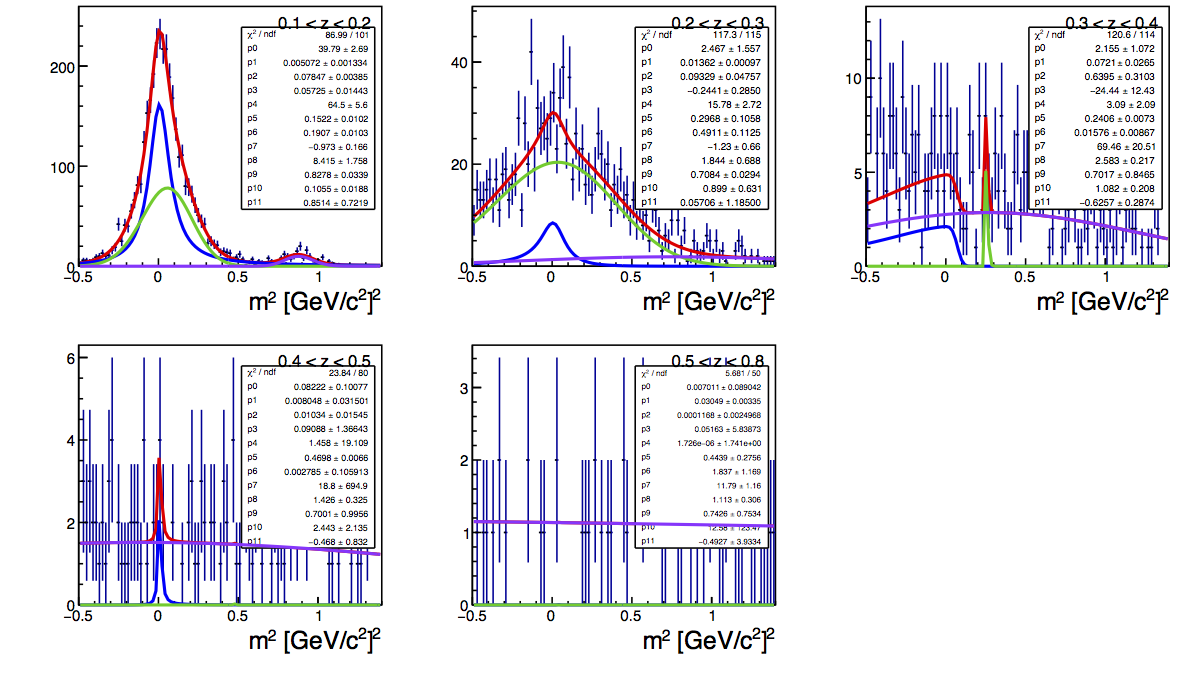
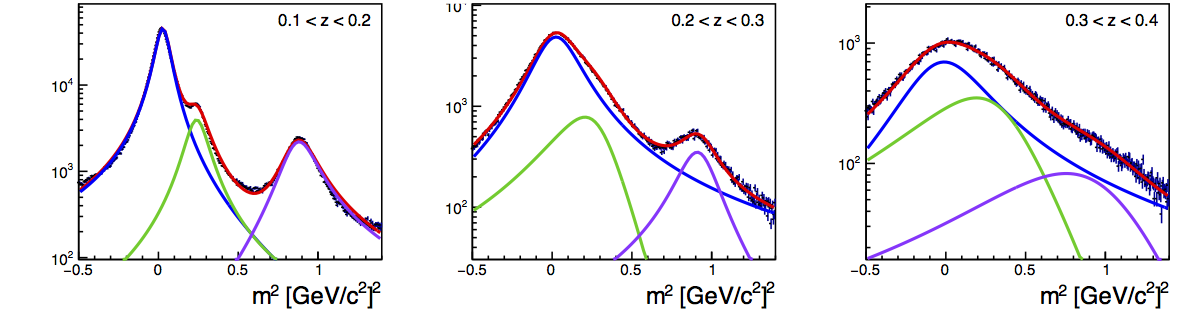
Figure 2: Low pT
| 6 < pT < 13.8 GeV/c |
 |
VPDMB give very clear kaon and proton peaks in the low-z bins at low-pT. In the 0.3 < z < 0.4 bin, the proton peak is clearly defined; but the kaons slide under the pions or disappear or some combination of both. Though it is difficult to tell from the figure, the pion peak fits are not satisfactory. Similarly, the kaon fits should be improved. In principle it is not necessary to have a full fit of the three peaks. If the kaon and proton peaks can be fit well with a reasonable accounting for the pion tails, the signal fraction can be extracted by calculating the fractions of kaons and protons from the fits relative to the total histogram yields. One attempt to do this was to restrict the fit range to the high-mass side of the pion peak and above. The results are shown, below.
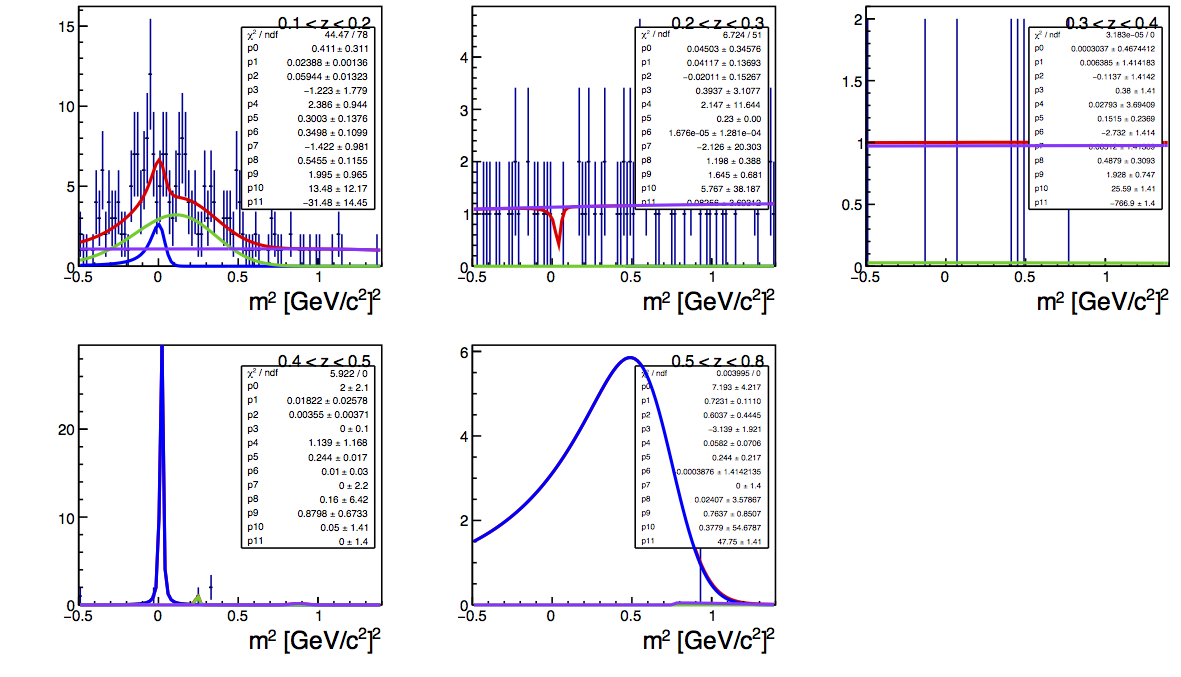
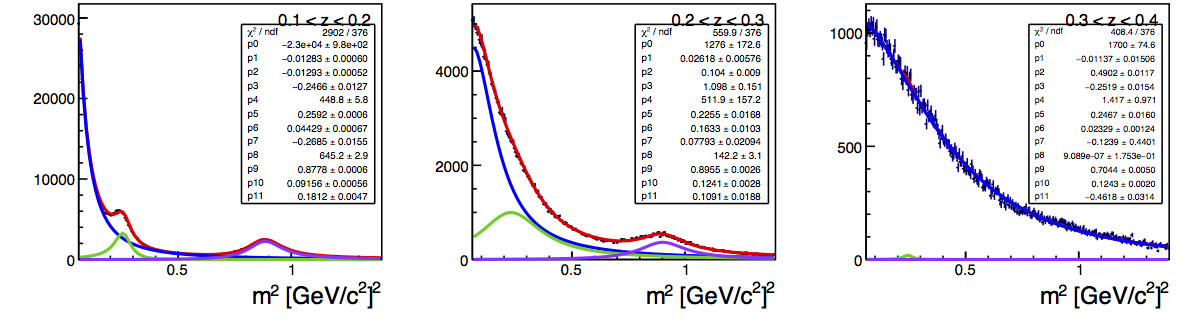
Figure 3: Adjusting Fit Ranges
| 6 < pT < 13.8 GeV/c (Fit Over mass > 0.06 GeV/c2) |
 |
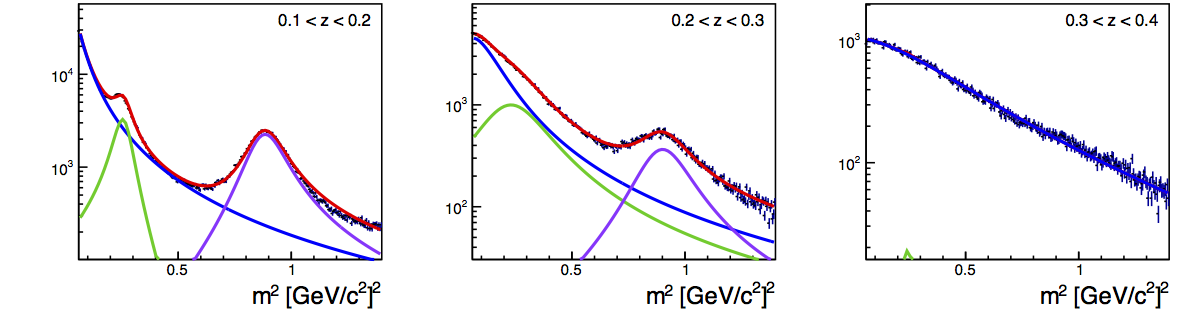
| 6 < pT < 13.8 GeV/c (Fit Over mass > 0.06 GeV/c2 with log(y) Scale) |
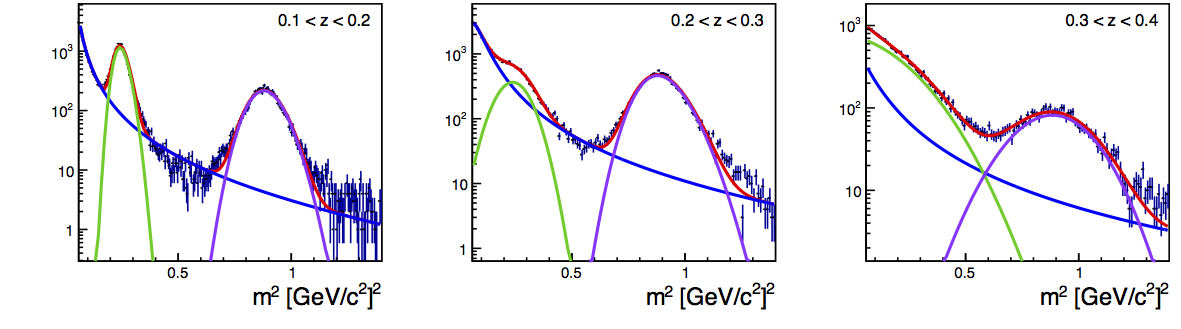 |
The adjusted ranges are shown only for the three bins where it may be possible to learn something from the TOF information. The fits are shown with linear and log(y) scales. The fits are still not perfect, e.g. the 0.1 < z < 0.2 bin shows that the pion tail may still be a bit high. The effects of such errors in the first two z-bins must be small, at this point. The fit of the 0.3 < z < 0.4 bin is still difficult to believe.
Table 1
| z-Range | Pion Fraction | Kaon Fraction | Proton Fraction | Pion Fraction (alt) | Kaon Fraction (alt) | Proton Fraction (alt) |
| 0.1-0.2 | 0.8898 | 0.0759 | 0.0342 | 0.8784 | 0.0837 | 0.0378 |
| 0.2-0.3 | 0.8246 | 0.0760 | 0.0993 | 0.8254 | 0.0661 | 0.1084 |
| 0.3-0.4 | 0.2146 | 0.6868 | 0.0987 | -1.29 (nonsense) | 2.22 (nonsense) | 0.0729 |
Table 1 shows the extracted particle fractions from the TOF PID plots. Kaon and proton fractions are determined by integrating the kaon and proton functions and dividing by the histogram entries (scaling for binwidth). The pion fractions are determined by subtracing the kaon and proton fractions from unity. The "alt" fractions are from the fits over the truncated mass range. The kaon and proton integrals for these fits are still taken over the full range of mass. This leads to nonsensical pion and kaon results in the 0.3-0.4 bin, but seems to give perfectly reasonable results for the other bins. For reference, the 0.1 < z < 0.2 bin at mid-pT returns a proton contamination of 0.0305.
Jet-patch Triggered Events
Next, I will consider the jet-patch triggered events and compare them to the VPDMB events. I should point out two considerations: First, if I understand correctly, the VPDMB events will naturally tend to have better resolution than JP-triggered events (the specific reason escapes me, at the moment, but Carl can readily jog my memory...sorry!). Second, the mean jet pT within the z bins will be different for the two sets. This could lead to different contaminations for the separated events ensembles. However, it may be okay to evaluate the contamination simply from the combined sample, at least, for the z-bins.
Figure 4: High-pT Comparison
| Jet-patch Triggers | VPDMB Triggers |
 |
|
Virtually all of the high-pT statistics are from the JP samples. While this makes it much easier to evaluate the mass distributions, the resolution is too far gone for the information to be useful.
Figure 5: Mid-pT Comparison
| Jet-patch Triggers | VPDMB Triggers |
 |
|
Again, mid-pT staistics are much more plentiful in JP events. The conclusion is the same as in the VPDMB set. The 0.1-0.2 bin shows a discernable proton peak, but kaons are virtually impossible to decipher. Any extractions based solely on the fit results should be taken with healthy doses of NaCl. According to the fits, the proton contamination is 0.0228 in the JP sample. Compare this to 0.0305, as found in the VPDMB fits.
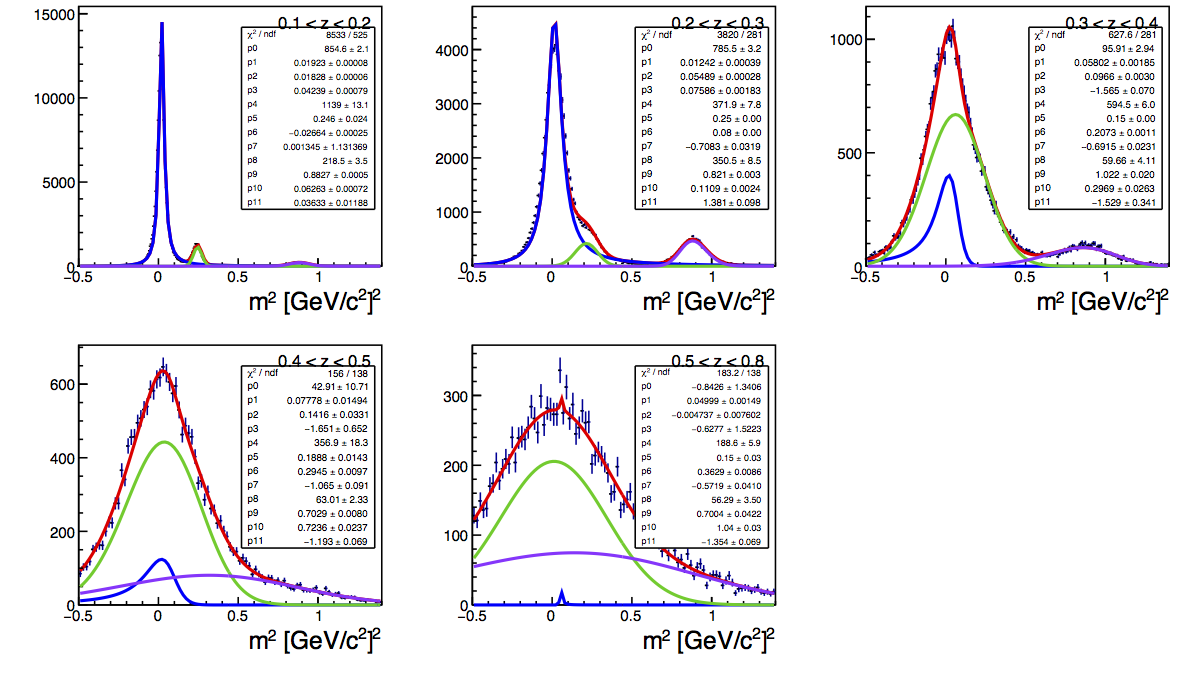
Figure 6: Low-pT Comparison
| Jet-patch Triggers | VPDMB Triggers |
 |
|
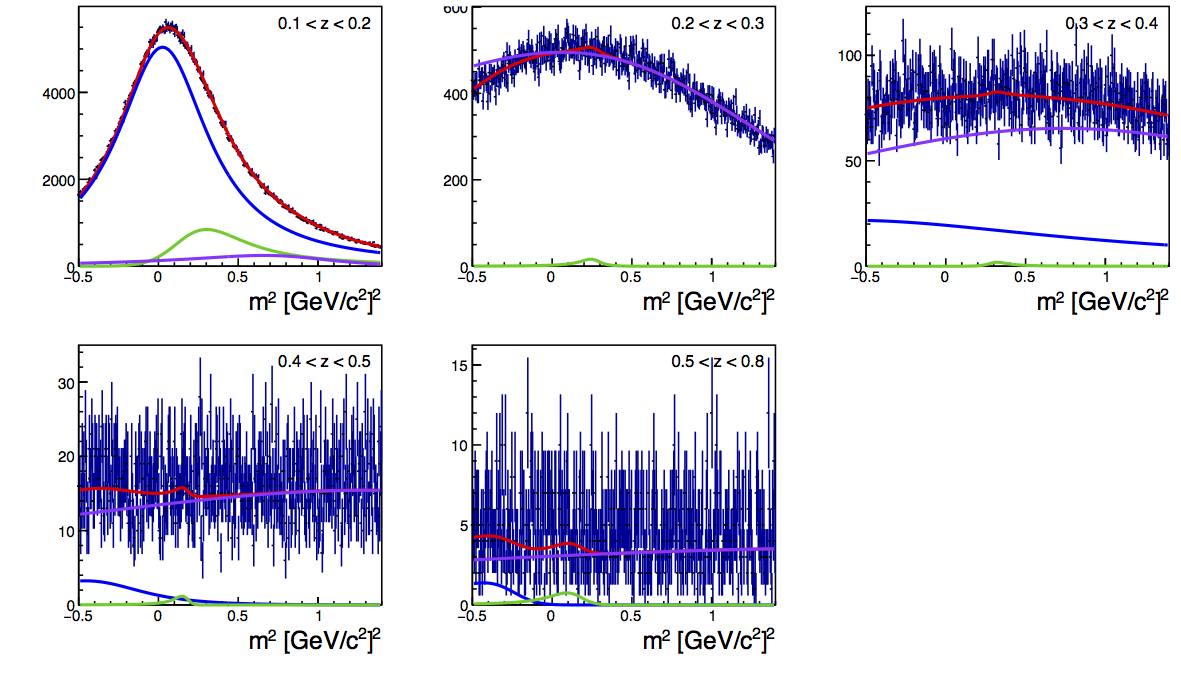
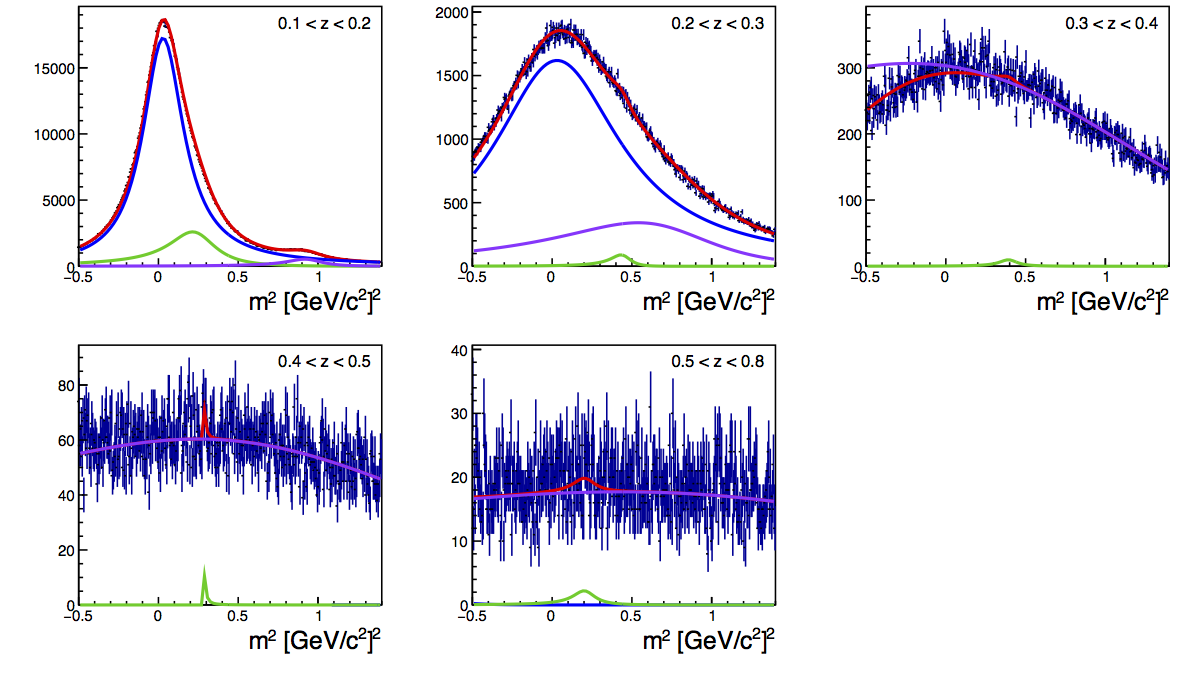
The low-pT distributions show the most obvious mass structure. The resolution is considerably degraded relative to the VPDMB events, which is expected. The proton peak in the JP sample is enhanced relative to the VPDMB sample. This probably reflects the shift in the average jet pT. The kaon peak is basically absorbed by the pions by the 0.2-0.3 bin. By the 0.3-0.4 bin, the resoluton has degraded sufficiently to hide the proton peak.
Figure 7: Log(y) of Low-pT
The JP-triggered events share a similar feature with the VPDMB events in that it is difficult to fit all of the peaks satisfactorily across the full mass range. One can see this in Fig. 7. For example, the fit overshoots the data on the low-mass side of the kaon peak. Also, it overshoots a bit on the high-mass side of the kaon peak. I conclude that this may be overestimating the kaon contribution. To navigate this feature, I fit across the 0.06-2 GeV/c range and calculate fractions using the kaon and proton integrals and the total event number from the histograms. The details of the relevant fits are in Fig. 8.
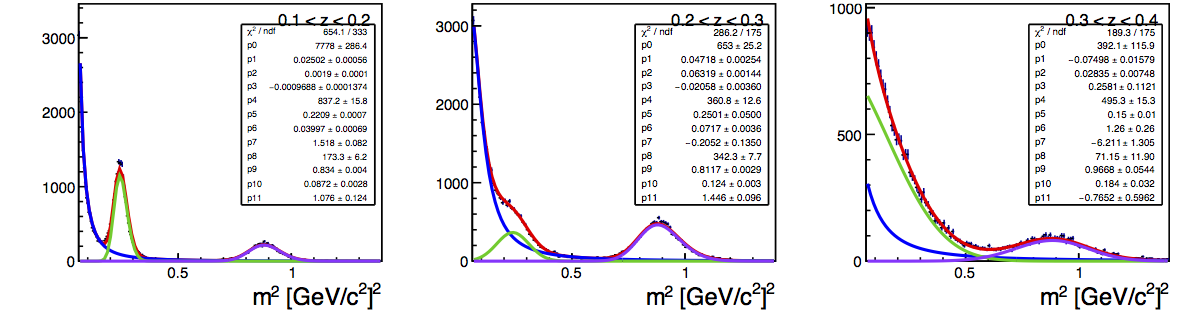
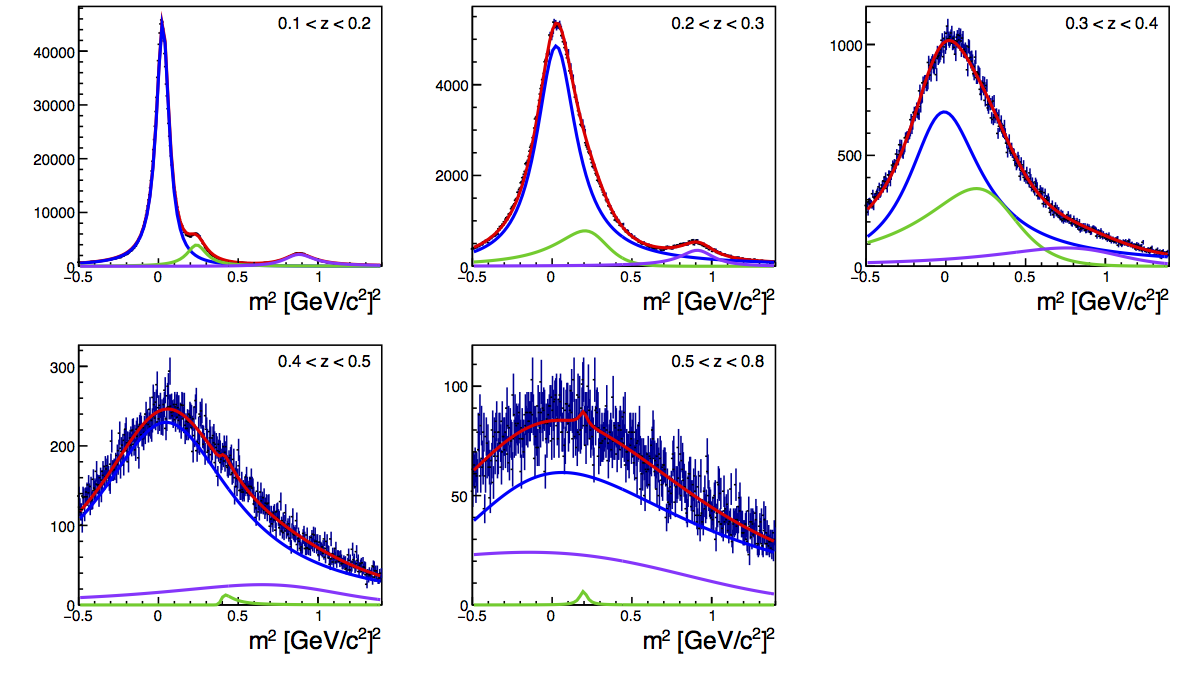
Figure 8: Adjusting Fit Ranges
| JP-Triggered 6 < pT < 13.8 GeV/c (Fit Over mass > 0.06 GeV/c2) | VPDMB 6 < pT < 13.8 GeV/c (Fit Over mass > 0.06 GeV/c2) |
 |
|
| JP-Triggered 6 < pT < 13.8 GeV/c (Fit Over mass > 0.06 GeV/c2 with log(y) Scale) | VPDMB 6 < pT < 13.8 GeV/c (Fit Over mass > 0.06 GeV/c2 with log(y) Scale) |
 |
|
One can see that for the JP events, the 0.3-0.4 bin is almost entirely detail-free. There appears to be a very slight dimple around the proton mass, but certainly not enough to extract reliable fit information. It is difficult to find a kaon peak in the 0.2-0.3 bin, though the proton information may be usable. The fit for the 0.1-0.2 bin is relatively good. Comparing ot the VPDMB events, the kaon peak is not as pronoucned. Using Lorentz functions for the kaons and protons leads to better fits for the overall distribution. The shape allows the protons to contribute more at the high-mass end of the spectrum and may represent a bit of an overestimate of its contamination. To explore this, I tried a fit using a Gaussian function for the protons. This fit of the proton peak was not nearly as good. It did allow the high-mass pion tail to rise, but this led to overshooting the data between the kaon and proton peaks. The net result was that the proton contribution went from 7.2% to 5.3% of the total yield. I conclude that this change of the fit function is not justified, in general.
Table 2
| z-Range | Pion Fraction | Kaon Fraction | Proton Fraction | Pion Fraction (alt) | Kaon Fraction (alt) | Proton Fraction (alt) |
| 0.1-0.2 | 0.8078 | 0.1052 | 0.0869 | 0.8760 | 0.0518 | 0.0722 |
| 0.2-0.3 | 0.8026 | 0.1478 | 0.0497 | 0.7748 | 0.1764 | 0.0488 |
| 0.3-0.4 | 0.5783 | 0.3198 | 0.1019 | 0.9985 | 0.0015 | 0.0000 |
Table 2 presents the extracted particle fractions for jet-patch-triggered events. The results of the 0.3-0.4 fits should not be believed, but are presented here for completeness.
Table 3: Full Mass Range Fits
| z-Range | Pion Fraction (VPDMB) | Pion Fraction (JP) | Kaon Fraction (VPDMB) | Kaon Fraction (JP) | Proton Fraction (VPDMB) | Proton Fraction (JP) |
| 0.1-0.2 | 0.8898 | 0.8078 | 0.0759 | 0.1052 | 0.0342 | 0.0869 |
| 0.2-0.3 | 0.8246 | 0.8026 | 0.0760 | 0.1478 | 0.0993 | 0.0497 |
| 0.3-0.4 | 0.2146 | 0.5783 | 0.6868 | 0.3198 | 0.0987 | 0.1019 |
Table 3 presents the VPDMB-JP comparison for extracted particle fractions for the fitting the full range of mass.
Table 4: Modified Mass Range Fits
| z-Range | Pion Fraction (VPDMB) | Pion Fraction (JP) | Kaon Fraction (VPDMB) | Kaon Fraction (JP) | Proton Fraction (VPDMB) | Proton Fraction (JP) |
| 0.1-0.2 | 0.8784 | 0.8760 | 0.0837 | 0.0518 | 0.0378 | 0.0722 |
| 0.2-0.3 | 0.8254 | 0.7748 | 0.0661 | 0.1764 | 0.1084 | 0.0488 |
| 0.3-0.4 | -1.29 (nonsense) | 0.9985 | 2.22 (nonsense) | 0.0015 | 0.0729 | 0.0000 |
Table 4 presents the VPDMB-JP comparison for extracted particle fractions for the fitting from the high-mass slope of the pions and upward.
- drach09's blog
- Login or register to post comments