- drach09's home page
- Posts
- 2022
- 2020
- June (1)
- 2019
- 2018
- 2017
- 2016
- 2015
- 2014
- December (13)
- November (2)
- October (5)
- September (2)
- August (8)
- July (9)
- June (7)
- May (5)
- April (4)
- March (4)
- February (1)
- January (2)
- 2013
- December (2)
- November (8)
- October (5)
- September (12)
- August (5)
- July (2)
- June (3)
- May (4)
- April (8)
- March (10)
- February (9)
- January (11)
- 2012
- 2011
- October (1)
- My blog
- Post new blog entry
- All blogs
Run-11 Transverse Jets: Transverse Momentum Shifts, Part 2 (Full Embedding)
Here, I post the status of the pT-shift and uncertainty calculation. The uncertainties consider the full suite of systematics:
- BEMC gain uncertainty
- BEMC efficiency uncertainty
- Track momentum uncertainty
- BEMC track uncertainty
- pT shift statistical uncertainty
- Difference between shifts calculated with 100% tracking and 93% tracking efficiency
- Difference between shifts calculated with the nominal trigger threshold and the nominal threshold + 3 ADC counts
For the central values, I have used the "nominal+3" version. In a forthcoming post, I will explain the logic for this choice. I have also calculated the shifts by finding the average shift between detector jets and particle jets or parton jets and taking the shift from the mean of the data.
Figure 1: pT-shifts and Total Uncertainties
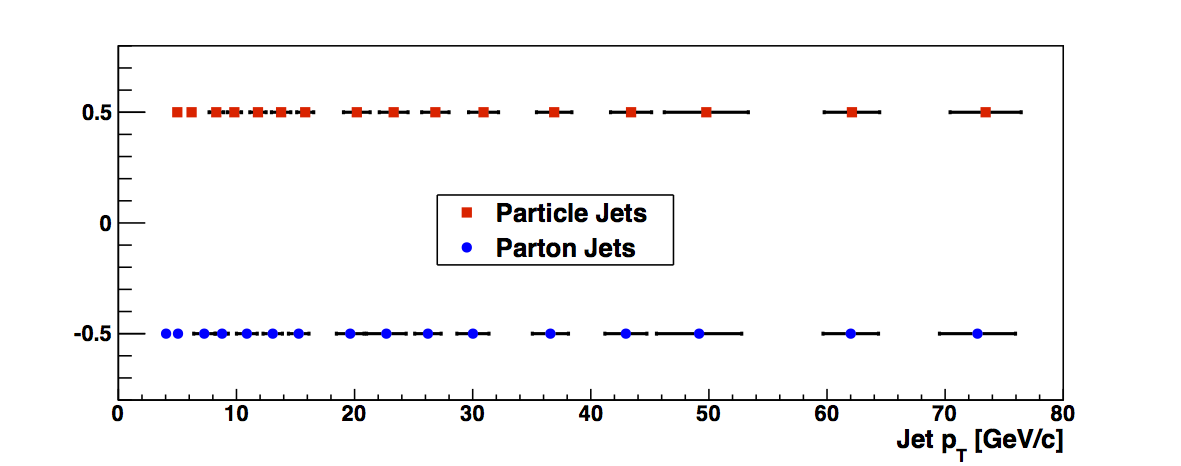
In Fig. 1 I show the corrected parton-jet and particle-jet pT values with their total uncertainties. The final range for release is to be determined.
Data-to-Embedding Comparisons with Augmented Embedding Trigger Thresholds
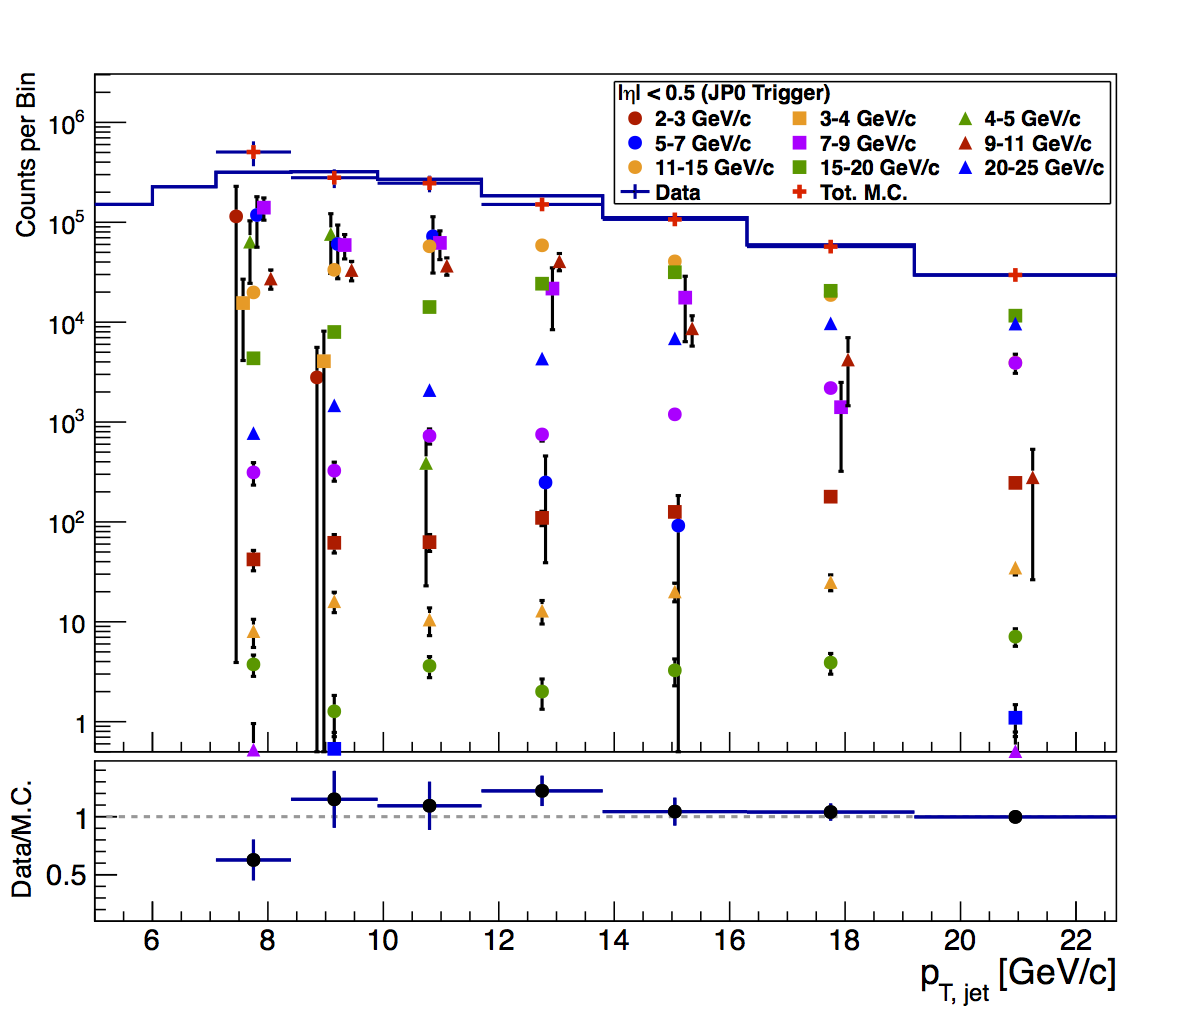
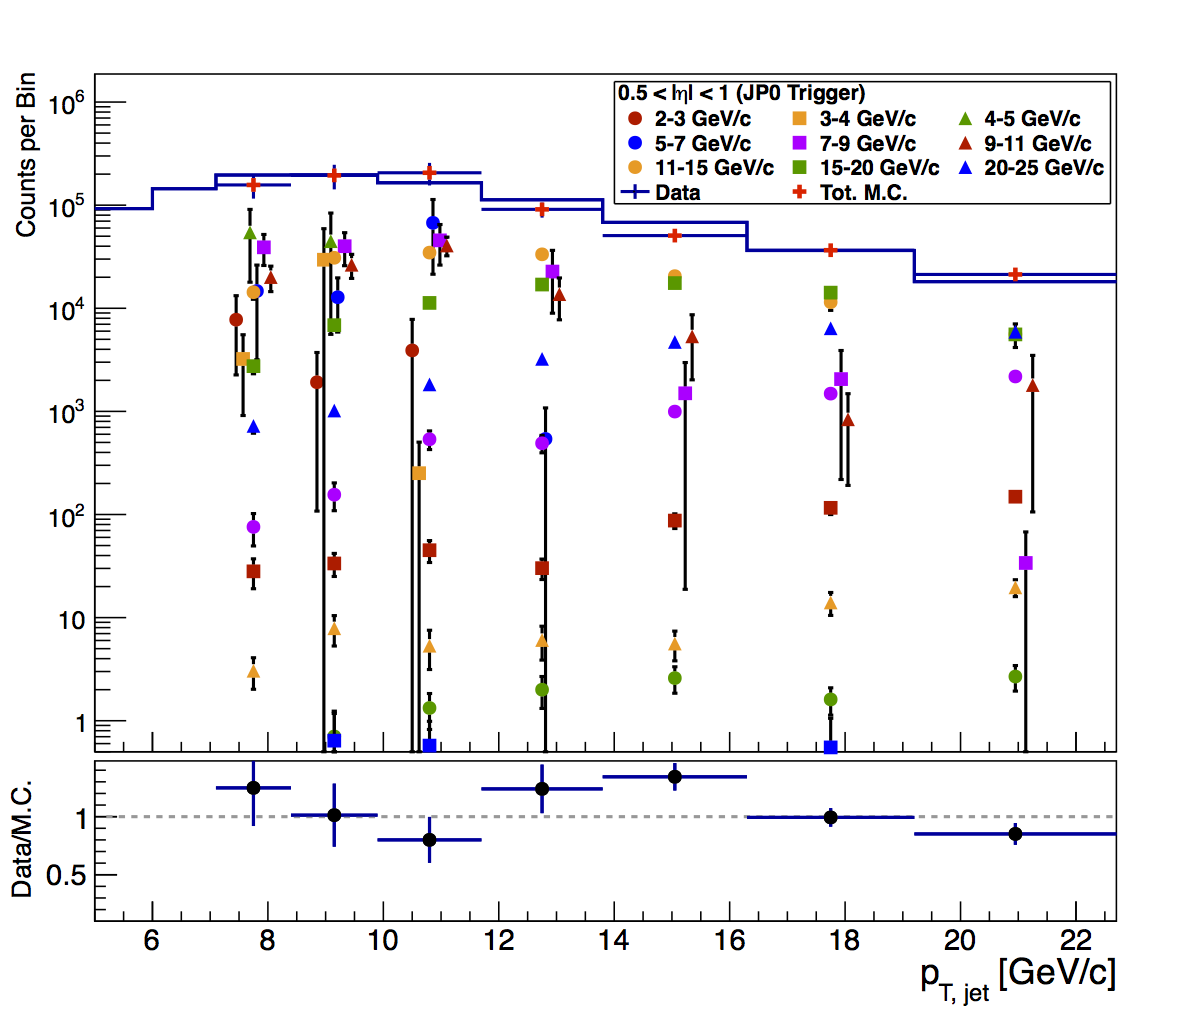
Here, I show the updated data-embedding comparisons, now augmenting the embedding jet-patch trigger thresholds by three ADC counts. The data are left at the nominal values.
Figure 2: JP0
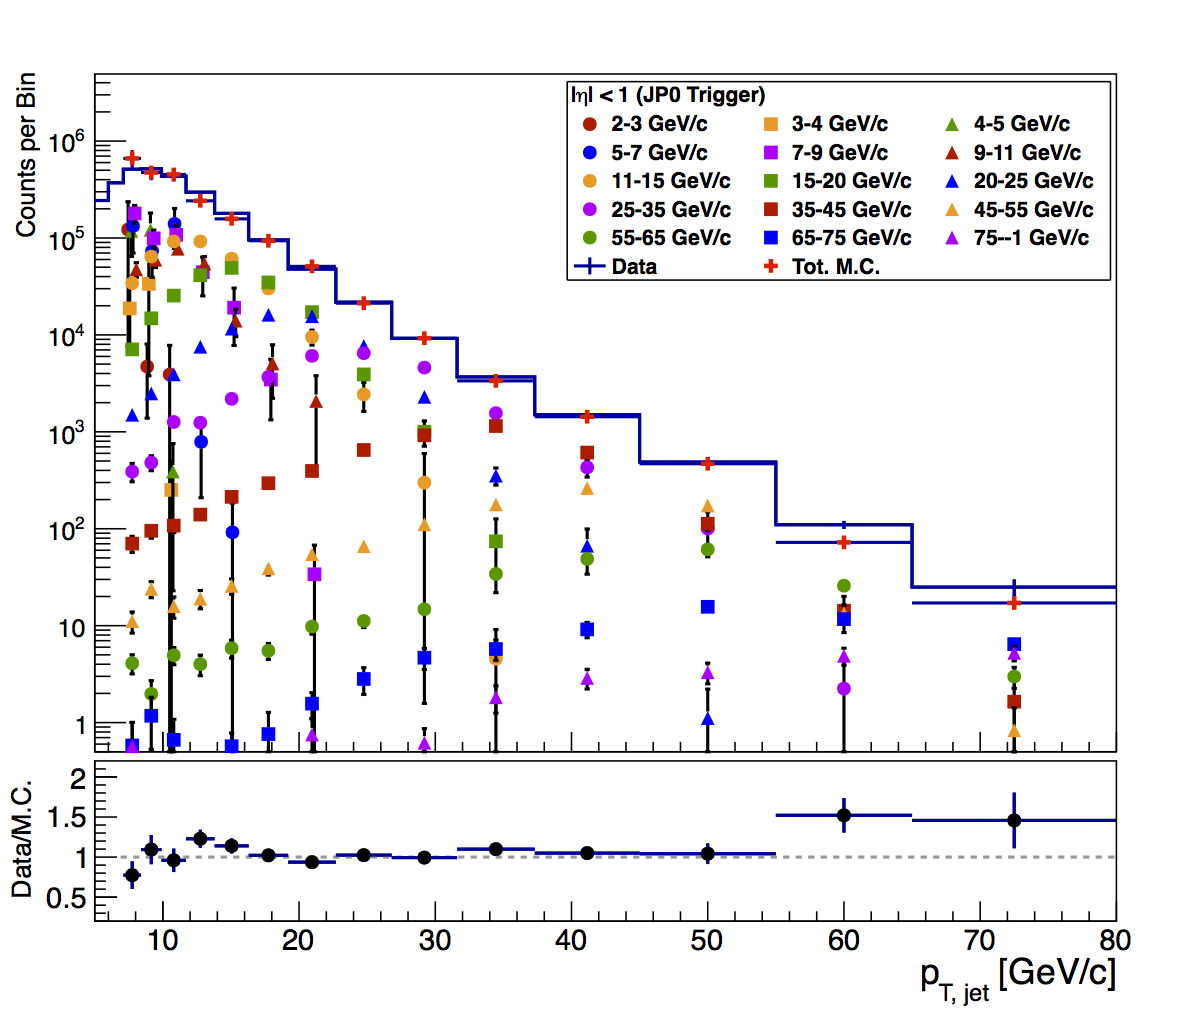
NOTE: I have cut off the simulation at 7.1 GeV/c, unlike before. One can, now, see the agreement near the JP0 threshold is vastly improved.
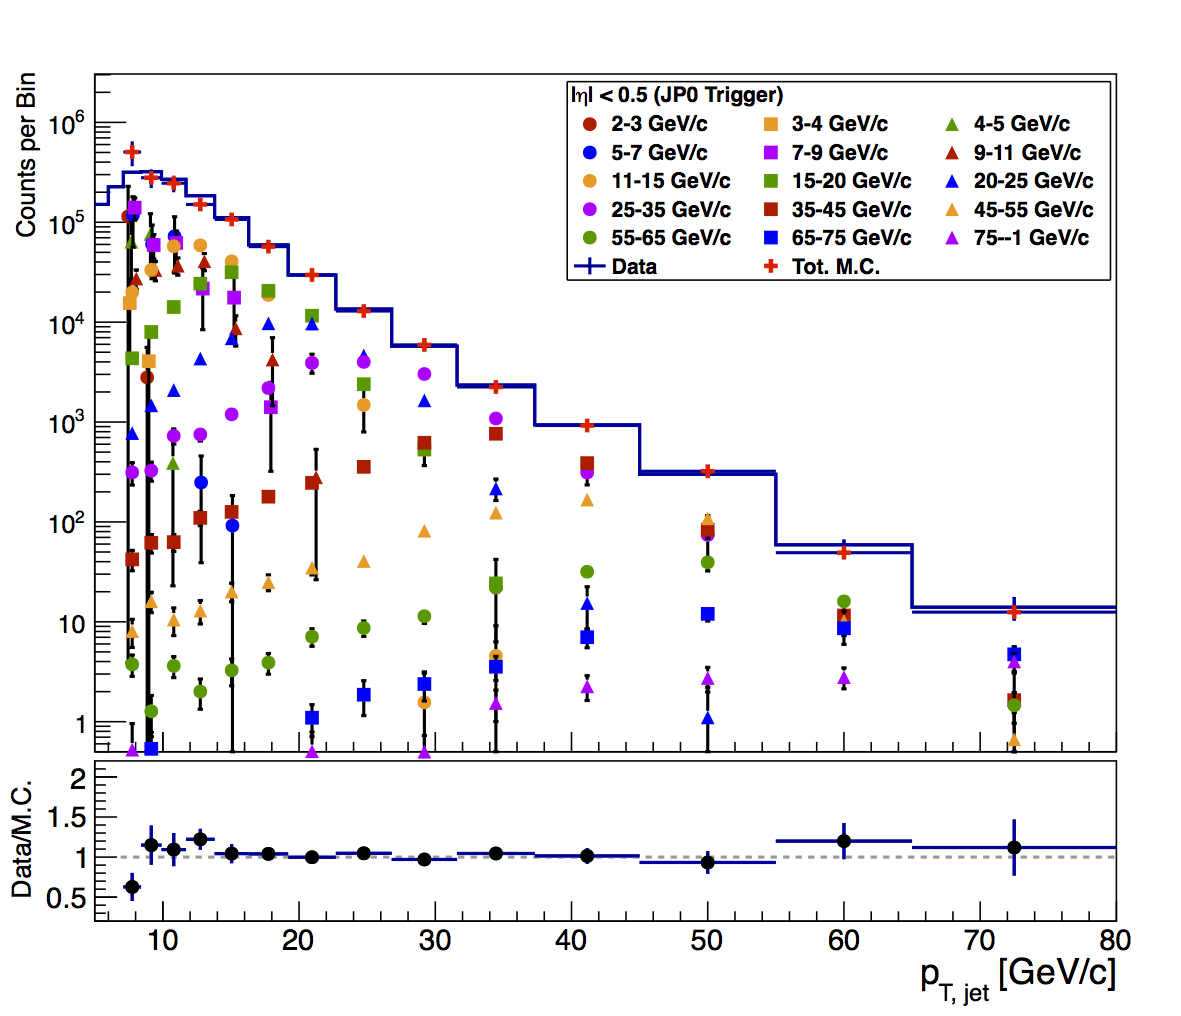
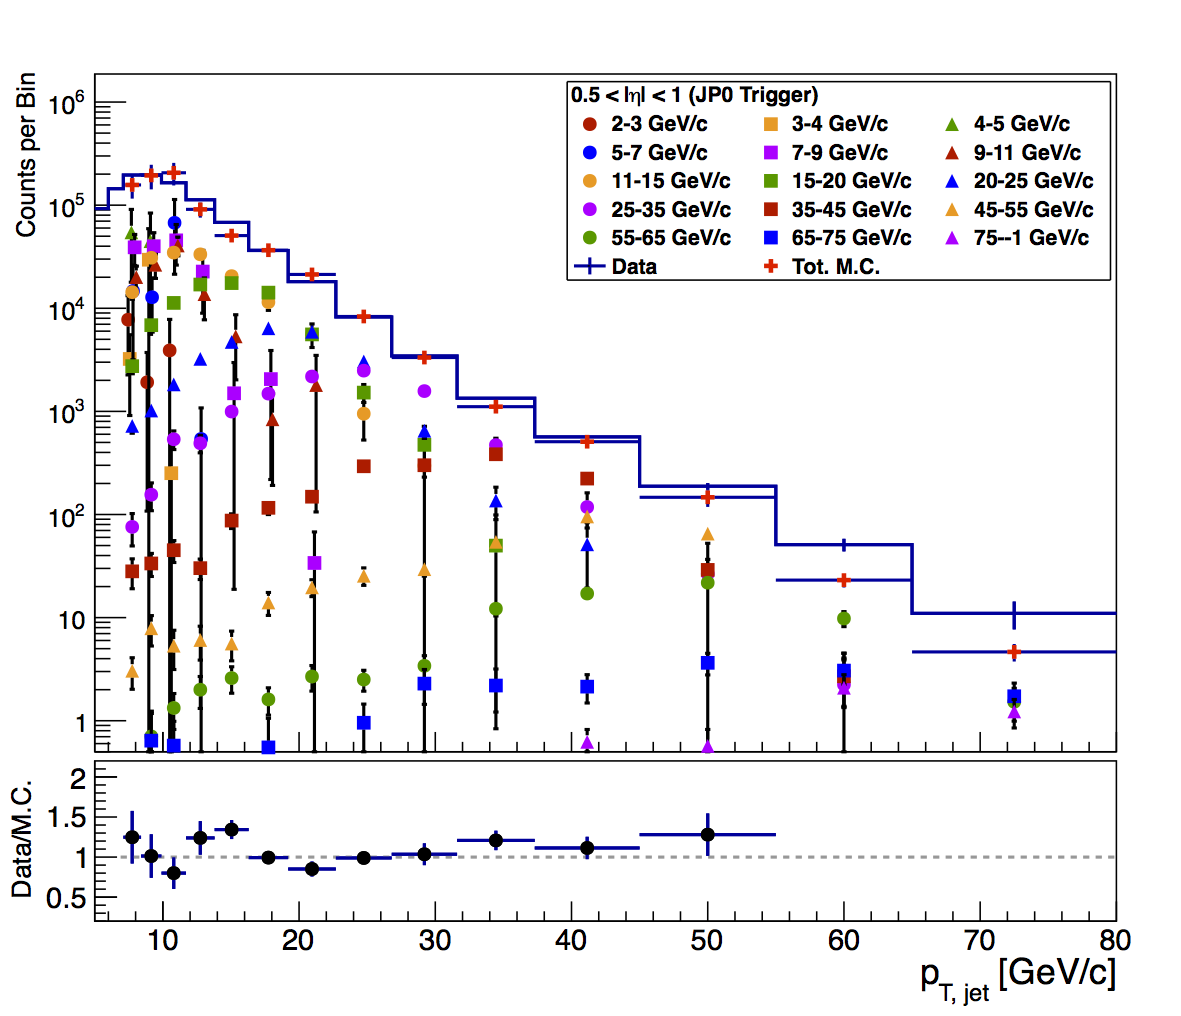
Figure 3: JP0 (Focus on Low pT)
| ADC+3 | ADC+0 |
 |
.png) |
 |
.png) |
NOTE: The absolute normalization is slightly changed between the two versions. Comparing the two, one can see that the augmentation of the trigger threshold has preferentially discarded jets from lower partonic pT. This has reduced the low-pT enhancement relative to the data.
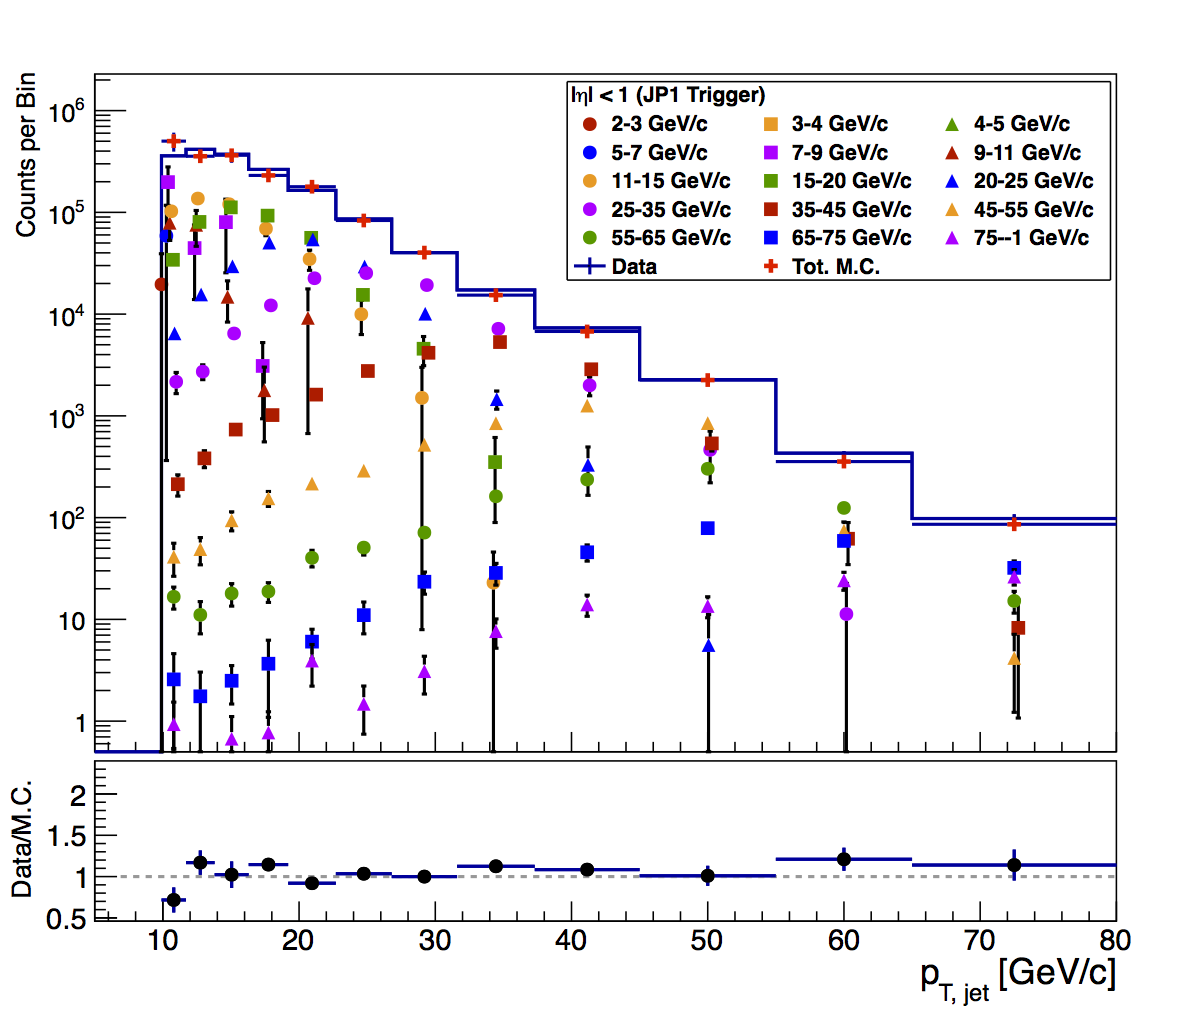
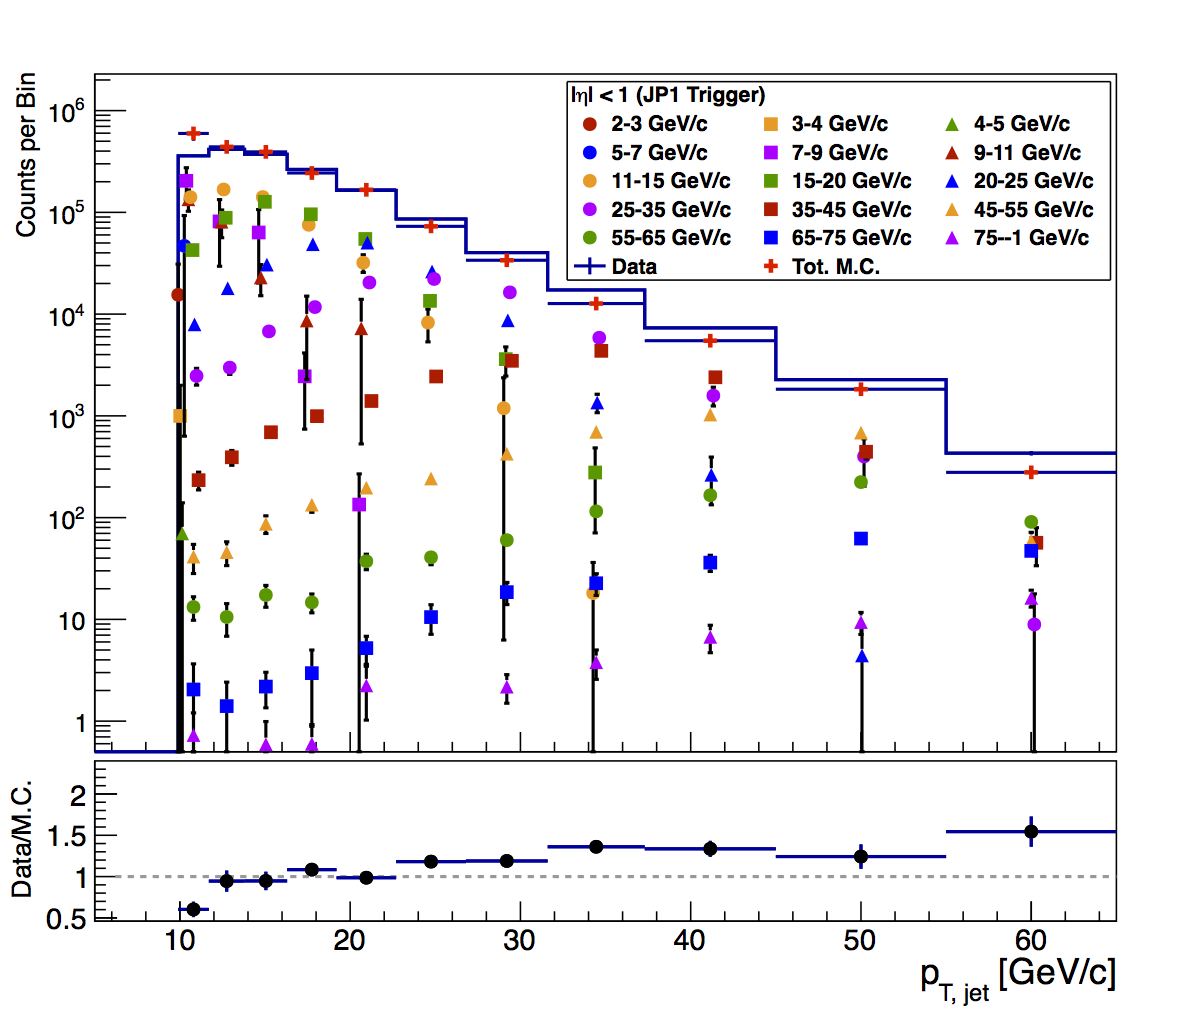
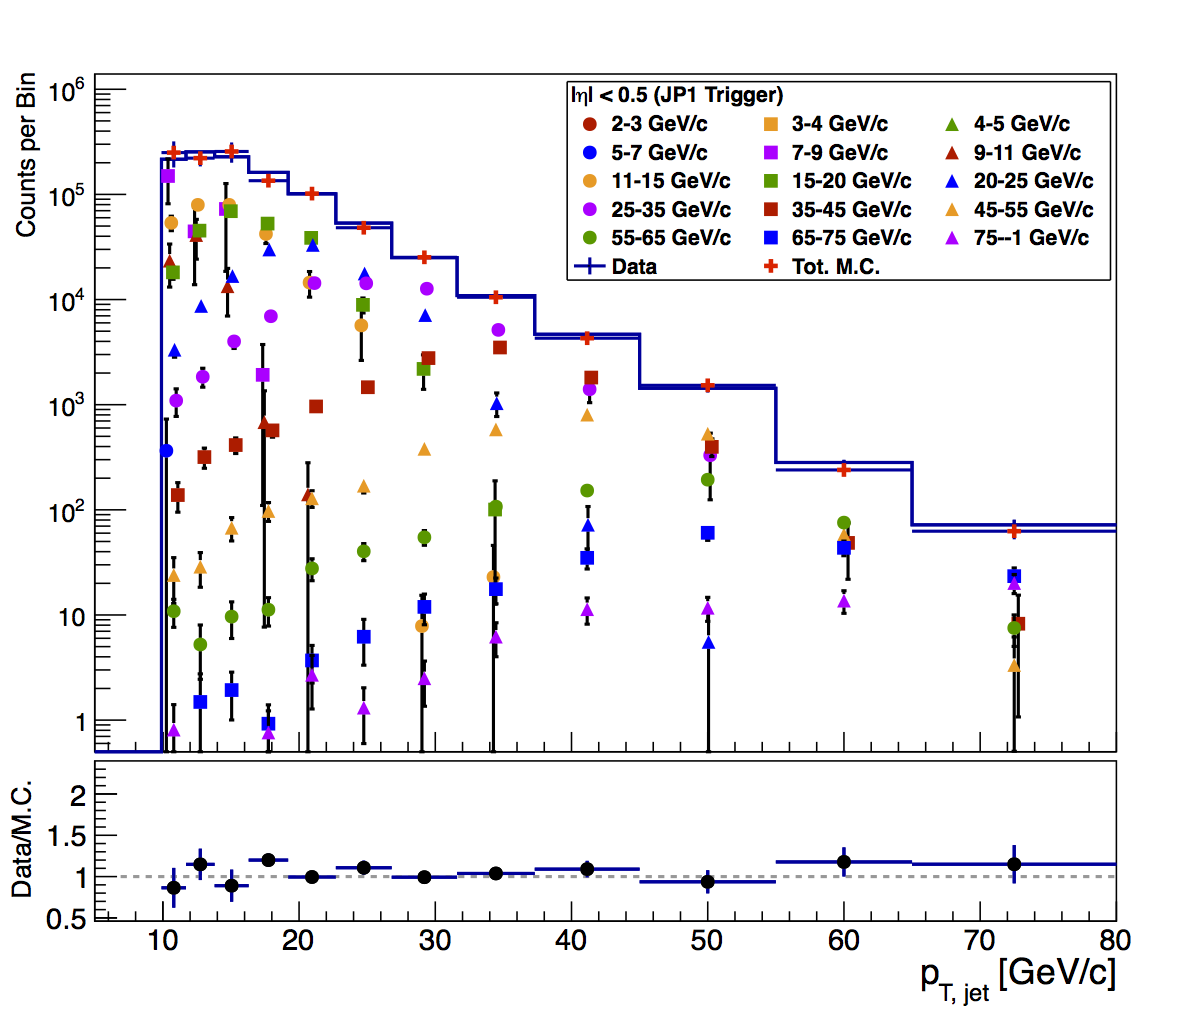
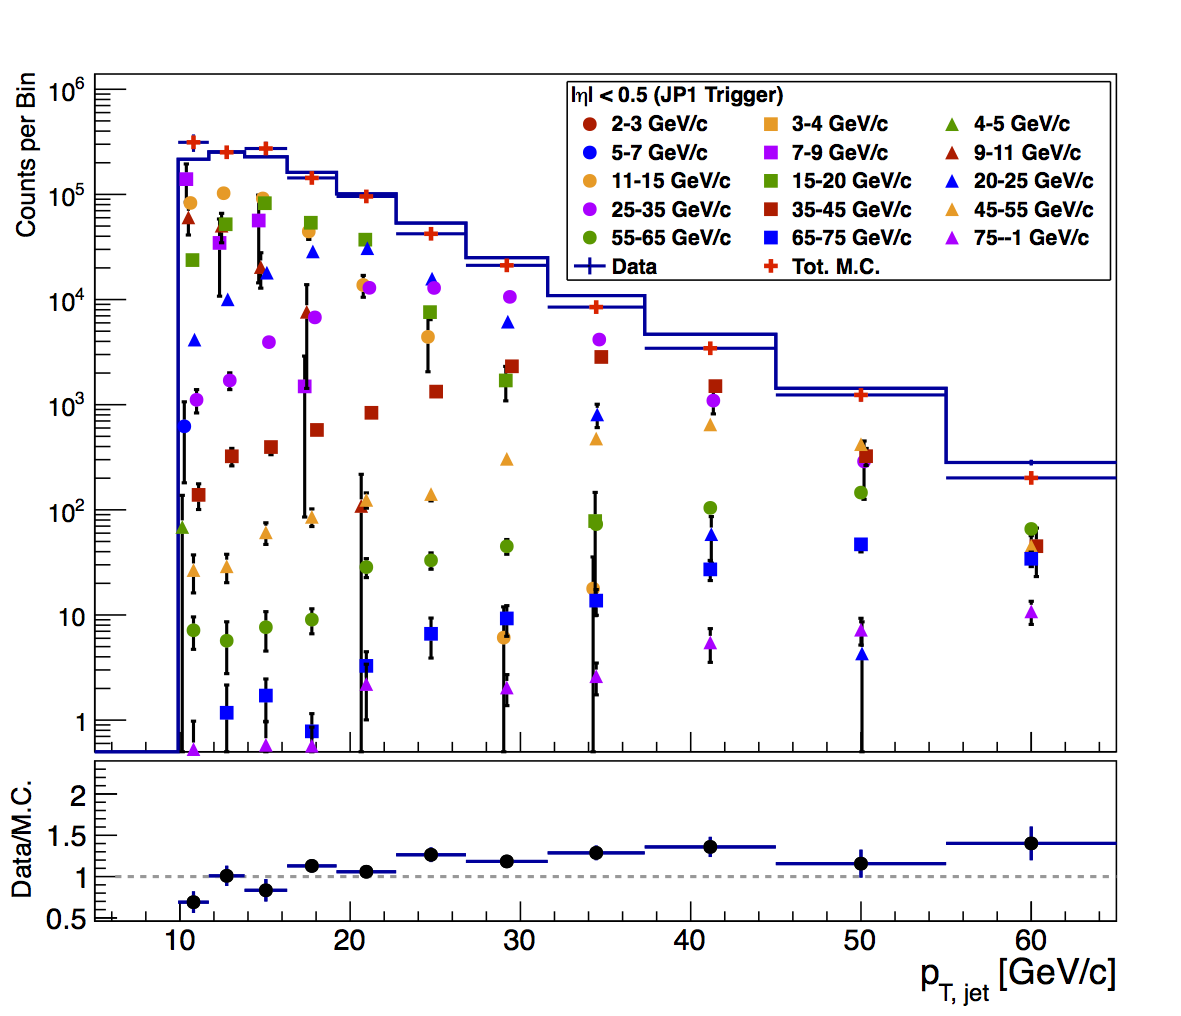
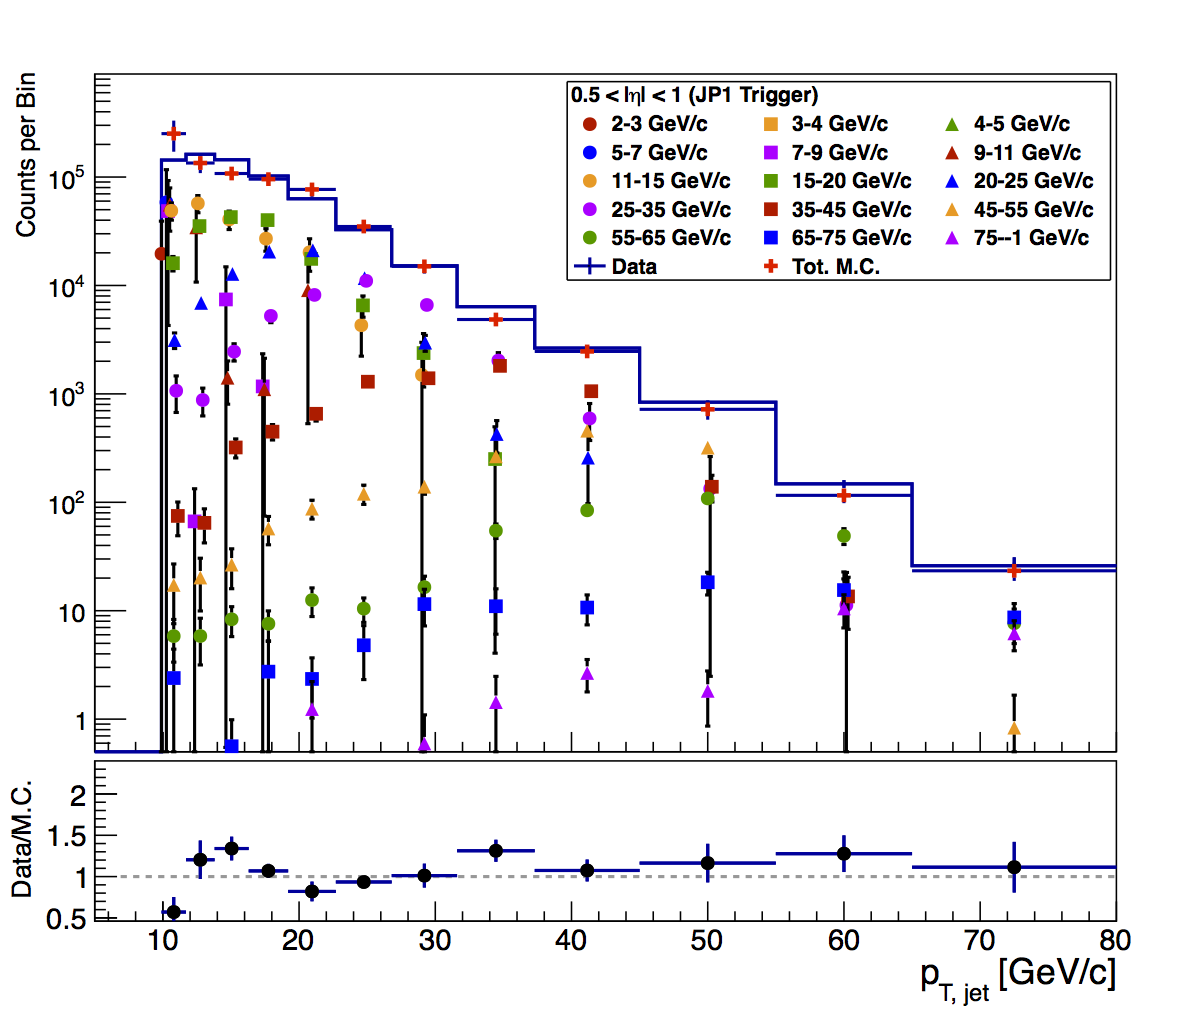
Figure 4: JP1
| ADC+3 | ADC+0 |
 |
 |
 |
 |
 |
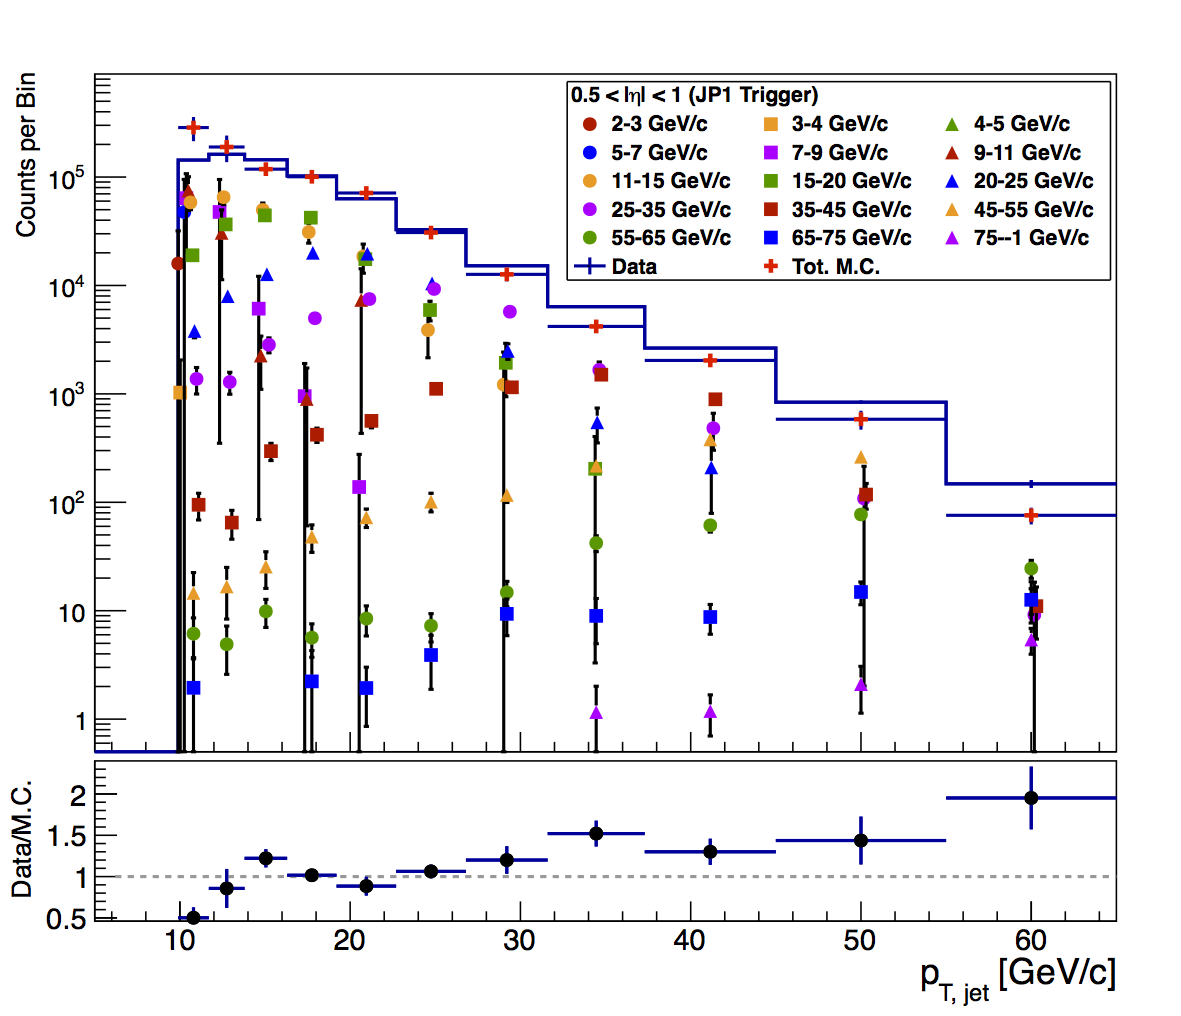 |
NOTE: The axis range now extends to 80 GeV/c rather than the 65 GeV/c shown before. In Fig. 4 I show the updated JP1 comparisons. The ratio plots are noticeably flatter, even out to 80 GeV/c. The trigger turn-on is also much better matched than before.
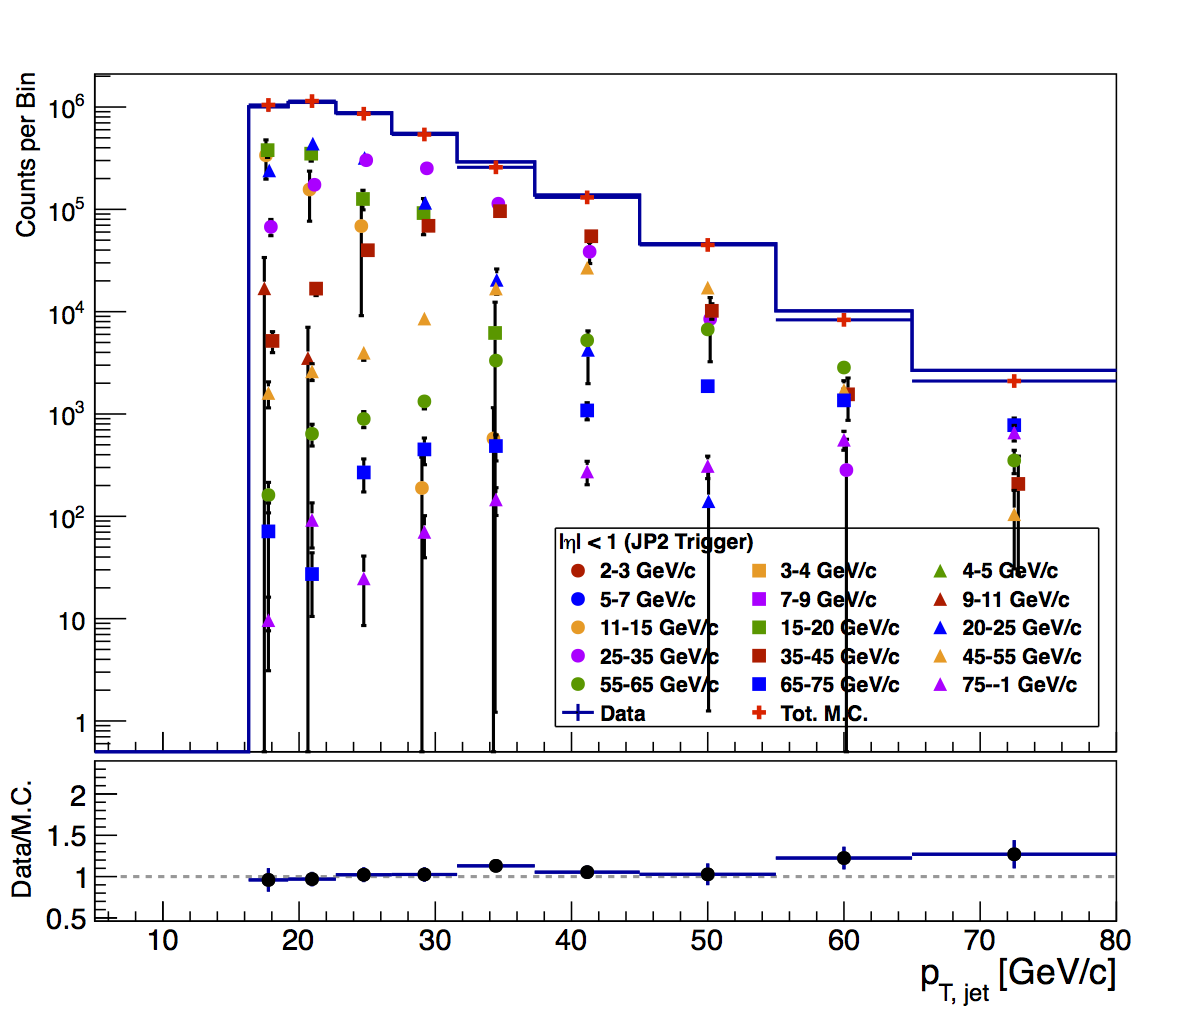
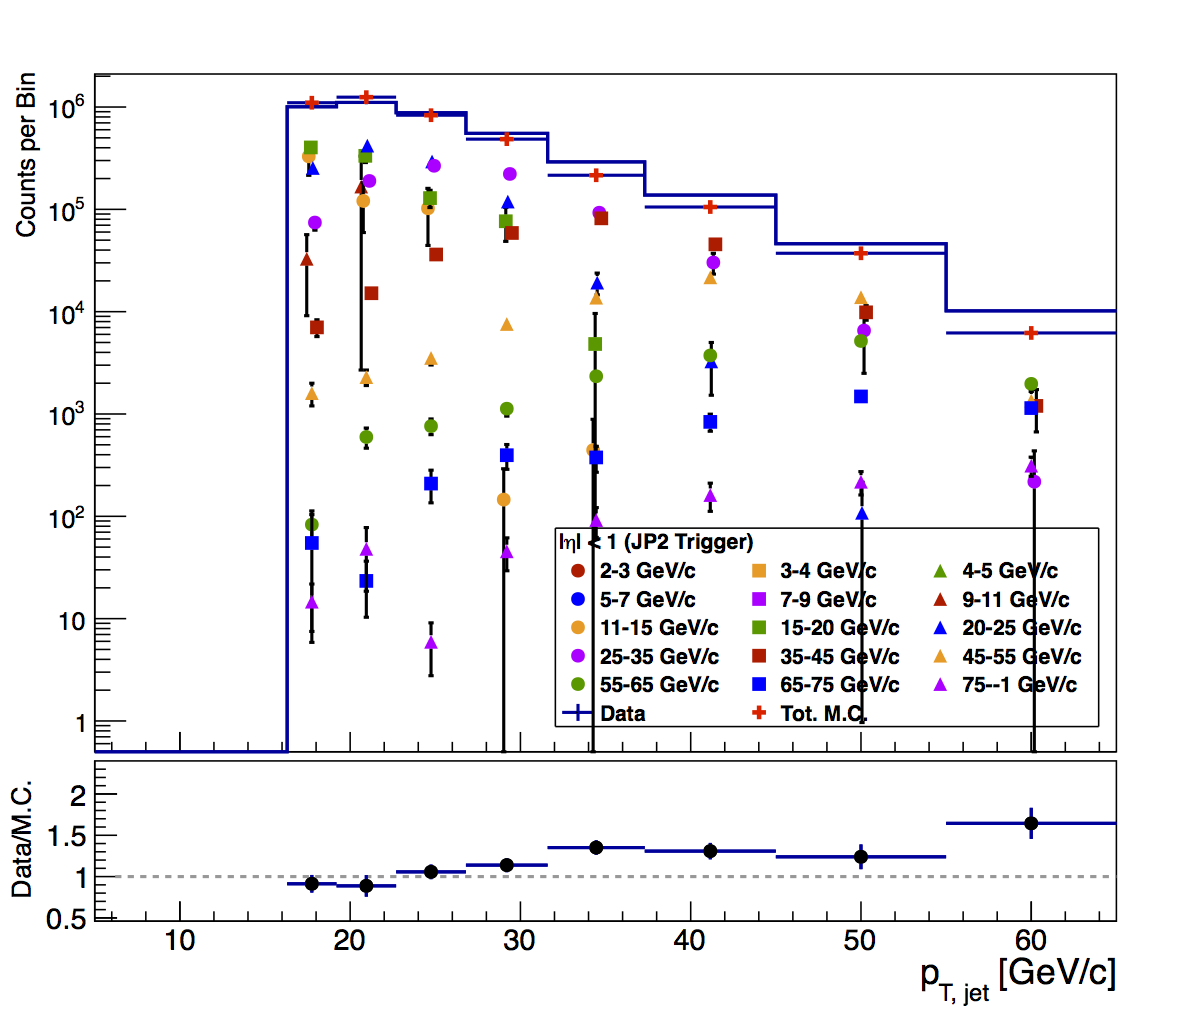
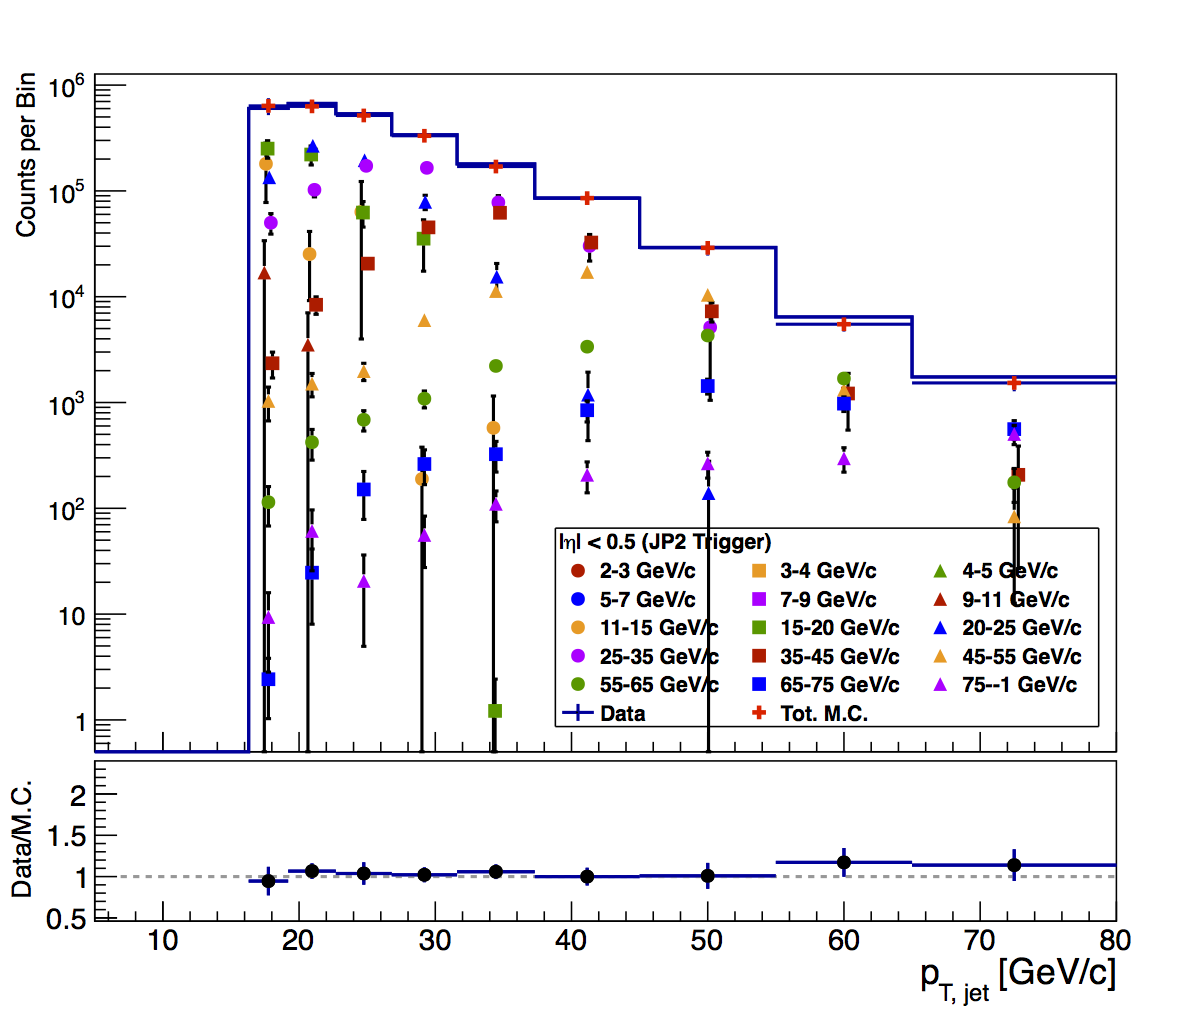
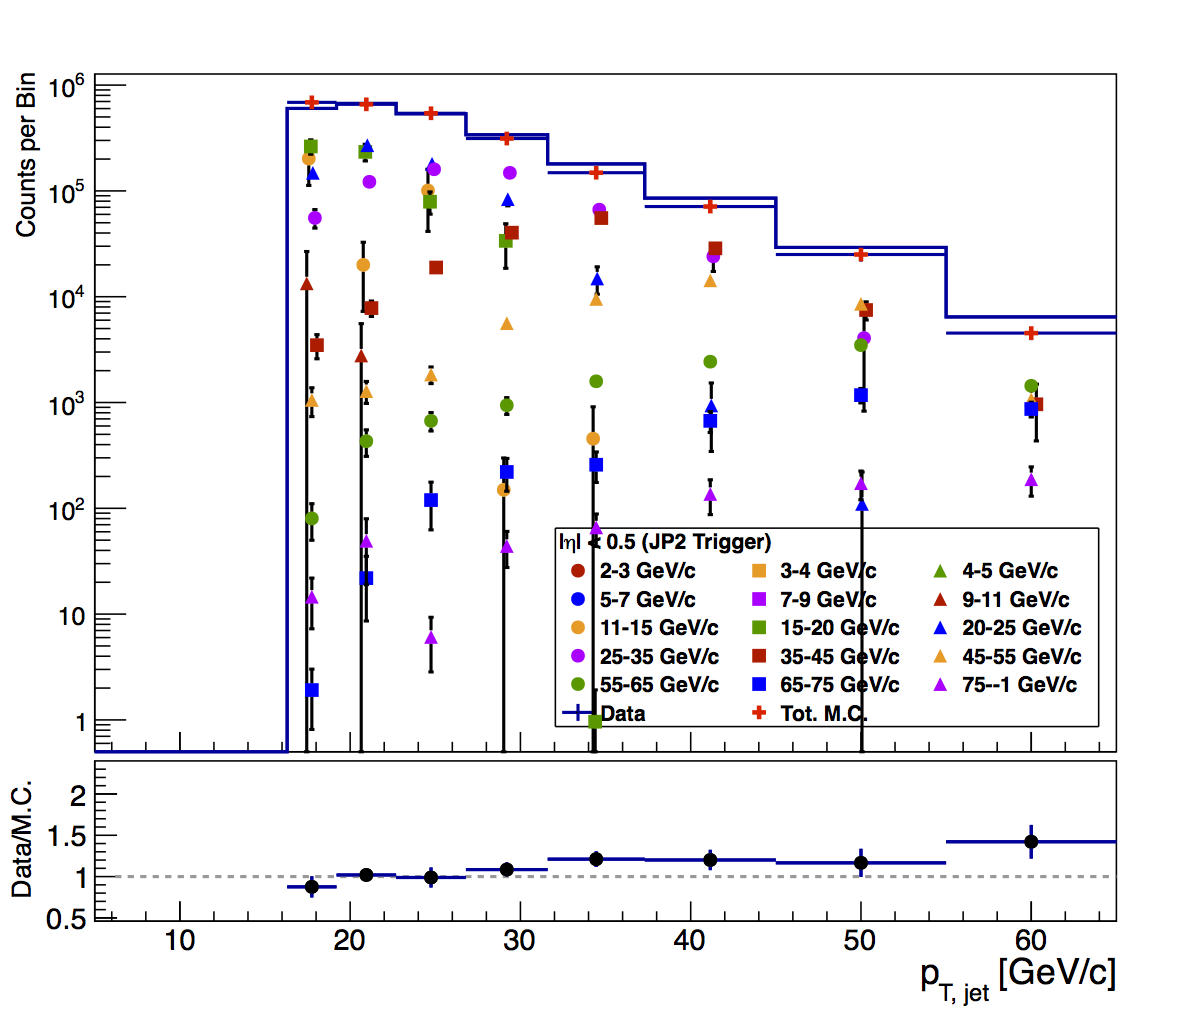
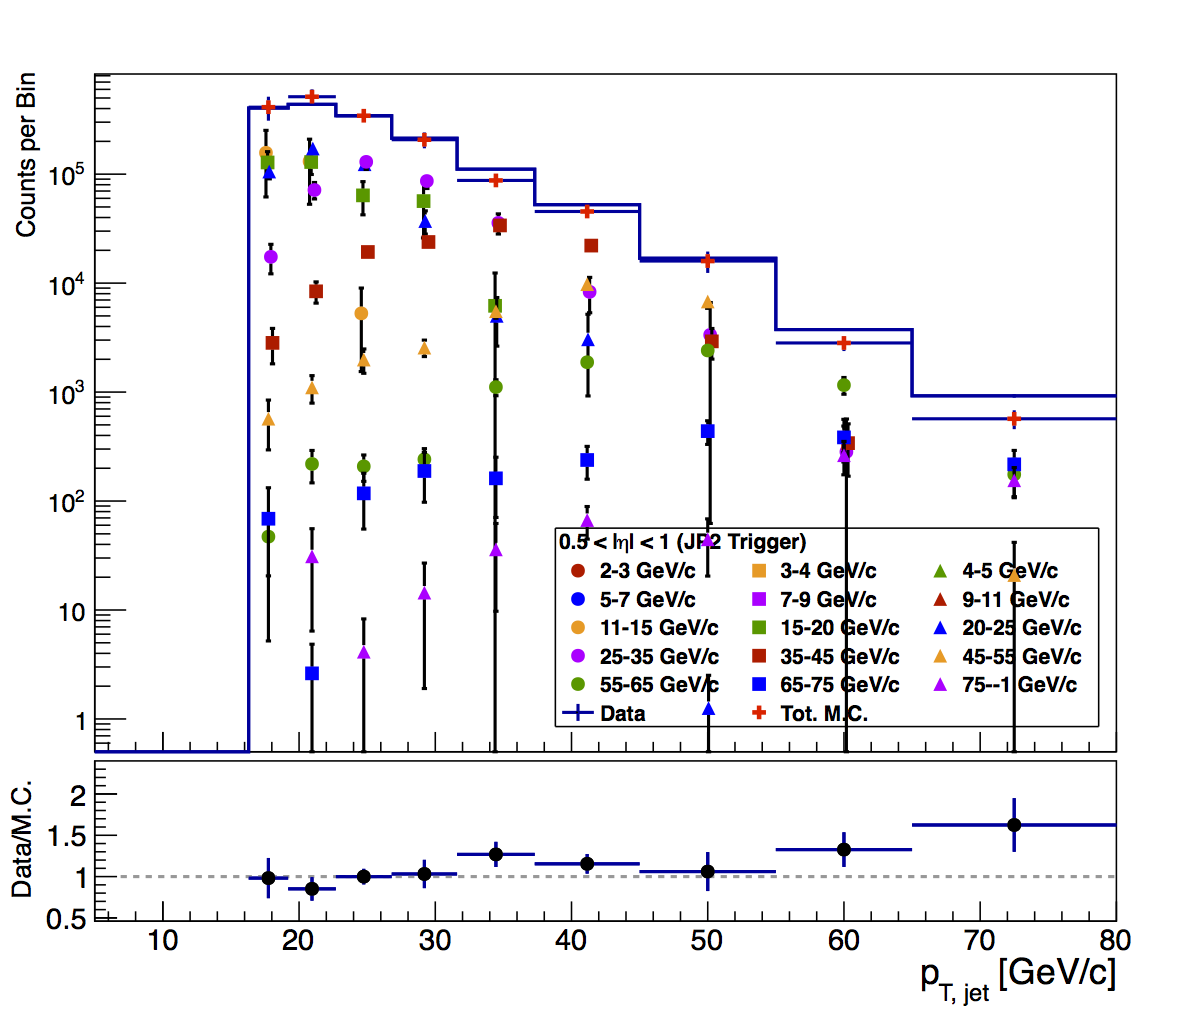
Figure 5: JP2
| ADC+3 | ADC+0 |
 |
 |
 |
 |
 |
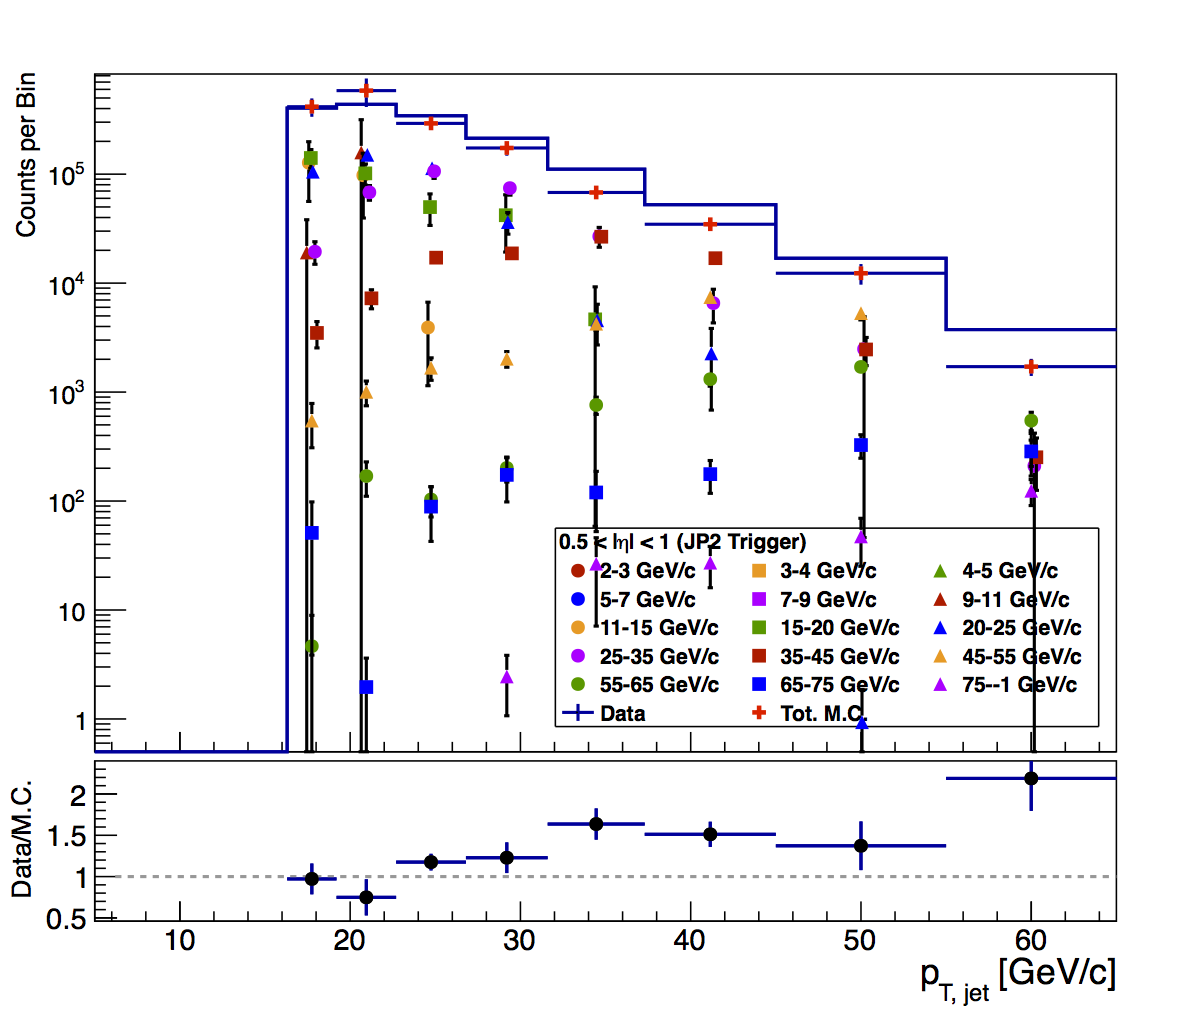 |
In Fig. 5 I show the updated comparisons for JP2. While the previous comparisons were not bad, the new are even better. Constant fits to the normalized ratios from 16.3 to 80 GeV/c yield
| Total | Mid | Fwd | |
| Fit | 1.058±0.033 | 1.043±0.0395 | 1.081±0.052 |
| χ2/ν | 5.76/8 | 1.48/8 | 9.64/8 |
Thus, the embedding spectrum is entirely consistent with the data across the full eta range out as high as we will conceivably release the data.
Groups:
- drach09's blog
- Login or register to post comments