- drach09's home page
- Posts
- 2022
- 2020
- June (1)
- 2019
- 2018
- 2017
- 2016
- 2015
- 2014
- December (13)
- November (2)
- October (5)
- September (2)
- August (8)
- July (9)
- June (7)
- May (5)
- April (4)
- March (4)
- February (1)
- January (2)
- 2013
- December (2)
- November (8)
- October (5)
- September (12)
- August (5)
- July (2)
- June (3)
- May (4)
- April (8)
- March (10)
- February (9)
- January (11)
- 2012
- 2011
- October (1)
- My blog
- Post new blog entry
- All blogs
Run-11 Transverse Jets: Trigger Bias
Follow-up Notes (August 12, 2014)
After some discussions offline, I thought it useful to post some follow-up notes. These will mostly center around our expectations for the effects of trigger bias and conclusions we can draw from related observations. I believe the conclusion will be that our current estimates represent reasonable values for what I expect are systematic effects below the level of our current precision.
Expected Effects of Trigger Bias
First off, it should be stated clearly that we know our trigger is biased and we know how it is biased. The fixed trigger patches are more efficient for quark jets than for gluon jets for given pT. As jets are more colimated at higher pT, the effect is less severe and negligible at the highest values of pT. Pibero has found that above 20 GeV/c, the bias was no more than 1-2%, for a trigger threshold of 36 (7.3 GeV). This sits between the values for my JP0 and JP1 triggers (32 and 43, respectively). So, whatever effects exist, we expect they will disappear at higher values of pT. In whatever scenario, the trigger bias can only affect the measurements if a signal is present. Given that we observe no signal, it is rather suggestive that the trigger bias has no measurable effect on the data.
Sivers/ETQS Effect
For the Sivers/ETQS effect, we expect, again, the only nonzero contributions to arise from gluons. Thus, low-pT is prime realestate for physics and the effects of trigger bias. Thus, the shifts at high-pT should be nonexistent. It is unclear what sign the asymmetries should take, thus, it is difficult to know the direction of the trigger-dependent shift. Whatever it is, one may expect the shifts to be in the same direction for xF < 0 and xF > 0. One may also expect a larger shift for xF > 0 than for xF < 0.
Collins-like Effect
For the Collins-like effect, we expect the bias to produce smaller asymmetries, since the Collins-like effect is a gluon-based effect and absent for quarks. In contrast to the Collins effect, we expect the largest physical effects at low-pT where trigger bias is most prevalent. We expect very similar behavior for all xF and for the two species of chaged pions.
Collins Effect
For the Collins effect, we expect the bias to produce larger asymmetries, since the Collins effect is a quark-based effect and absent for gluons. Thus, where we expect the largest physical effects to exist, hence, the largest effects of trigger bias, we expect the bias to be virtually absent. Furthermore, we expect larger effects for forward scattering than for backward scattering. Thus, we expect the trigger bias to have no effect at xF < 0 and larger effects for xF > 0. Since the Collins effect manifests itself as a postive asymmetry for π+ and a negative asymmetry for π- one might expect opposite shifts for the two species as a signature of the trigger bias.
Relevant Measurements
Sivers/ETQS Effect
| pT Bin [GeV/c] | Trigger Selection | Asymmetry Difference (xF > 0) | Asymmetry Difference (xF < 0) |
| 7.1-8.4 | JP0-VPDMB | -0.0104±0.00720 | 0.00758±0.00719 |
| 8.4-9.9 | JP0-VPDMB | 0.00653±0.00979 | 0.00238±0.00977 |
| 9.9-11.7 | JP1-JP0 | -0.00372±0.00652 | 0.00531±0.00652 |
| 11.7-13.8 | JP1-JP0 | -0.0162±0.00690 | -0.0152±0.00691 |
| 16.3-19.2 | JP2-JP1 | -0.00982±0.00634 | -0.00796±0.00634 |
| 19.2-22.7 | JP2-JP1 | -0.0100±0.00766 | 0.00488±0.00767 |
The the table, I list some relevant comparisons between "biased" and "unbiased" triggers. The rows in red denote the first bin where the biased trigger is used, i.e. immediately after the pT threshold, where the trigger is turning on. The rows in blue denote the bin after the turn-on where the comparison should be between fairly unbiased triggers. Thus, the signature we expect is for the largest shifts to occur in the red rows and the smallest shifts to occur in the blue. One expects the shifts to be in the same direction. One may also expect the shifts to be of larger magnitude for xF > 0 than for xF < 0 but with the same sign.
I note that seven of the twelve shifts are negative which may be consistent with trigger bias. However, most other signatures appear to be absent. For the first bin, the shifts for xF > 0 and xF < 0 are opposite in sign. The same is true for the 9.9-11.7 GeV/c bin. As one moves from the 7.1-8.4 GeV/c bin to the 9.9-11.7 GeV/c bin, with fairly constant statistical precision, the magnitude of the of the shift decreases but then increases at the 19.2-22.7 GeV/c bin. In the comparisons of both JP1-JP0 and JP2-JP1, moving from the red rows to the blue rows actually increases the magnitudes of the xF > 0 shifts, contrary to expectation.
For the reasons outlined in the preceding paragraph, it seems likely that whatever the effects of the trigger bias, it appears to be below the level of precision of our data. A reasonable conclusion appears to be that the present measurement is insensitive to this effect and the existing systematic uncertainties are appropriate.
Collins-like Effect
| 0.1 < z < 0.2 | 0.2 < z < 0.3 | ||||||||
| π+ | π- | π+ | π- | ||||||
| pT Bin [GeV/c] | Trigger Selection | Asym. Diff. (xF > 0) | Asym. Diff. (xF < 0) | Asym. Diff. (xF > 0) | Asym. Diff. (xF < 0) | Asym. Diff. (xF > 0) | Asym. Diff. (xF < 0) | Asym. Diff. (xF > 0) | Asym. Diff. (xF < 0) |
| 7.1-8.4 | JP0-VPDMB | 4.80E-03±5.55E-03 | -1.03E-03±5.54E-03 | 1.98E-03±5.60E-03 | 1.45E-03±5.60E-03 | 3.36E-03±1.01E-02 | -1.19E-02±1.01E-02 | 8.00E-03±1.00E-02 | -2.74E-03±1.00E-02 |
| 8.4-9.9 | JP0-VPDMB | 4.68E-03±7.31E-03 | -5.42E-04±7.31E-03 | 7.38E-04±7.34E-03 | 7.41E-03±7.36E-03 | -1.20E-02±1.33E-02 | 5.48E-03±1.34E-02 | -3.65E-03±1.33E-02 | 1.16E-02±1.34E-02 |
| 9.9-11.7 | JP1-JP0 | -5.32E-03±6.13E-03 | 7.58E-03±6.12E-03 | 4.20E-03±6.16E-03 | -5.59E-04±6.15E-03 | 1.47E-02±1.33E-02 | -1.61E-02±1.33E-02 | 2.76E-03±1.33E-02 | -7.06E-03±1.34E-02 |
| 11.7-13.8 | JP1-JP0 | -3.40E-03±6.14E-03 | 1.08E-02±6.15E-03 | -2.48E-04±6.19E-03 | 4.60E-03±6.19E-03 | 6.83E-03±1.29E-02 | 1.84E-02±1.28E-02 | 2.39E-03±1.30E-02 | 3.58E-03±1.30E-02 |
| 16.3-19.2 | JP2-JP1 | -6.01E-03±6.27E-03 | -5.37E-03±6.27E-03 | -1.68E-03±6.34E-03 | -1.03E-02±6.34E-03 | -1.40E-02±1.43E-02 | 1.24E-02±1.43E-02 | 1.80E-03±1.48E-02 | 6.34E-03±1.47E-02 |
| 19.2-22.7 | JP2-JP1 | -1.54E-02±7.44E-03 | 4.73E-03±7.42E-03 | 4.37E-03±7.50E-03 | -1.79E-03±7.51E-03 | -1.16E-02±1.65E-02 | 1.65E-02±1.64E-02 | 9.18E-03±1.70E-02 | 2.88E-02±1.70E-02 |
In the table above, I show the Collins-like asymmetry differences for two bins of z, where we expect the biggest physics effects. Accross the board, none of the shifts are statistically significant. In general, the shifts are of opposite sign for xF > 0 and xF < 0, which is contrary to expectation. In the first 0.1-0.2 bin, the differences do seem to decrease in magnitude as one goes from red to blue, however, the decreases are not statistically significant. Often, the shifts flip sign as one goes from red to blue. In the case in the 0.2-0.3 bin, though the precision is less than the 0.1-0.2 bin, there does not seem to be a trend of the differences decreasing in magnidute from red to blue.
Again, while it is difficult to divine a trend from the above data, this suggests that to the degree that trigger bias has an affect, it is below the level of our available precision. Thus, it seems reasonable to take the existing trigger-bias systematic as sufficient.
Collins Effect
.
Methodology
In 2011 and 2012, STAR had a number of triggers defined for data-taking. This allows us to quantify the effects of trigger bias in a data-driven way, rather than relying on Monte Carlo studies with different models. For the transverse polarization analyses, this is very nice, since the NLO model calculations analogous to those on the longitudinal side do not exist. The procedure, here, is as follows:
- Data events are assigned to the least biased trigger possible (based on hardware trigger, simulated trigger, geometric trigger, and pT threshold): VPDMB, JP0, JP1, JP2, in that order
- Asymmetries are calculated for Sivers/ETQS, Collins, and Collins-like as a function of pT
- The asymmetry difference, ΔA, between successive triggers in overlapping pT bins is calculated where available. For example, for 7.1 < pT < 16.3 GeV/c, one may calculate ΔA for JP0-VPDMB and JP1-JP0. Above 16.3 GeV/c, one may also calculate JP2-JP1.
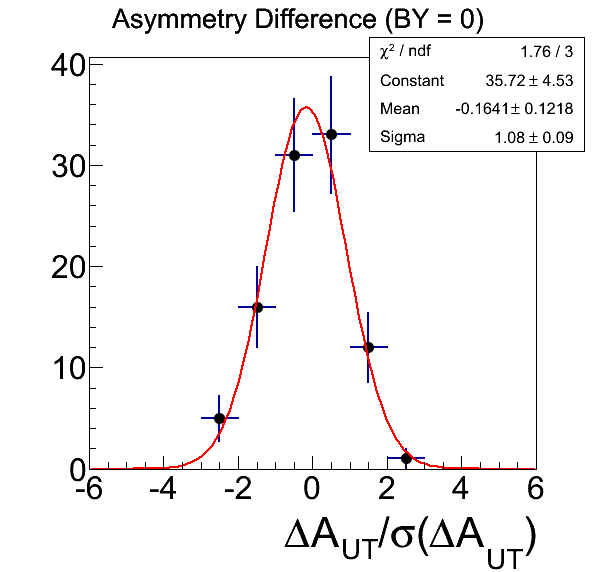
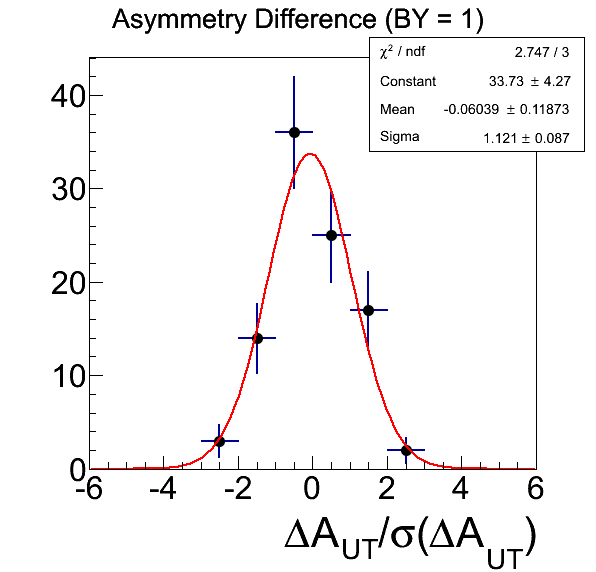
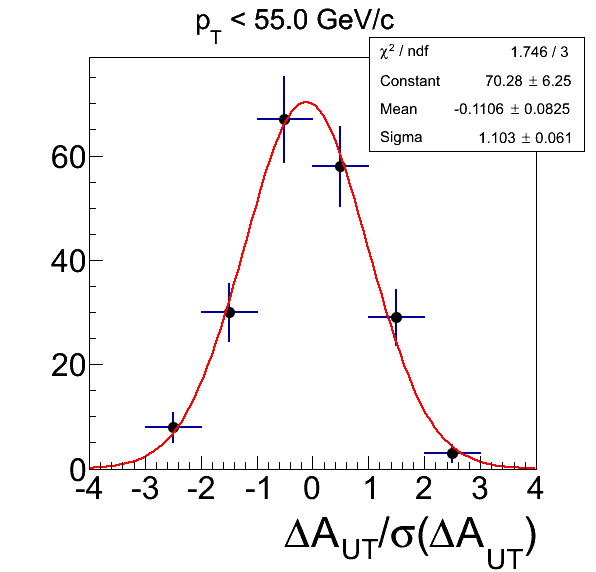
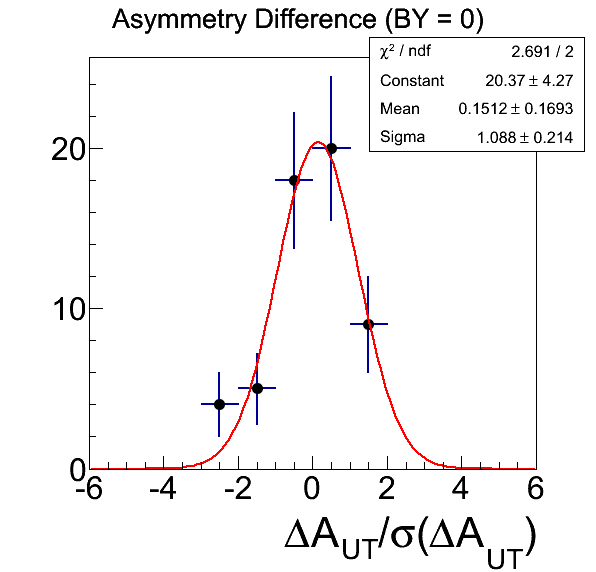
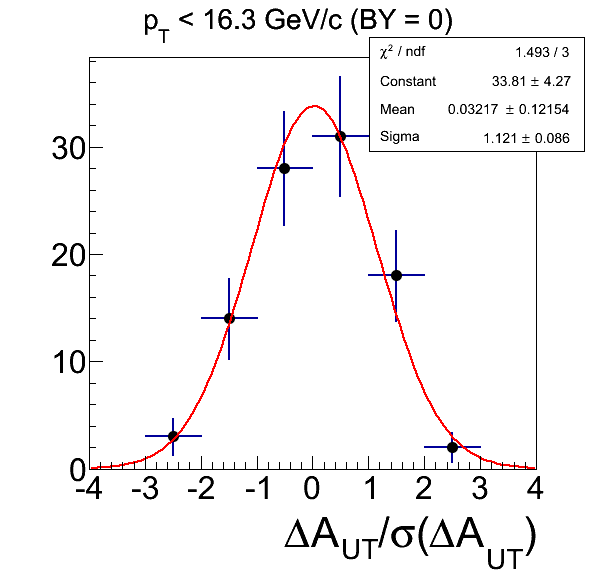
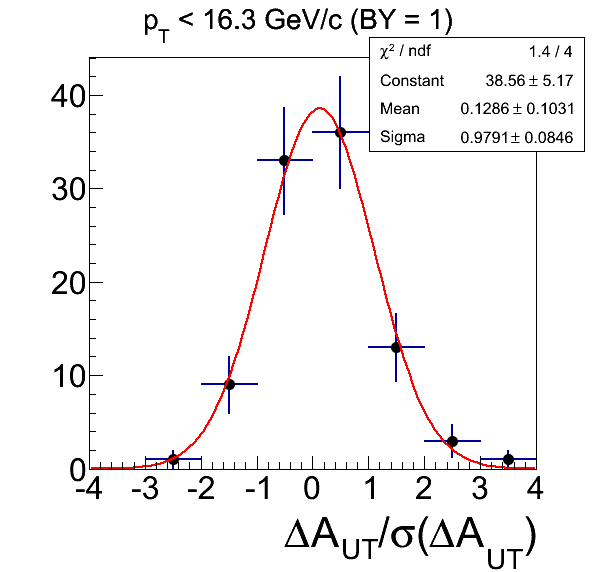
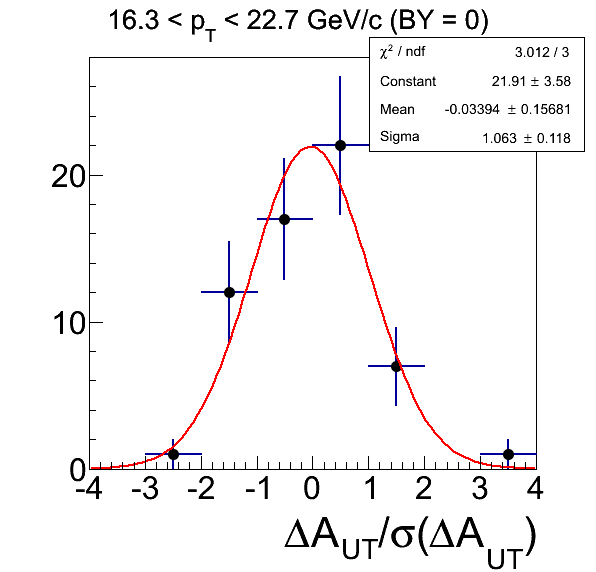
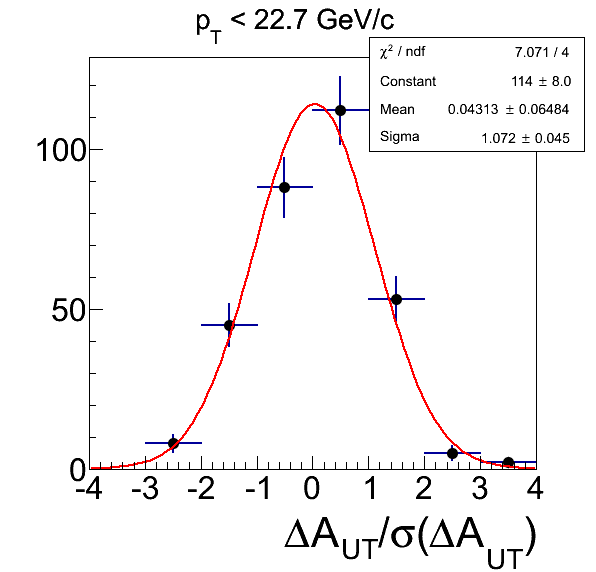
- The "pulls" distribution, i.e. ΔA/σ(ΔA) is fitted with a Gaussian to extract the mean and width
- In the case of no trigger bias, the means and widths of the "pulls" should be consistent with zero and unity, respectively. Thus, this information can be used to set a reasonable estimate of the amount of trigger bias present.
For this study, I have not applied the polarization corrections. In general, the polarization should only differ by a few percent for the different triggers. Also, the polarization-correction will introduce an extra layer of correlation between the data samples. For easy of time and effort, I have chosen to ignore the effects of polarization. In the analysis, the polarization uncertainty is left as a correlated systematic scale uncertainty.
The bottom line from the plots below is that the means of the "pulls" are consistent with zero, but the widths of the distributions are systematically larger than unity. Thus, while the means suggest the effects of trigger bias are negligible, the widths suggest one cannot neglect it with certainty without further investigation. To cover my bases for the preliminary result, I choose to take the conservative limits as described in the discusion, below. In general, as expected, these systematic uncertainties are subdominant to those from the matching fractions, pion contamination, and the "leak-through" limits of additional spin effects.
Summary of Trigger Bias Estimates
| Measurement | Uncertainty from Trigger Bias |
| Jet AN (Mid) and Jet AN (Fwd) |
0 for 6-7.1 GeV/c (bin is entirely VPDMB) 0.16×σstat(A) for 7.1-22.7 GeV/c 0.26×σstat(A) above 22.7 GeV/c |
| Collins (Low-pT) | 0.25×σstat(A) for 0.1 < z < 0.3 0.10×σstat(A) for z > 0.3 |
| Collins (Mid-pT) | 0.17×σstat(A) |
| Collins (High-pT) | 0.14×σstat(A) |
| Collins-like (Low-pT) | 0.26×σstat(A) for 0.1 < z < 0.3 0.11×σstat(A) for z > 0.3 |
| Collins-like (Mid-pT) | 0.35×σstat(A) |
| Collins-like (High-pT) | 0.09×σstat(A) |
Jet AN
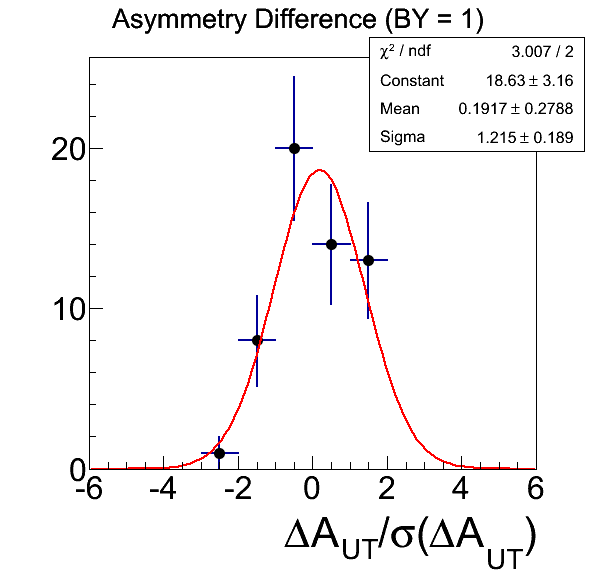
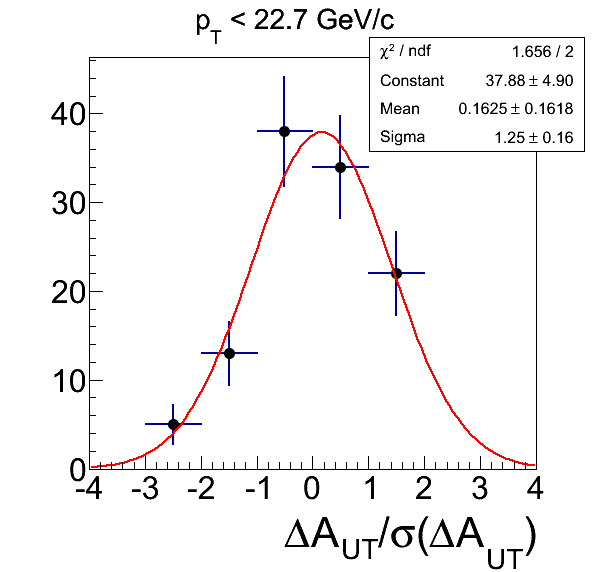
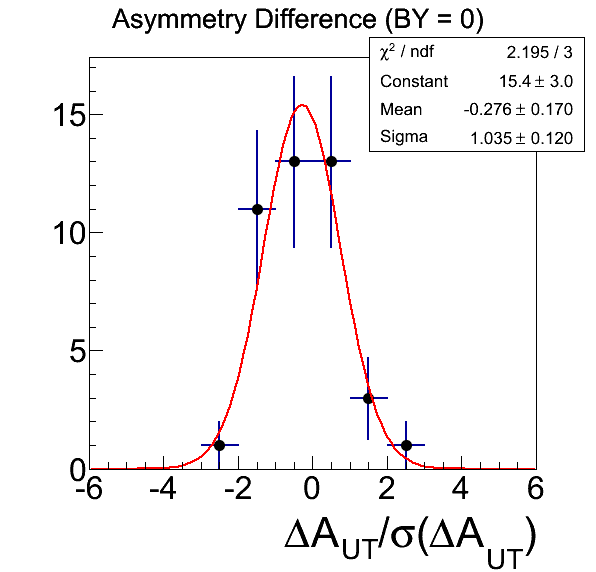
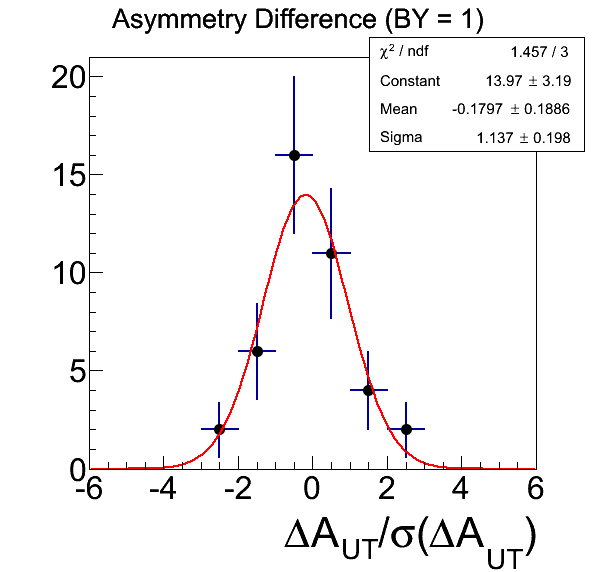
For the Sivers/ETQS measurement, the asymmetry is calculated in bins of η, as well, to allow more "pulls" to be calculated and counted in the fits. Below, the pulls are shown for the full range of jet pT as well as the "low+mid" range (6-22.7 GeV/c) and the "high" range (22.7 and above). My naïve expectation is that above 22.7 GeV/c, the triggers are all unbiased. This high in pT, even gluon jets fall within a smaller cone size. Thus, our trigger response should not be noticably more efficient for quark jets. As a point of reference, Pibero found at most 1-2% biases above 20 GeV with a lower JP2 threshold of 36 (7.3 GeV) compared to my 64 (13.9 GeV/c). This being said, it is in the low-mid region where I would expect bias to be present, as the various triggers turn on at various values of pT.
Figure 1: AN "Pulls"
| pT < 55 GeV/c (xF > 0) | pT < 55 GeV/c (xF < 0) | pT < 55 GeV/c (Total) |
 |
 |
 |
| pT < 22.7 GeV/c (xF > 0) | pT < 22.7 GeV/c (xF < 0) | pT < 22.7 GeV/c (Total) |
 |
 |
 |
| pT > 22.7 GeV/c (xF > 0) | pT > 22.7 GeV/c (xF < 0) | pT > 22.7 GeV/c (Total) |
 |
 |
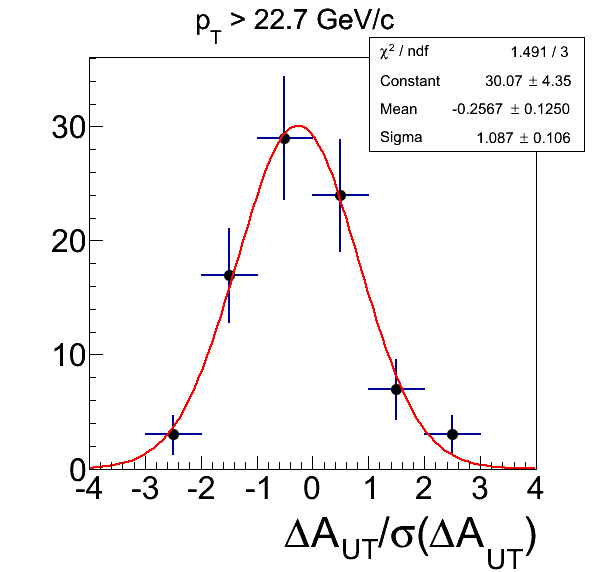 |
For the full range of pT, the pulls are all well within 2σ of the "no-bias" hypothesis. Since any nonzero Sivers/ETQS asymmetries are expected to be of similar value for the active range of xF, it seems sensible to base the bias estimate on the "Total" distributions. For the low+mid range, the mean is 1σ from zero and the width 1.6σ from unity. This could easily be statistics. A conservative estimate would be a trigger-bias systematic 16% of the statistical uncertainty. This is typically, well below the leading uncertainty in mid-rapidity jets and low-pT foward jets. For jets above 22.7 GeV/c, where I expect the triggers to be unbiased, I find a slightly larger deviation in the mean. The 2σ offset could still be statistics, and I expect that it is. Again, a conservative estimate could be 26% of the statistical uncertainty. In this case, the trigger-bias systematic would be the dominant systematic uncertainty. Thus, we should consider carfully if this is the appropriate track to take. A systematic less than 30% of the statistical uncertainty is not so bad. However, if we believe there is no trigger bias above 22.7 GeV/c, we may decide there is no good reason to apply additional systematics.
Collins Asymmetry
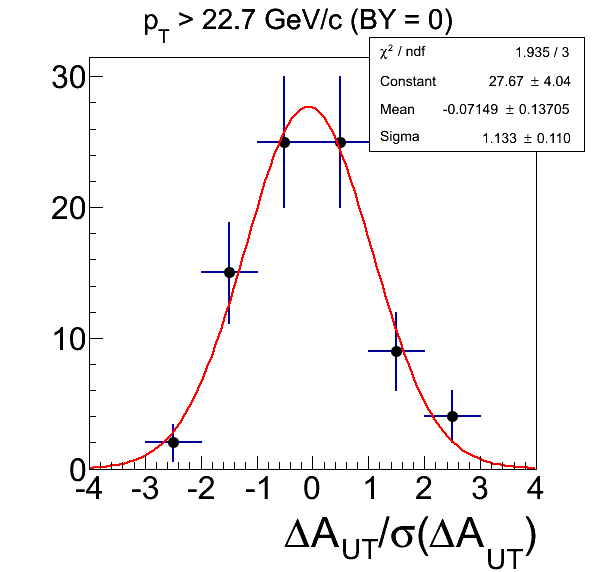
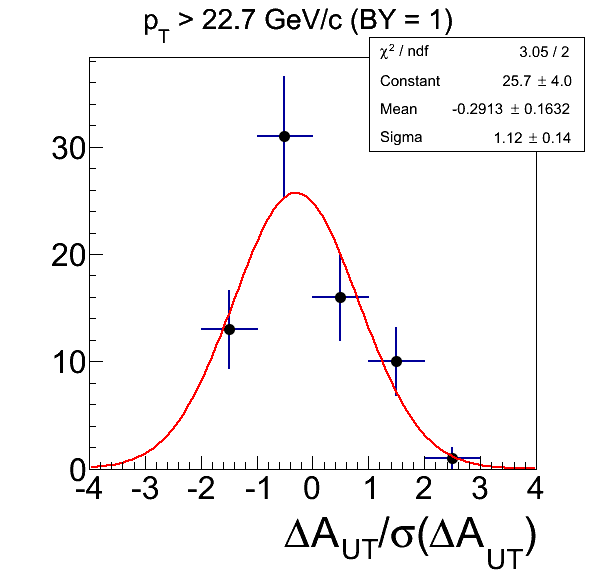
For the Collins asymmetry, again, I expect the high-pT jets to be free of trigger bias. This happens to be, also, where one would expect the largest effects. To estimate the bias, I follow the procedure described above. Here, I also calculate the asymmetries for three bins of z: 0.1-0.2, 0.2-0.3, and > 0.3. This will allow us to examine possible biases as a function of z. Since the bias for the Collins asymmetry should manifest as larger magnitude asymmetries for more restrictive triggers, the expected bias is a positive shift in the mean of the pulls for π+ and negative for π-. We expect similar magnitude for these effects. Thus, to increase our statistics, I combine the pulls for both sets with a -1 scale for those π-.
Figure 2: Collins High pT Pulls
| xF > 0 | xF < 0 | All xF |
 |
 |
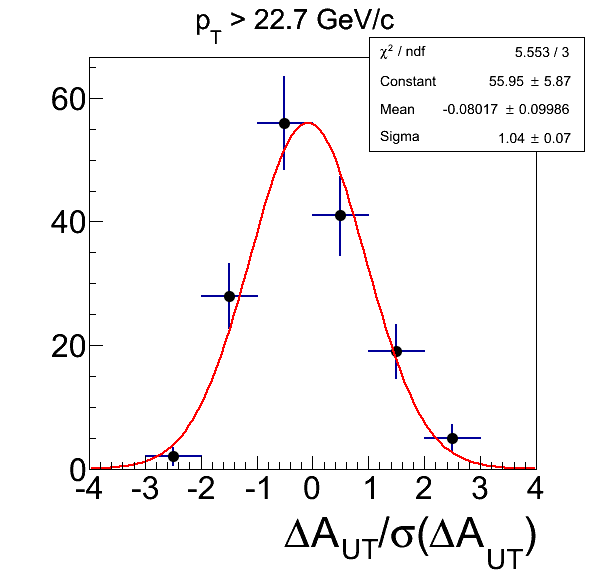 |
The pulls for high-pT jets, again, show no strong sign of trigger bias. The xF < 0 sample shows an offset 1.8σ from unity, but I believe this to be statistics. We do not expect bias in high-pT jets. There should be no large signal at all for xF < 0 and if bias exists it should be a positive shift. The total distribution is perfectly consistent with the null hypothesis. A conservative estimate could be the uncertainty on the mean of the pulls (14% for xF > 0).
Figure 3: Collins Low pT Pulls
| xF > 0 | xF < 0 | All xF |
 |
 |
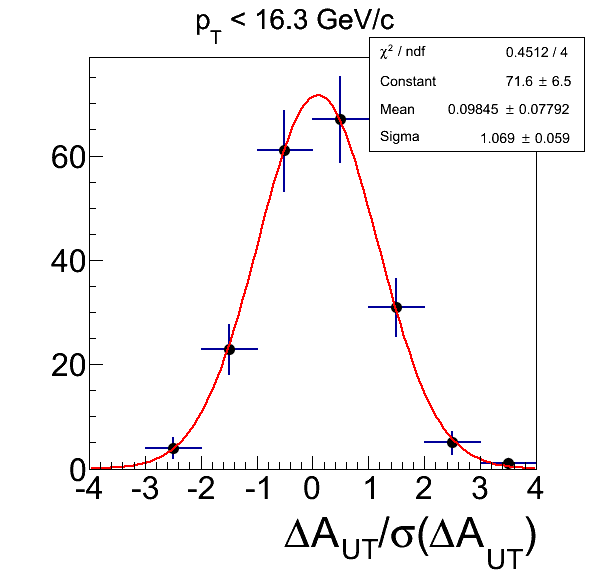 |
For low-pT Collins asymmetries, the pulls show no significant bias. There is a 1.2σ deviation from zero in xF < 0. Digging deeper, this appears mostly to arise from the 0.1 < z < 0.2 and 0.2 < z < 0.3 bins, each of which show means with a < 2σ deviation from zero (about 0.25 in magintude in each case). I expect the systematics for these bins to be dominated by matching and pion contamination. A conservative estimate could be 25% of the statistical uncertainty in the first two z bins and 10% for the remaining bins.
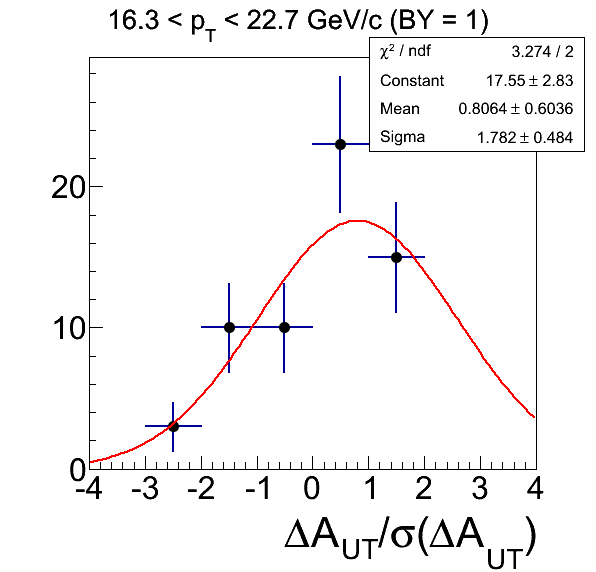
Figure 4: Collins Mid pT Pulls
| xF > 0 | xF < 0 | All xF |
 |
 |
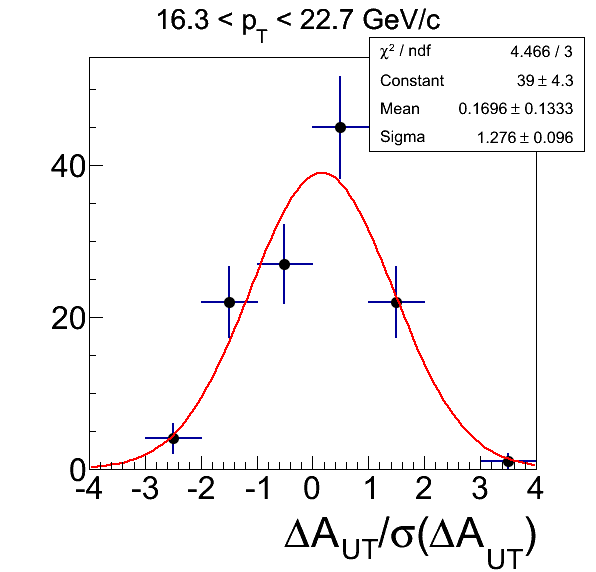 |
In the mid range, I would expect basically the entire bias to come from the turn-on of JP2 Once again, no significant sign of bias exists, though, the xF < 0 distribution is complete garbage. The xF > 0 distribution is perfectly consistent with the null hypothesis. A conservative estmate could take the 17% from the total distribution or even the 16% from the uncertainty on the xF > 0 distribution. I expect both of these to be subdominant.
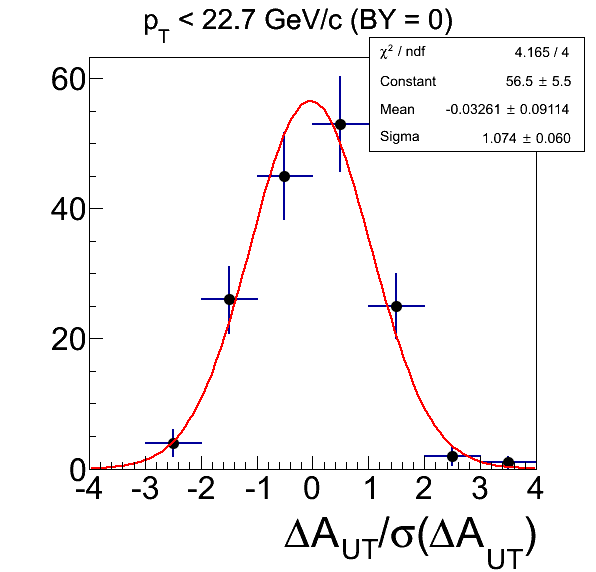
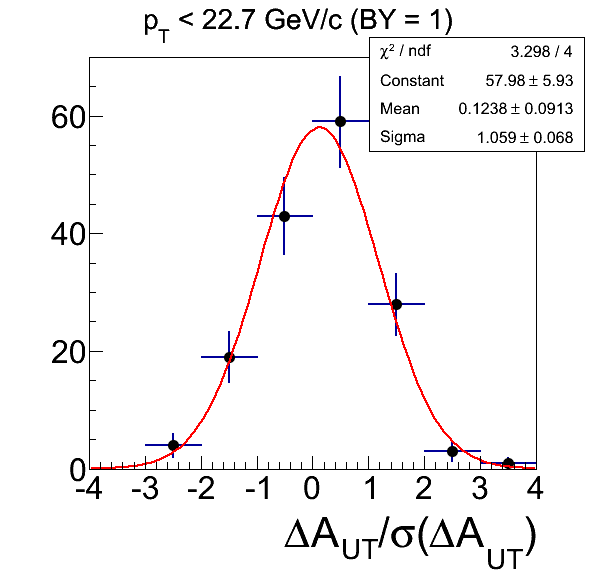
Figure 5: Collins Low+Mid pT Pulls
| xF > 0 | xF < 0 | All xF |
 |
 |
 |
Another sanity check, given the craziness in the xF < 0 of Fig. 4 is to combine the mid distributions with those of low. Again, things look perfectly consistent with no bias. The xF < 0 distribution has a 1.4σ offset from zero. Even the full 12% of the statistical uncertainties should be subdominant and a conservative estimate.
Collins-Like Asymmetry
For the Collins-like asymmetries, again, I expect the high-pT jets to be free of trigger bias. However, this is not where one would expect the largest effects. This time, we do expect low-pT to yield the best sensitivity. Collins-like being a gluonic effect, the trigger bias works in the wrong direction for us. To estimate the bias, I follow the procedure described above for the Collins effect. Since the bias for the Collins-like asymmetry should manifest as smaller magnitude asymmetries for more restrictive triggers, the expected bias is a negative shift in the mean of the pulls. This time, we expect the same effect for π+ as for π-. Thus, to increase our statistics, I combine the pulls for both sets (without the -1 scale for those π- used in those for the Collins effect). We also expect very similar effects for xF > 0 and xF < 0, so these are combined, as well.
Figure 6: Collins-like Pulls
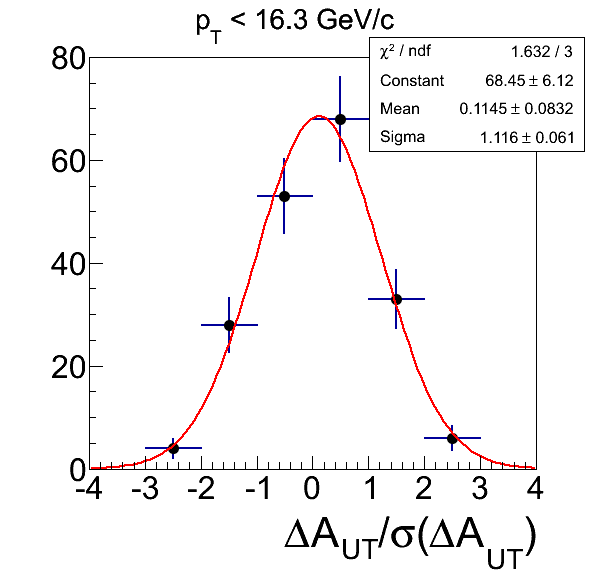
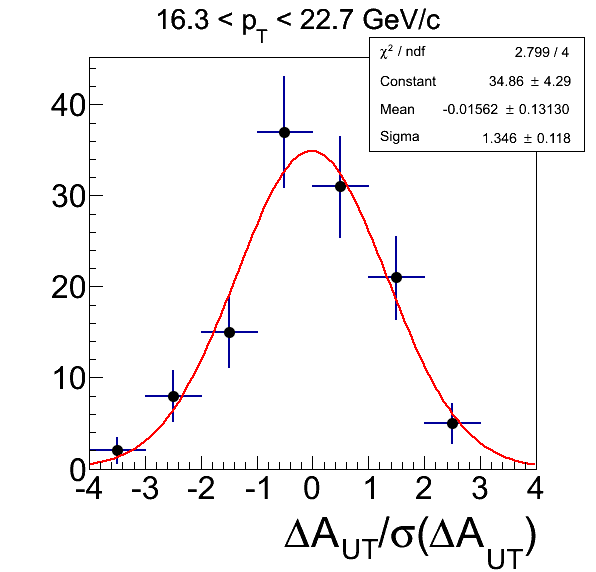
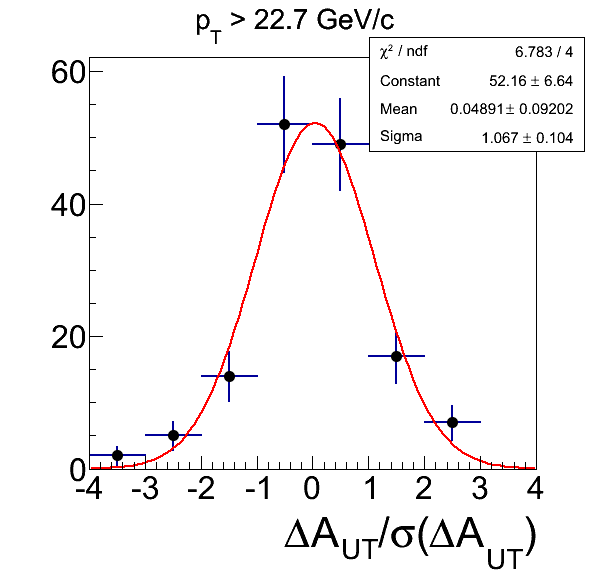
The high-pT Collins-like pulls are indeed consistent with no bias. The 9% uncertainty on the mean will likely be subdominant and a conservative estimate. The low-pT Collins-like also appears consistent with no bias. The 1.4σ shift is in the wrong direction for the expected effect. It appears to be relegated to the 0.1 < z < 0.2 bin (mean of 0.25±0.14), where, again, the shift is in the wrong direction from our expectation. Systematics for this bin are dominated by the matching fractions and pion contamination. Thus, a conservative systematic of 25% of the statistical uncertainty for this bin will be subdominant. A conservative estimate for the remaining bins will be the 11% mean. For the mid-range bin, the offset is normal, but the width of the distribution is much wider than one expects (2.9σ from unity). This appears to stem from the 0.2 < z < 0.3 bin and a handful of comparisons between VPDMB and JP0 and JP0 and JP1. In this region, I would expect everything but JP2 to be unbiased. It is not clear the best course, but a conservative estimate may be the 35% difference of the width from unity.
- drach09's blog
- Login or register to post comments
