- drach09's home page
- Posts
- 2022
- 2020
- June (1)
- 2019
- 2018
- 2017
- 2016
- 2015
- 2014
- December (13)
- November (2)
- October (5)
- September (2)
- August (8)
- July (9)
- June (7)
- May (5)
- April (4)
- March (4)
- February (1)
- January (2)
- 2013
- December (2)
- November (8)
- October (5)
- September (12)
- August (5)
- July (2)
- June (3)
- May (4)
- April (8)
- March (10)
- February (9)
- January (11)
- 2012
- 2011
- October (1)
- My blog
- Post new blog entry
- All blogs
Run-11 Transverse Jets: Tuning PYTHIA Fudge Factors
To try to obtain the best possible estimate of the fudge factors for the various partonic pT bins, I have tried a variety of fit functions to estimate the endpoints of the binned pT spectra. I've tried fitting with c0 / pTc1, c0×exp(c1×pT), exp(pol2(pT)), and exp(pol3(pT)). In the end, for each bin, I have chosen the particular function which returns the best χ2 probability. To ensure sufficient bins for a meaningful probability, I decreased the histogram bin sizes relative to those used in the previous update. A summary of the results is found in Table 1.
Table 1
| kT = 2 GeV/c | kT = 1.5 GeV/c | kT = 1 GeV/c | kT = 0.5 GeV/c | |||||
| Partonic pT Bin [GeV/c] | Fudge Factors | Fit Probability | Fudge Factors | Fit Probability | Fudge Factors | Fit Probability | Fudge Factors | Fit Probability |
| 2-3 | 0.666 | 0.136 | 0.650 | 0.852 | 0.614 | 0.001 | 0.778 | 0.036 |
| 3-4 | 0.947 | 0.468 | 0.928 | 0.307 | 0.879 | 0.664 | 1.114 | 0.046 |
| 4-5 | 1.066 | 0.096 | 1.035 | 0.076 | 0.979 | 0.686 | 1.224 | 0.055 |
| 5-7 | 1.101 | 0.597 | 1.081 | 0.131 | 1.017 | 0.129 | 1.292 | 0.629 |
| 7-9 | 1.125 | 0.314 | 1.085 | 0.679 | 1.058 | 0.651 | 1.327 | 0.876 |
| 9-11 | 1.112 | 0.652 | 1.085 | 0.212 | 1.063 | 0.956 | 1.343 | 0.223 |
| 11-15 | 1.131 | 0.555 | 1.094 | 0.533 | 1.117 | 0.772 | 1.350 | 0.010 |
| 15-20 | 1.142 | 0.018 | 1.085 | 0.664 | 1.127 | 0.798 | 1.356 | 0.219 |
| 20-25 | 1.154 | 0.192 | 1.132 | 0.044 | 1.137 | 0.826 | 1.361 | 0.758 |
| 25-35 | 1.163 | 0.261 | 1.125 | 0.456 | 1.146 | 0.407 | 1.368 | 0.194 |
| 35-45 | 1.145 | 0.735 | 1.145 | 0.265 | 1.096 | 0.029 | 1.290 | 0.674 |
| 45-55 | 1.144 | 0.116 | 1.105 | 0.363 | 1.056 | 0.118 | 1.183 | 0.983 |
| 55-65 | 1.051 | 0.962 | 1.074 | 0.637 | 1.032 | 0.243 | 1.123 | 0.353 |
| 65-75 | 1.091 | 0.049 | 1.041 | 0.682 | 1.019 | 0.589 | 1.061 | 0.666 |
| 75-∞ | 1 | 0.992 | 1 | 0.998 | 1 | 0.880 | 1 | 0.518 |
With a few exceptions, the fit probabilities are perfectly reasonable for the various partonic pT bins. In general, the fudge factors are larger by ~15% relative to those found previously. The result of this should be a veritical scale difference relative to earlier plots.
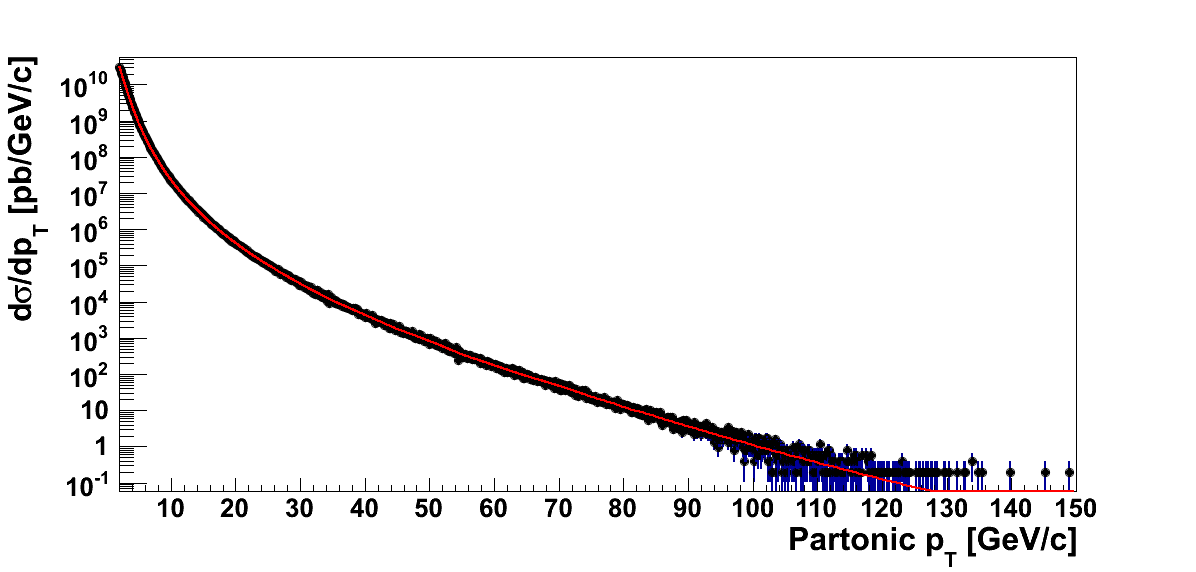
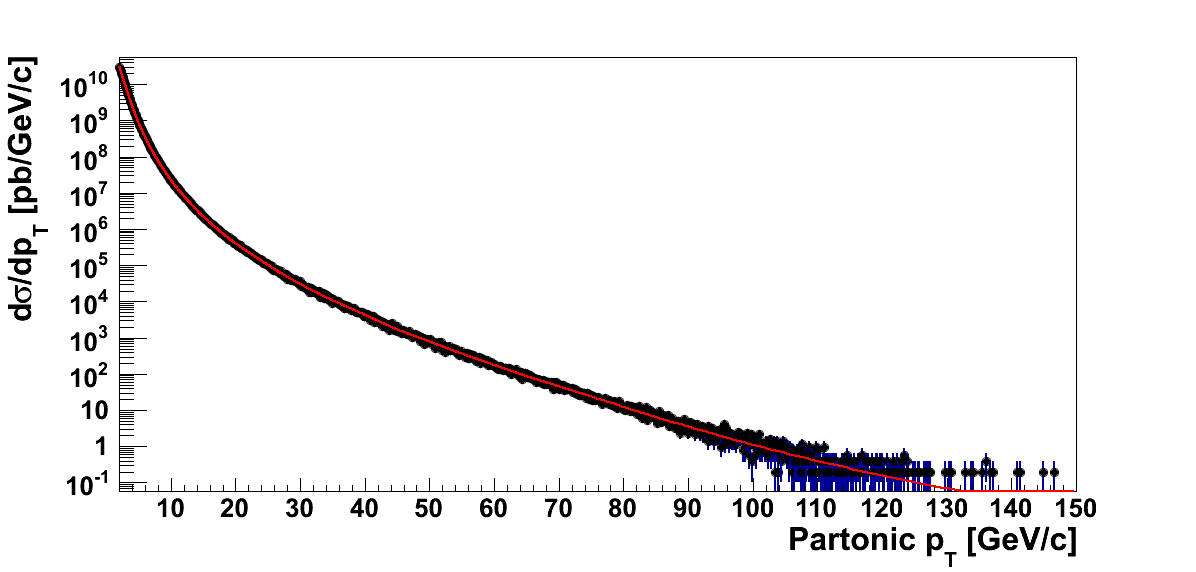
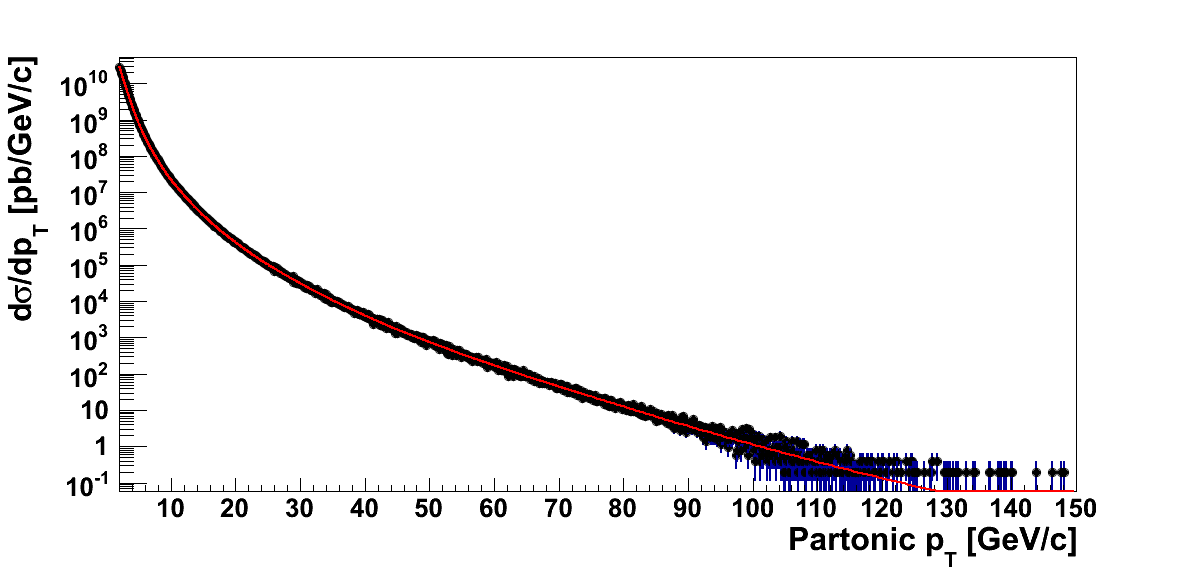
Figure 1
| kT = 2 GeV/c | kT = 1.5 GeV/c |
 |
 |
| kT = 1 GeV/c | kT = 0.5 GeV/c |
 |
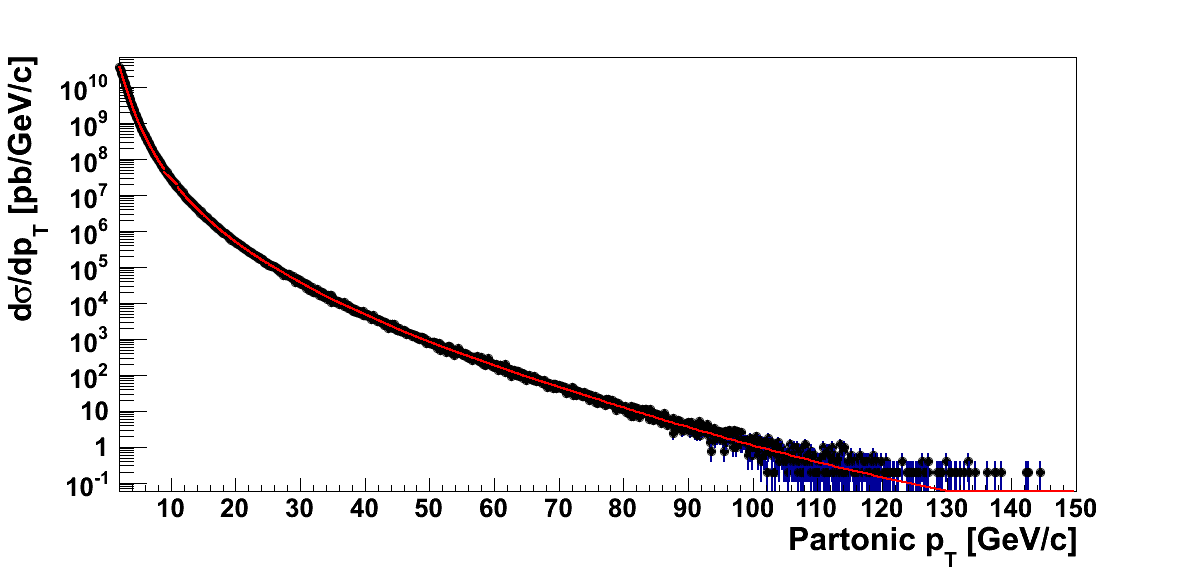 |
In Fig. 1 I show the resulting cross sections as a function of partonic pT for the various samples of primordial kT. The individual partonic pT bins are fitted with their respective fit functions (red curves). In all cases, the final spectra are nicely continuous.
Figure 2
 |
 |
 |
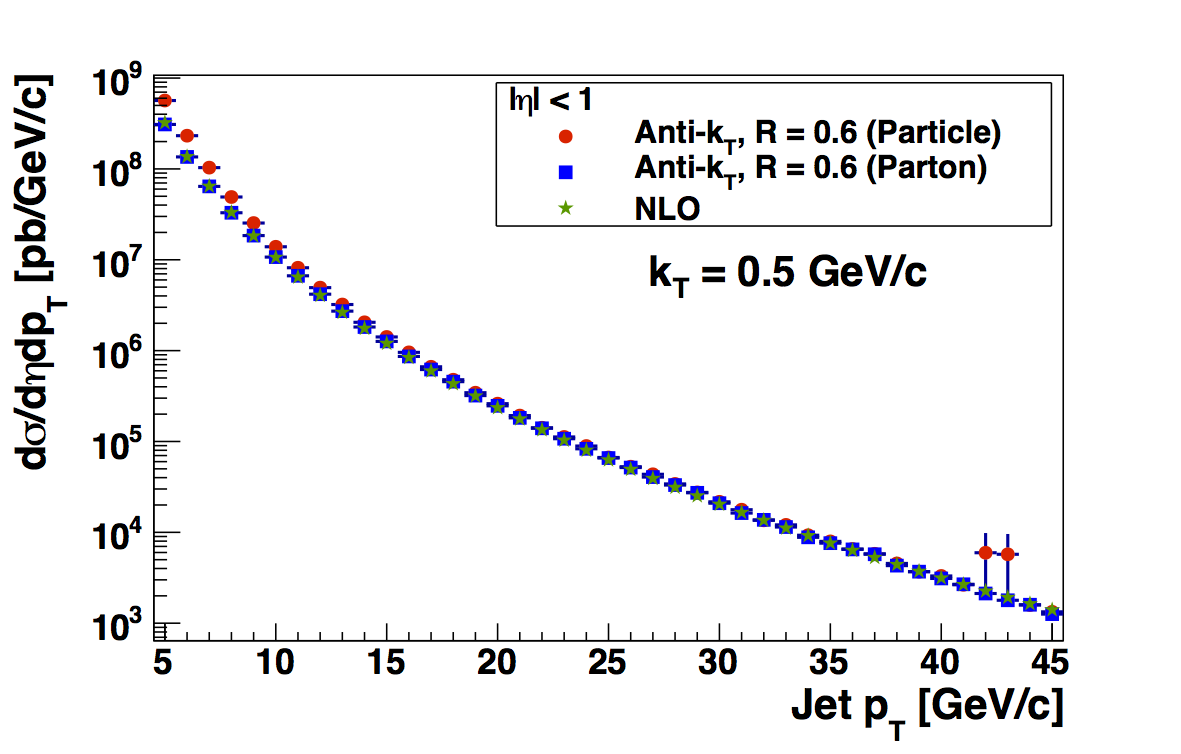 |
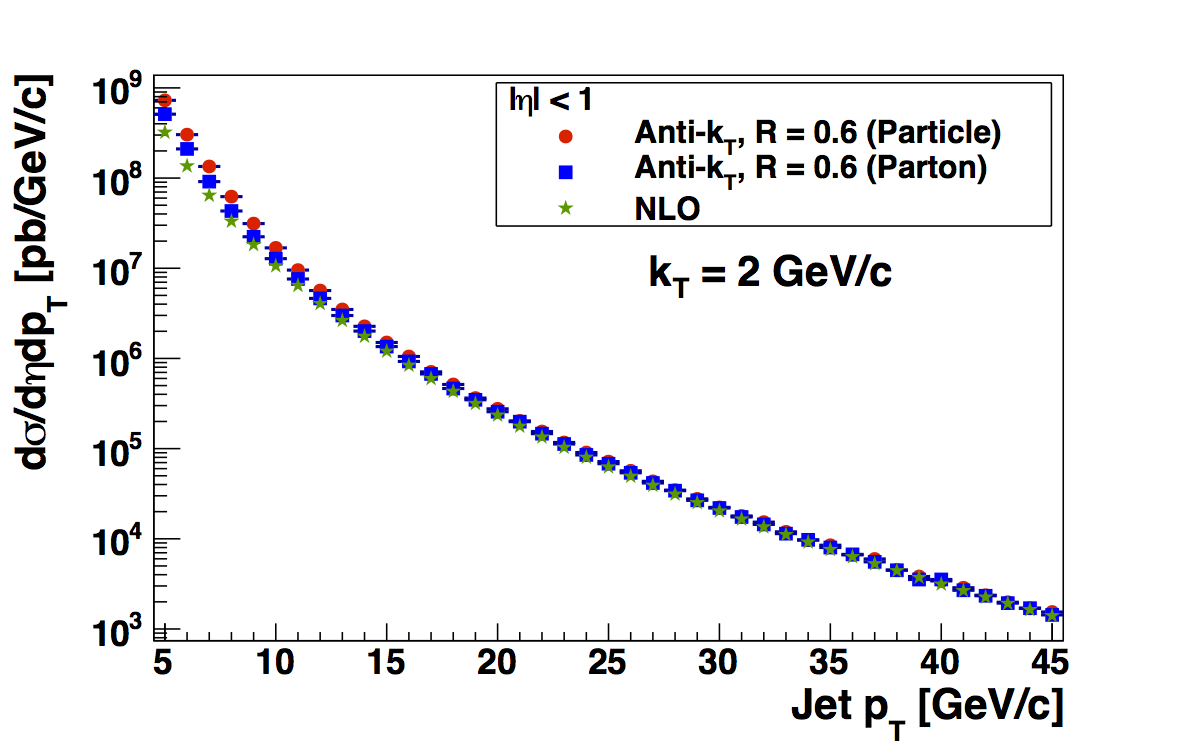
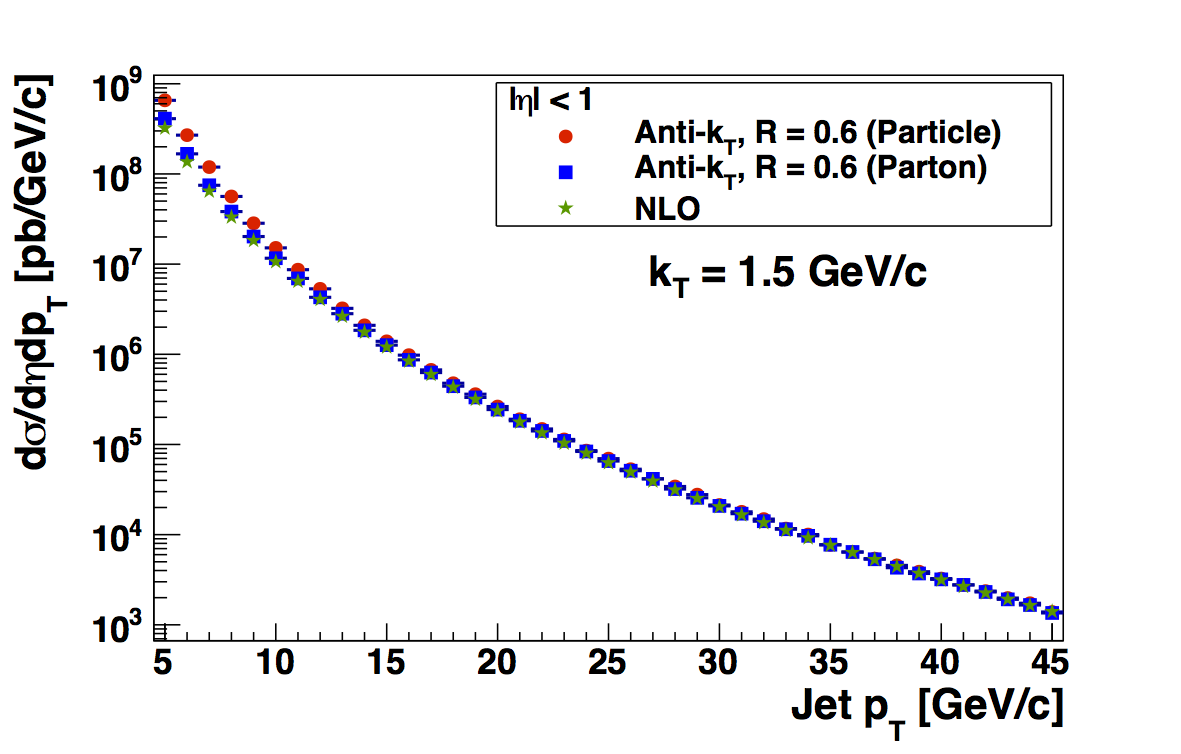
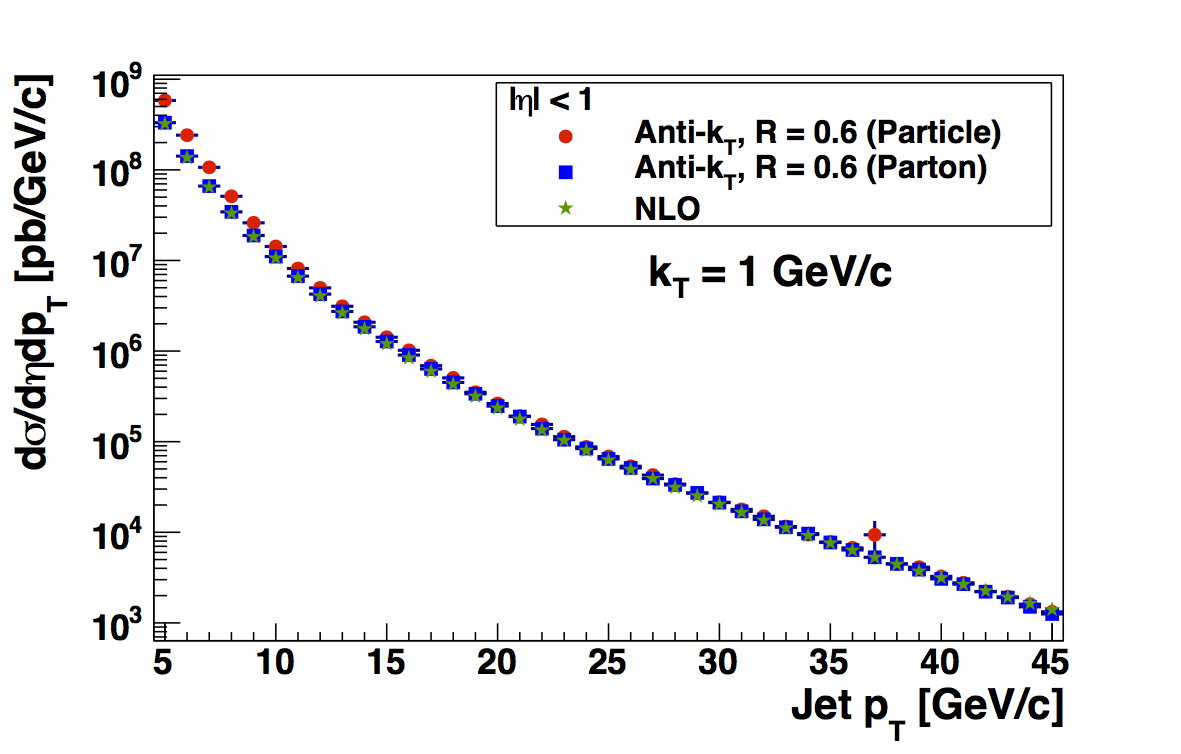
Resulting jet cross sections (Fig. 2) are qualitatively similar to previous results. Again, particle jets diverage at low jet pT in all cases. Here, as before, I have used fudge factors derived from the kT = 1 partonic pT spectra for both the kT = 1 GeV/c jets and the kT = 0.5 GeV/c jets.
Figure 3
 |
 |
 |
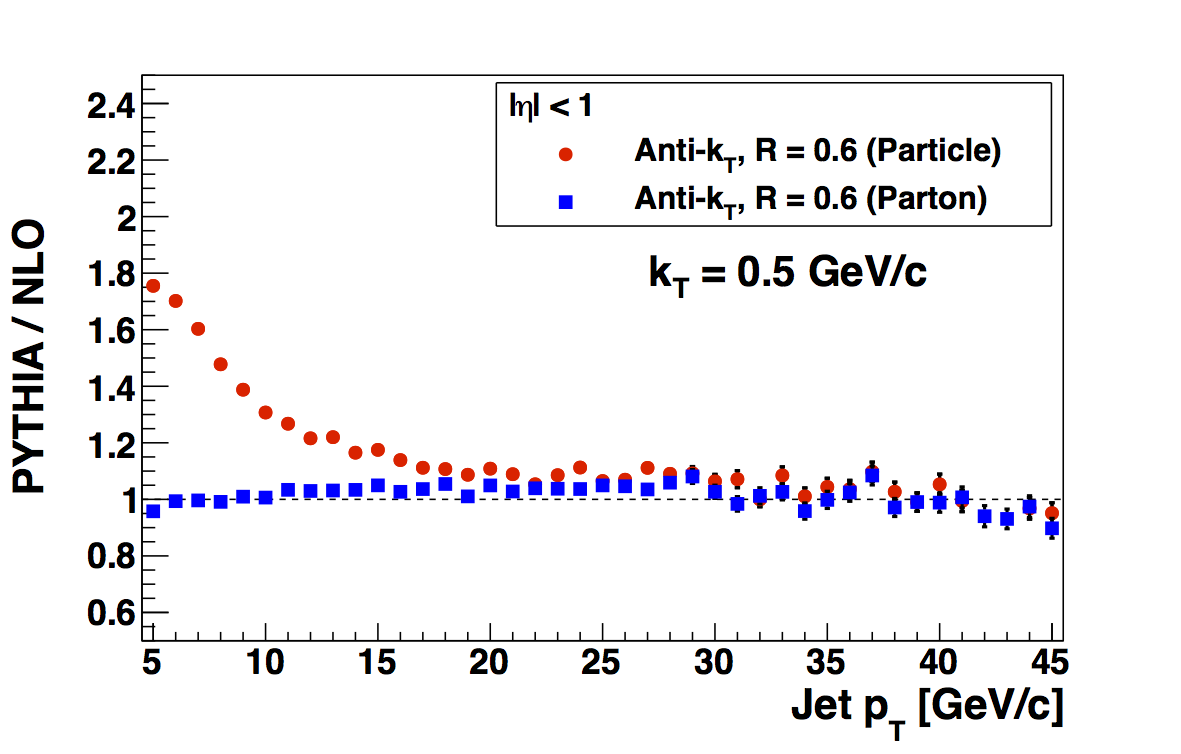 |
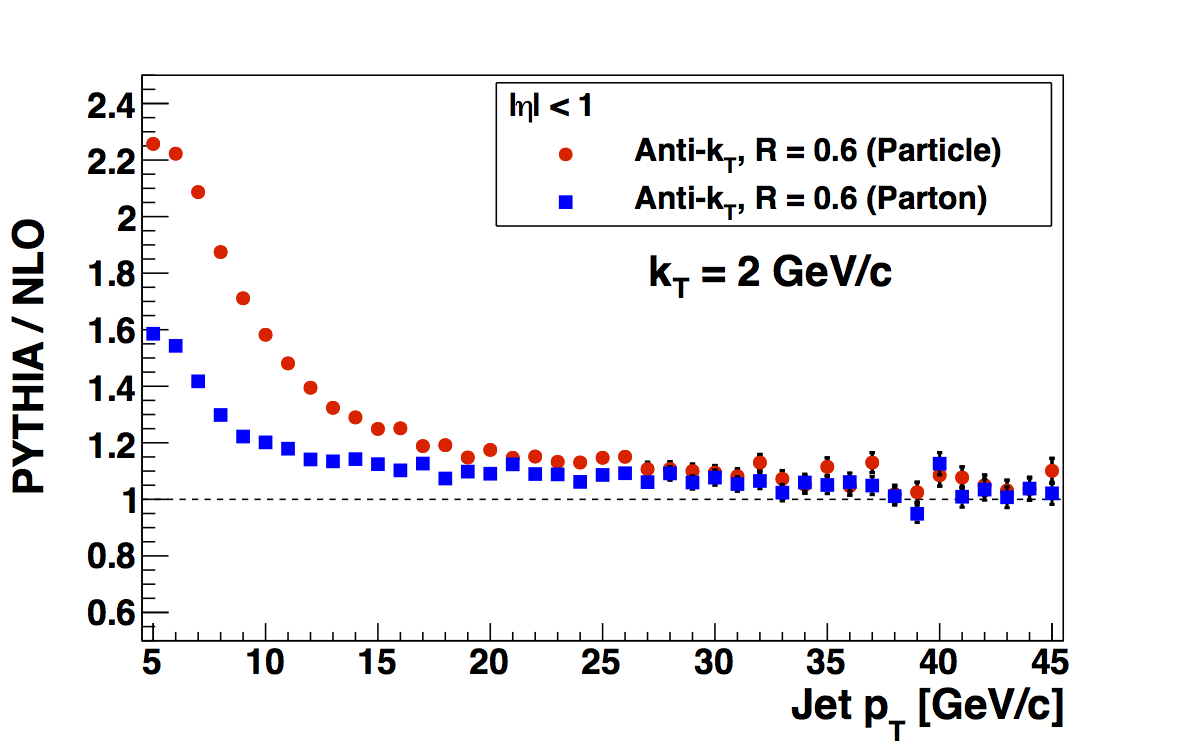
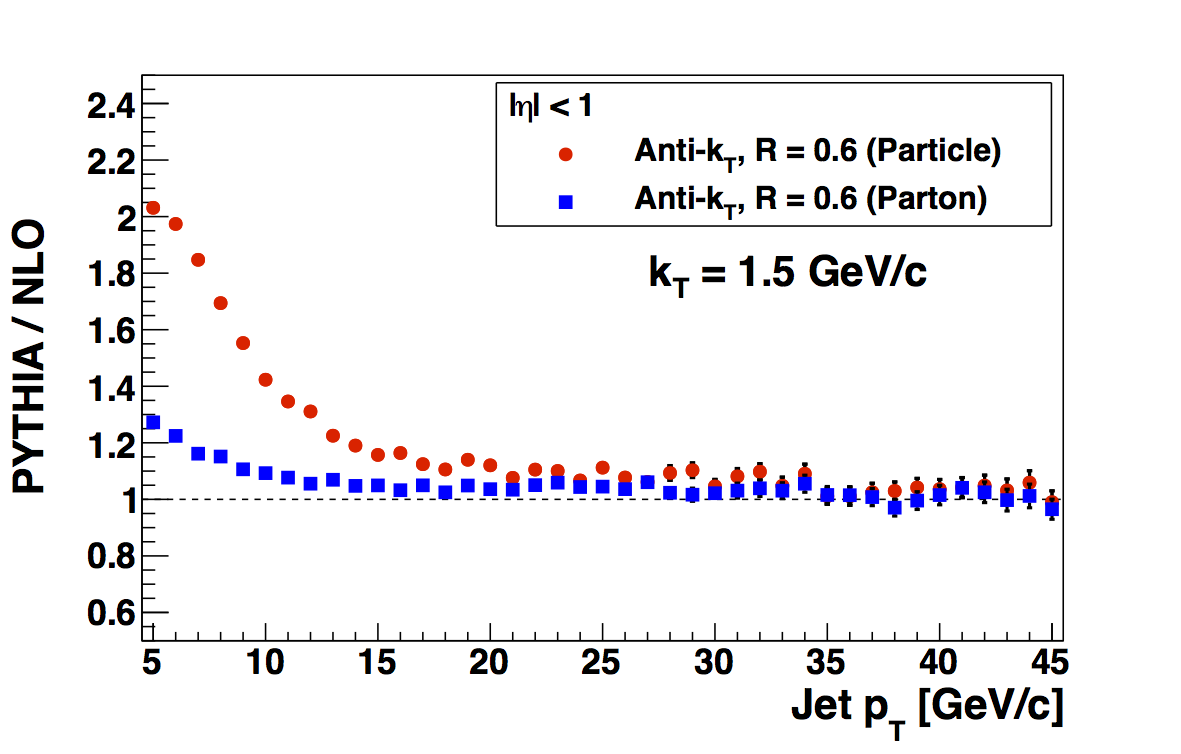
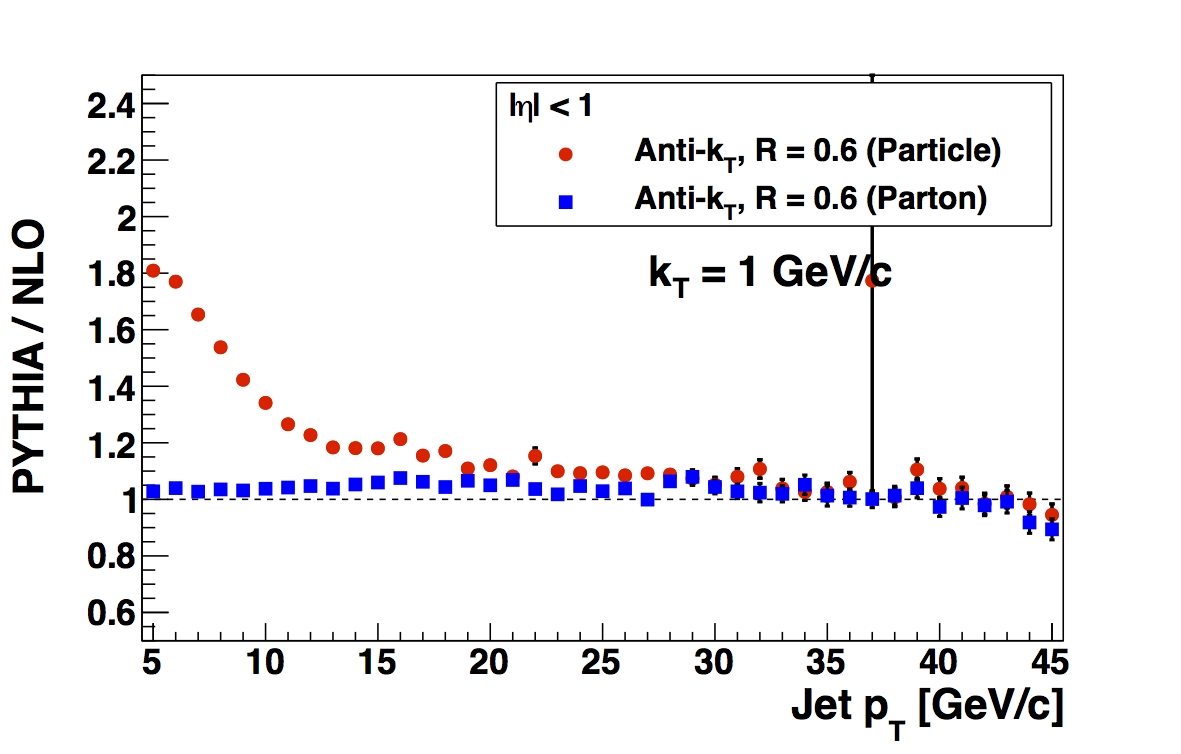
In Fig. 3 I show the ratios of PYTHIA to NLO. Relative to previous results, these show about a 10-15% vertical shift. However, the qualitative features remain unchanged.
Figure 4
| Using kT = 1 GeV/c FFs | Using kT = 0.5 GeV/c FFs |
 |
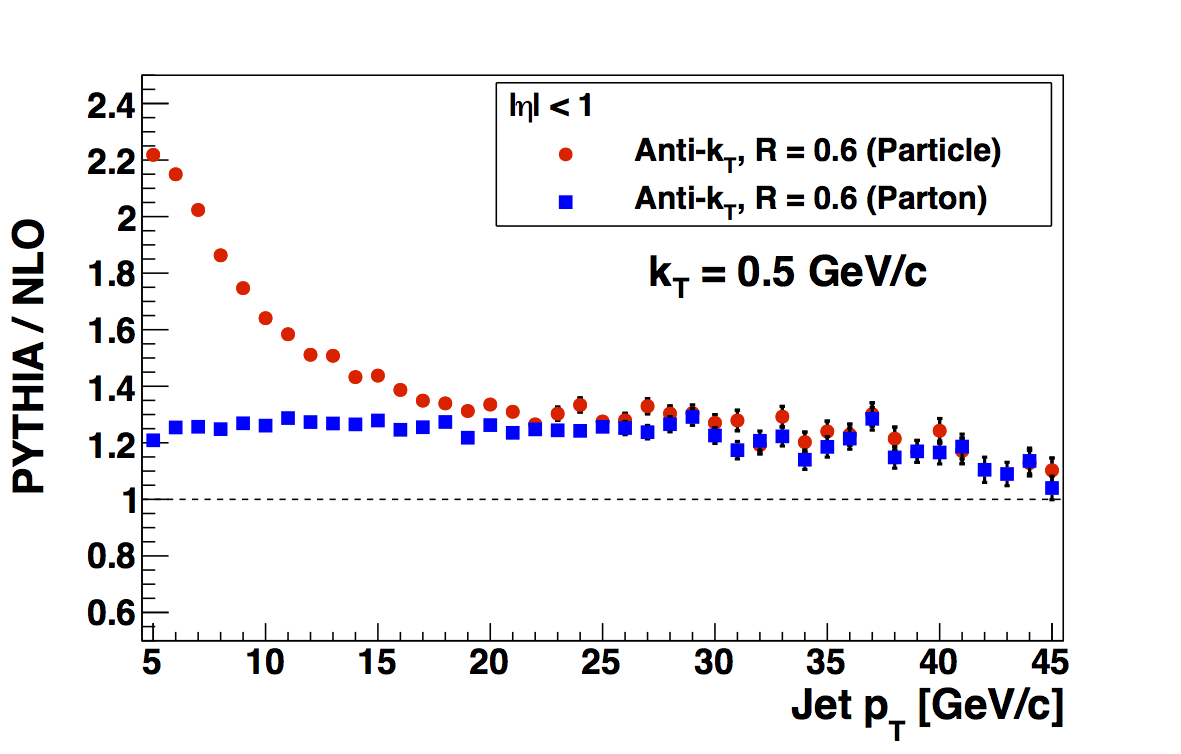 |
In Fig. 4 I show the comparison of the PYTHIA/NLO ratio for kT = 0.5 GeV/c jets using the fudge factors derived from the kT = 1 GeV/c partonic pT spectra to using those of the kT = 0.5 GeV/c partonic pT spectra. The qualititative features are the same, save a vertical shift of ~20% and a bit of an enhancement in the particle jet divergeance from NLO at low jet pT.
- drach09's blog
- Login or register to post comments
