- drach09's home page
- Posts
- 2022
- 2020
- June (1)
- 2019
- 2018
- 2017
- 2016
- 2015
- 2014
- December (13)
- November (2)
- October (5)
- September (2)
- August (8)
- July (9)
- June (7)
- May (5)
- April (4)
- March (4)
- February (1)
- January (2)
- 2013
- December (2)
- November (8)
- October (5)
- September (12)
- August (5)
- July (2)
- June (3)
- May (4)
- April (8)
- March (10)
- February (9)
- January (11)
- 2012
- 2011
- October (1)
- My blog
- Post new blog entry
- All blogs
Run-13 W Embedding: Test Sample QA
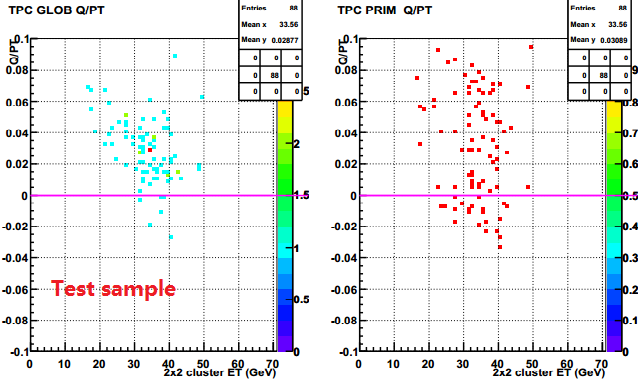
As a test sample for 2013, we have produced 258 events, each, for W+→e++ν and W-→e-+ν. Jinlong has provided some nice Q/A plots for comparison to the 2012 production.
Figure 1
| 2013 W+→e++ν Test | 2012 W+→e++ν Embedding |
 |
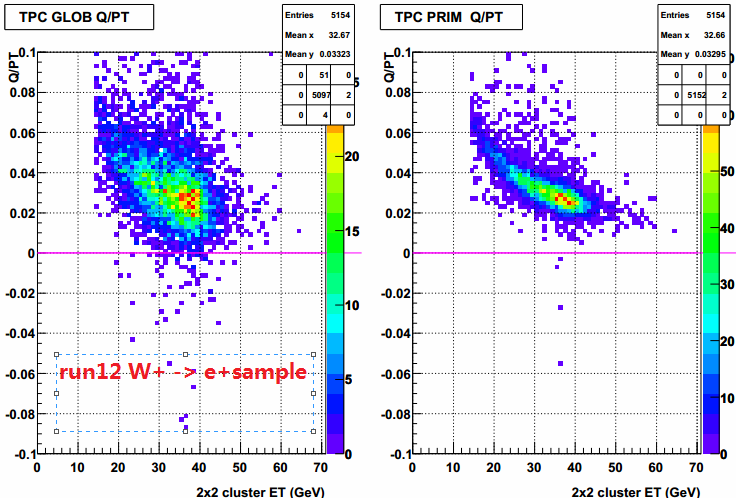 |
In Fig. 1 I show a comparison of the 2013 test production to the 2012 production for W+. Statistics are still sparse; so, at this stage, conclusions may be premature. The mean 2013 ET is ~33.6 GeV compared to 32.7 GeV in 2012. The mean Q/pT is ~0.030/GeV/c in 2013 compared to 0.033/GeV/c in 2012. The RMS may be different, as well; but that stat was not provided. The shift from global to primary tracks does not appear to improve the distributions in the small 2013 sample as in the 2012 production. Perhaps, it's small statistics, but it might be good for me to check that the proper vertex finder is utilized.
Figure 2
| 2013 W+→e++ν Test | 2013 W-→e-+ν Test |
 |
 |
 |
 |
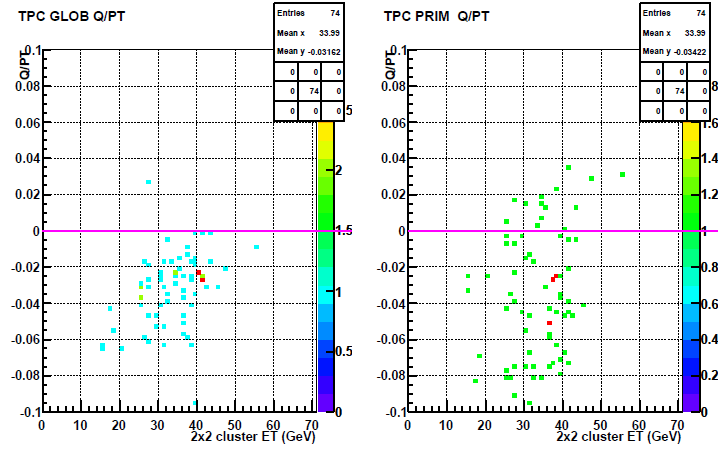
In Fig. 2 I show a comparison of the W+ and W- samples for the 2013 test production. In general the comparisons between the two are fairly consistent. Jinlong feels like the efficiency is reasonable.
Figure 3
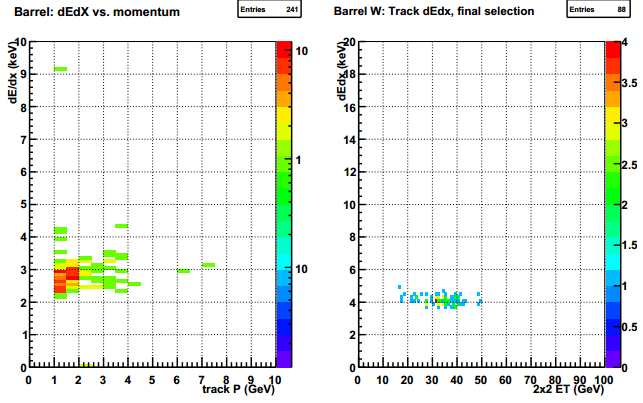
In Fig. 3 I show the dE/dx of the W+ sample for the 2013 test production.
- drach09's blog
- Login or register to post comments
