Measurements of the jet sub-structure in pp and AuAu - Preliminary Plots from Hard Probes 2018
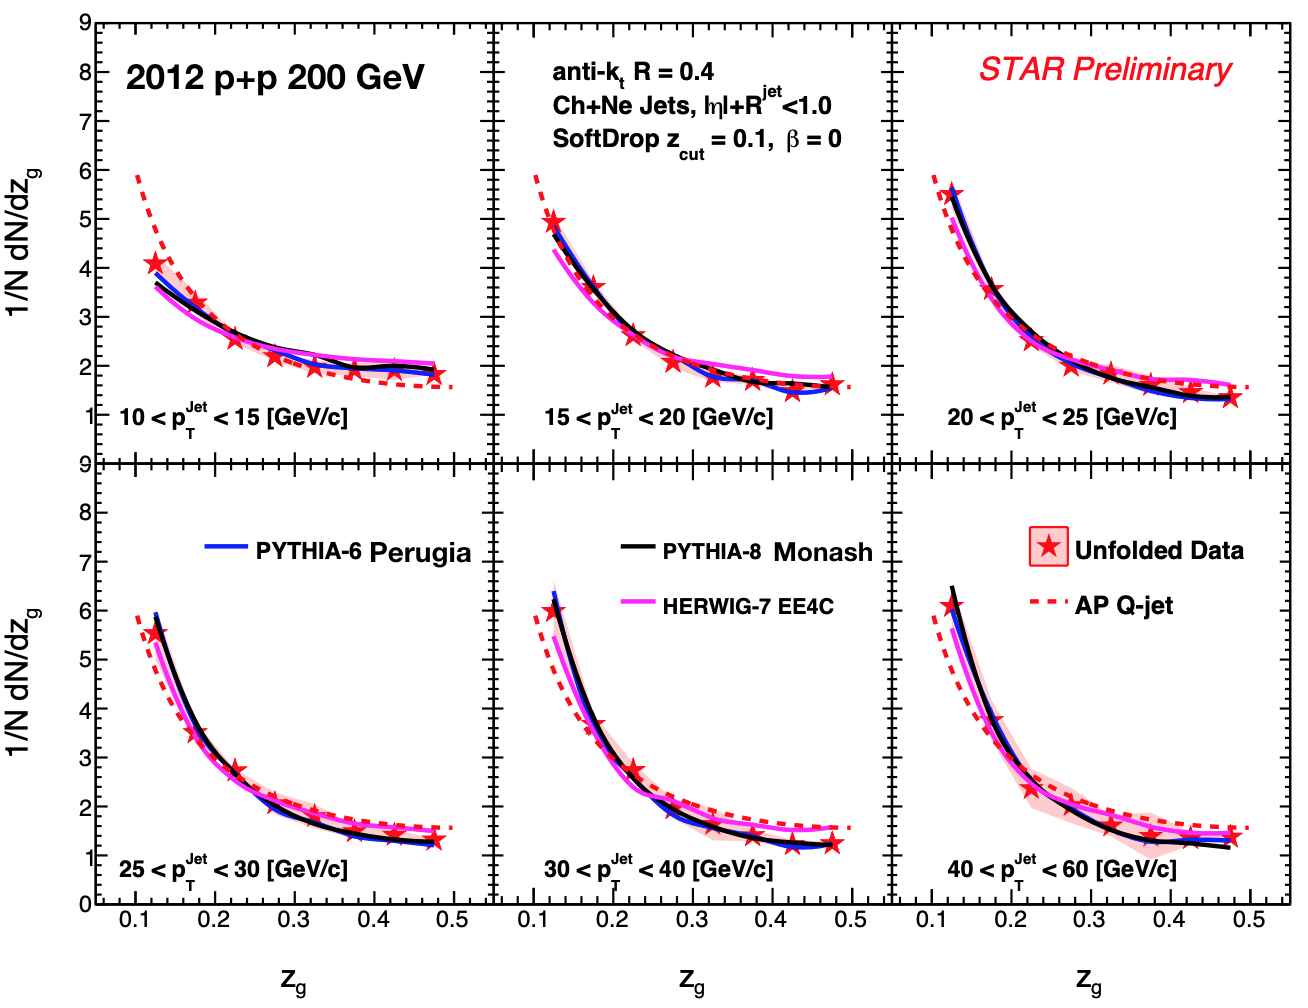
Figure 1: Fully unfolded measurement of the SoftDrop groomed subjet shared momentum fraction (zg) in p+p collisions at \sqrt{s} = 200 GeV for anti-kt R=0.4 Charged + Neutral jets of varying transverse momenta (10 < pT < 15 GeV in top left to 40 < pT < 60 GeV in bottom right). The data in solid red star markers with systematic uncertainties represented as shared red regions (statistical errors are in most cases smaller than the marker size) is compared to leading order Monte Carlo models; PYTHIA-8 (Monash Tune, solid black line), PYTHIA-6 (Perugia Tune, solid blue line), HERWIG-7 (EE4C Tune, solid magenta line). The data are also compared with the AP splitting kernel for quark jets in all the panels shown in red dashed line.
Observations :
- Data and MC are comparable in all pT bins
- Shape of the zg distribution becomes steeper as jet pT increases but shows no dependence beyond jet pT ~ 20 GeV
-----------------------------------------------------------------------------------------------------------------------------------------------------------------------------------------
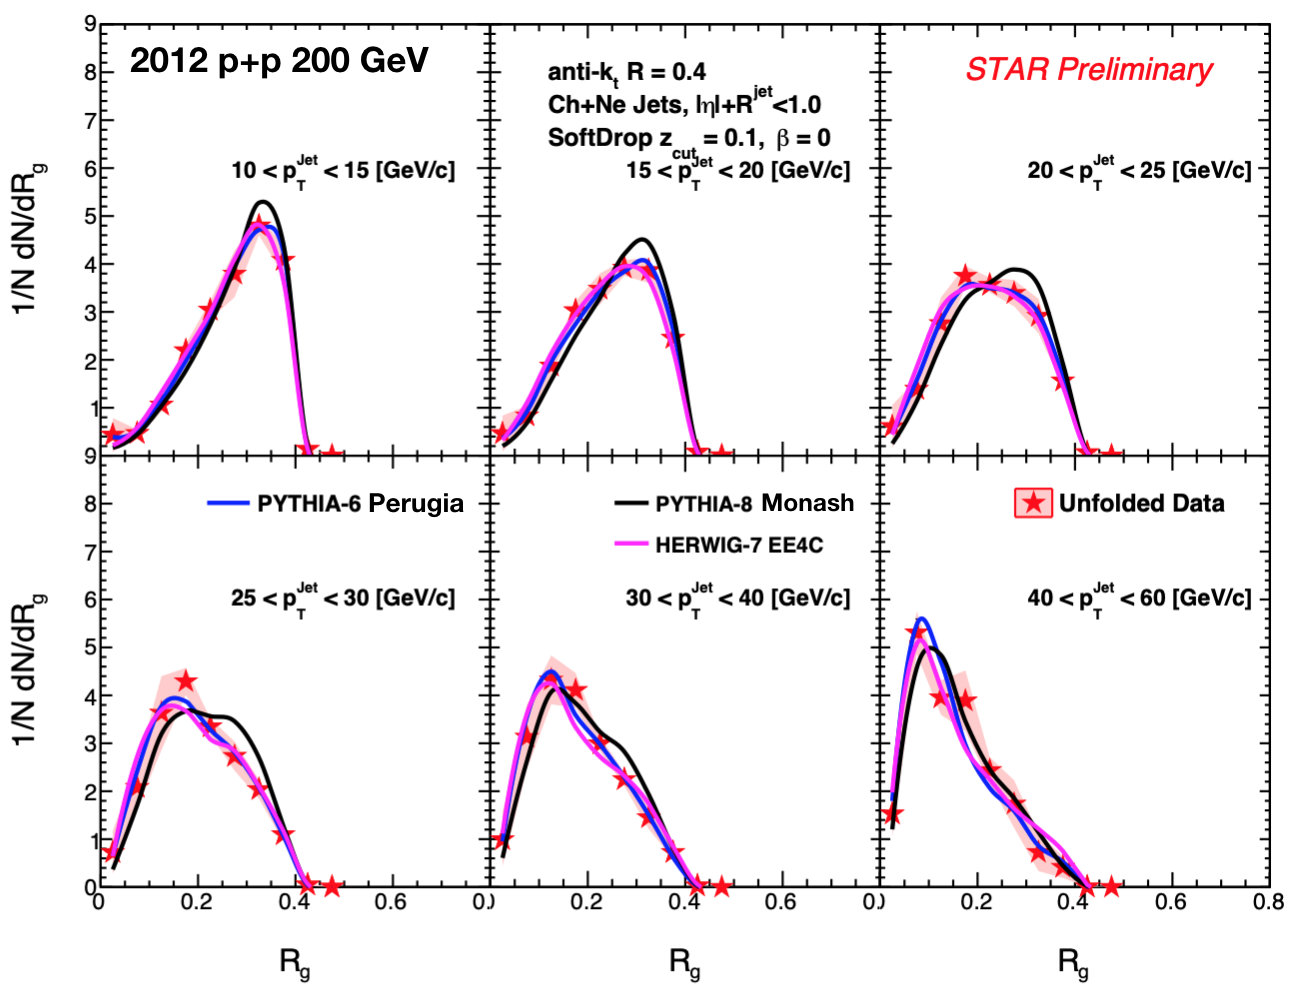
Figure 2: Fully unfolded measurement of the SoftDrop groomed jet radius (Rg) in p+p collisions at \sqrt{s} = 200 GeV for anti-kt R=0.4 Charged + Neutral jets of varying transverse momenta (10 < pT < 15 GeV in top left to 40 < pT < 60 GeV in bottom right). The data in solid red star markers with systematic uncertainties represented as shared red regions (statistical errors are in most cases smaller than the marker size) is compared to leading order Monte Carlo models; PYTHIA-8 (Monash Tune, solid black line), PYTHIA-6 (Perugia Tune, solid blue line), HERWIG-7 (EE4C Tune, solid magenta line).
Observations :
- SoftDrop Rg reflects the narrowing of jet structure due to increase in jet pT
- Data and MC are comparable in all pT bins
-----------------------------------------------------------------------------------------------------------------------------------------------------------------------------------------
.png)
Figure 3: Radial scans of of the SoftDrop groomed subjet shared momentum fraction (zg) in p+p collisions at \sqrt{s} = 200 GeV for anti-kt R=0.2 (top), R=0.4 (middle) and R=0.6 (bottom) Charged + Neutral jets of varying transverse momenta (10 < pT < 15 GeV in left to 30 < pT < 40 GeV in right). The data in solid red star markers with systematic uncertainties represented as shared red regions (statistical errors are in most cases smaller than the marker size) is compared to leading order Monte Carlo models; PYTHIA-8 (Monash Tune, solid black line), PYTHIA-6 (Perugia Tune, solid blue line), HERWIG-7 (EE4C Tune, solid magenta line). The data are also compared with PYTHIA-8 w/o hadronization in the dashed black line in all the panels.
Observations :
- zg distribution becomes entirely flat for R=0.2 jets at low pT and increasing jet pT recovers the universal 1/z behavior
- Moderate effect of hadronization particularly at small values zg for jets at low pT
-----------------------------------------------------------------------------------------------------------------------------------------------------------------------------------------
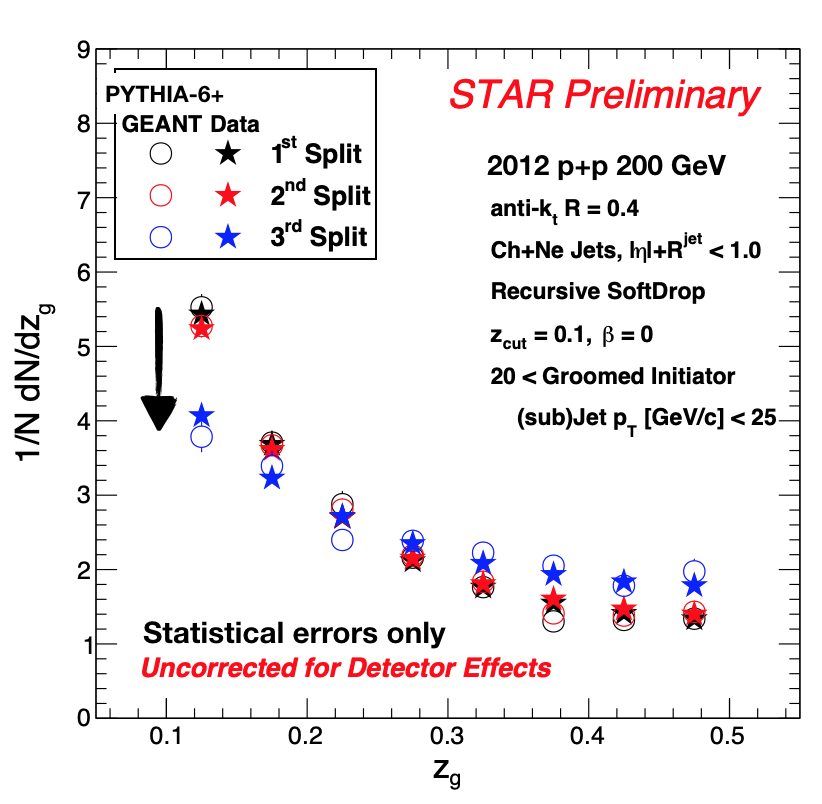
Figure 4: Measurement of the recursive SoftDrop groomed subjet shared momentum fraction (zg) in p+p collisions at \sqrt{s} = 200 GeV for anti-kt R=0.4 Charged + Neutral jets at different splitting. Each split is selected to have its groomed initiator prong to have a transverse momenta of 20 < pT < 25 GeV. The zg distribution for the first split is shown in red star for the uncorrected data and compared with PYTHIA6+GEANT simulation in the open circles. Second and third splits are shown in the red and blue colors.
Observations :
- zg for the first and second plots are consistent with each other.
- The third split is constrained in the angular phase space leading to a much flatter zg distribution
-----------------------------------------------------------------------------------------------------------------------------------------------------------------------------------------
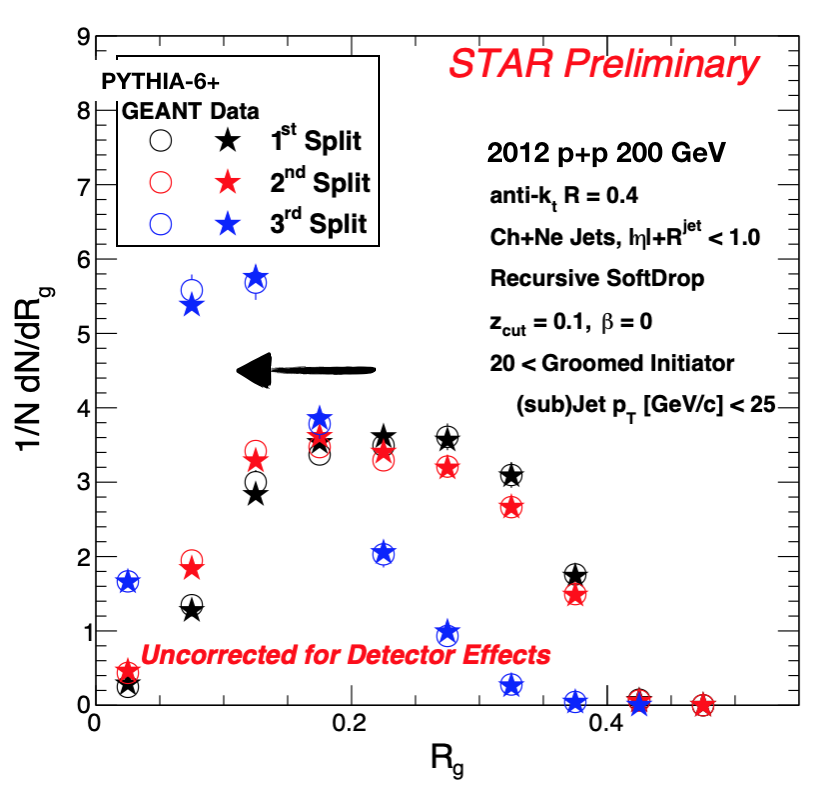
Figure 5: Measurement of the recursive SoftDrop groomed jet radius (Rg) in p+p collisions at \sqrt{s} = 200 GeV for anti-kt R=0.4 Charged + Neutral jets at different splitting. Each split is selected to have its groomed initiator prong to have a transverse momenta of 20 < pT < 25 GeV. The zg distribution for the first split is shown in red star for the uncorrected data and compared with PYTHIA6+GEANT simulation in the open circles. Second and third splits are shown in the red and blue colors.
Observations :
- Rg for the first and second plots are consistent with each other.
- The third split Rg is very much narrow compared to the first two splits as a result of its constrained in the angular phase
-----------------------------------------------------------------------------------------------------------------------------------------------------------------------------------------
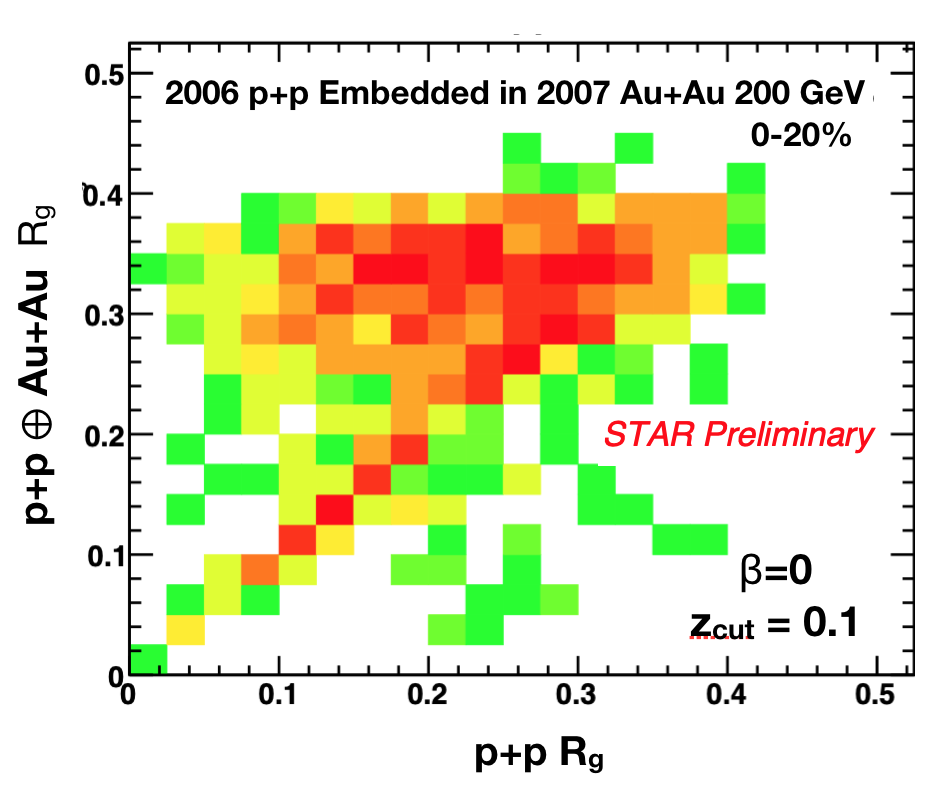
Figure 6: Correlation between the SoftDrop Groomed jet radius (for R=0.4 anti-kt Ch+Ne jets 20 < pT < 30 GeV) in p+p collisions to the p+p embedded in Au+Au 0-20% central events.
Observations :
- Rg is sensitive to the AuAu underlying event leading to a non-diagonal structure in the correlation. With the Rg observable - we have a small signal/background ratio if we select jets with a particular angular scale.
-----------------------------------------------------------------------------------------------------------------------------------------------------------------------------------------
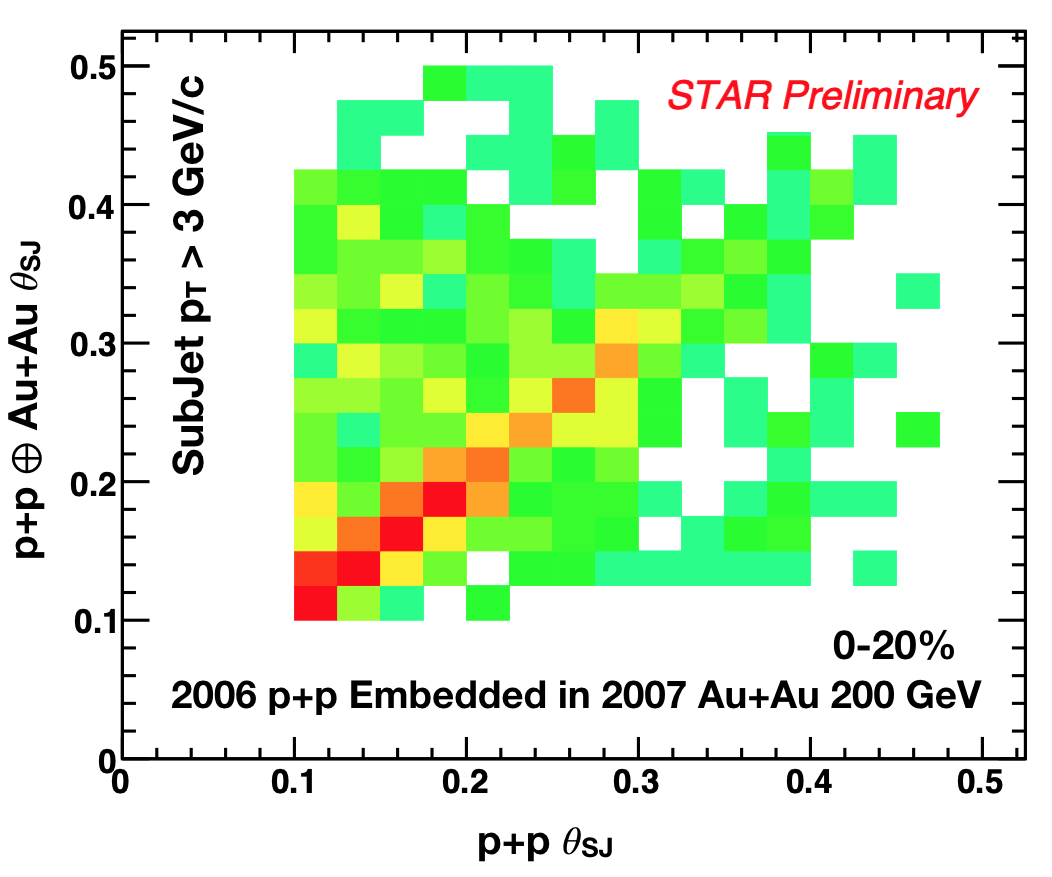
Figure 7: Correlation between the TwoSubJet Theta (for R=0.4 anti-kt Ch+Ne jets and R=0.1 anti-kt subjets 20 < pT < 30 GeV) in p+p collisions to the p+p embedded in Au+Au 0-20% central events.
Observations :
- TwoSubJet Theta is less sensitive to the AuAu underlying event leading to a mostly diagonal structure in the correlation. With this theta observable - we have sufficiently good signal/background ratio to select jets with a particular angular scale.
-----------------------------------------------------------------------------------------------------------------------------------------------------------------------------------------
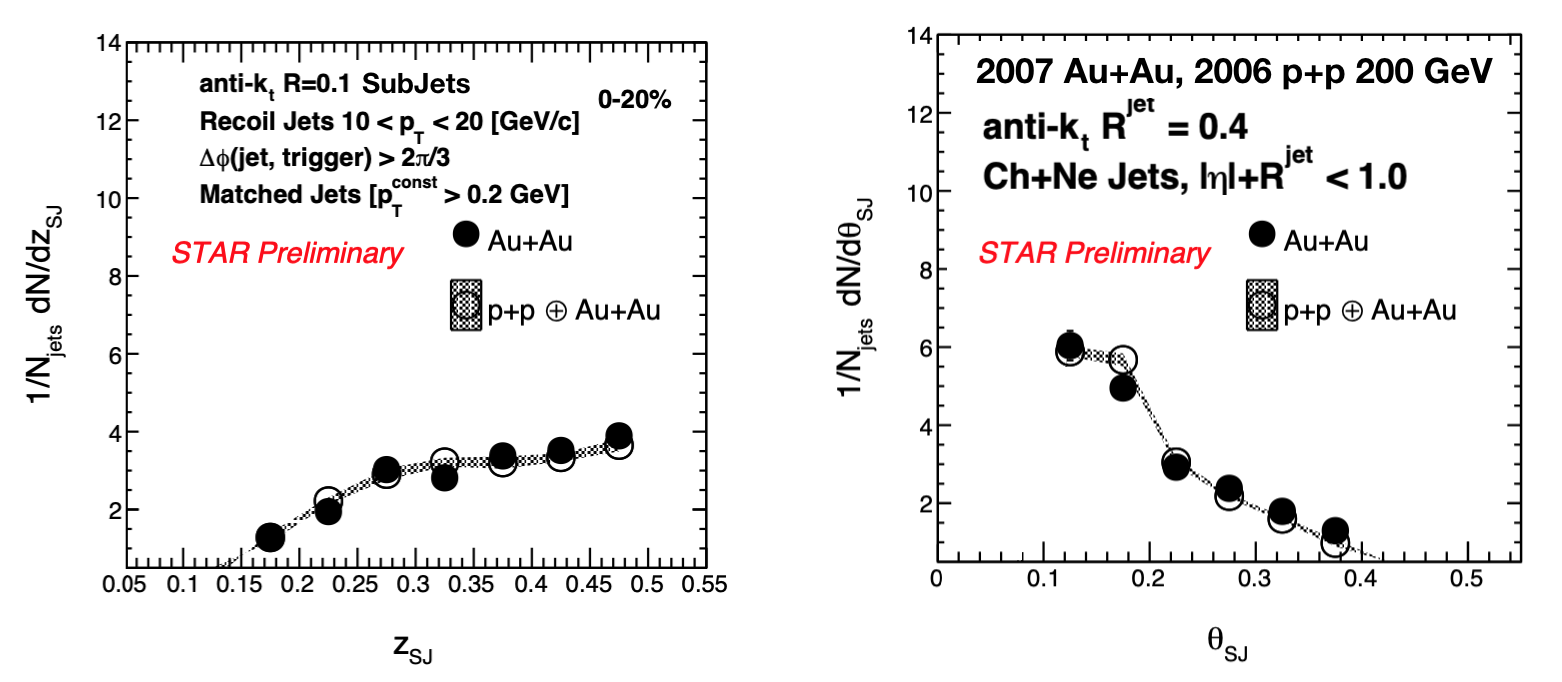
Figure 8: TwoSubJet observables (zSJ - left and ThetaSJ - right) comparing Au+Au (solid circles) and p+p Embedded in Au+Au (open circles including the systematic uncertainties in the shaded region) for recoil matched jets (anti-kt R=0.4 Ch+Ne, R=0.1 subjets) in the pT range 10-20 GeV.
Observations :
- Distributions are similar for p+p Emb Au+Au and Au+Au within our systematics.
- zSJ shows a trend towards larger values which in vacuum is indicative of earlier splits with regards to its formation time.
-----------------------------------------------------------------------------------------------------------------------------------------------------------------------------------------
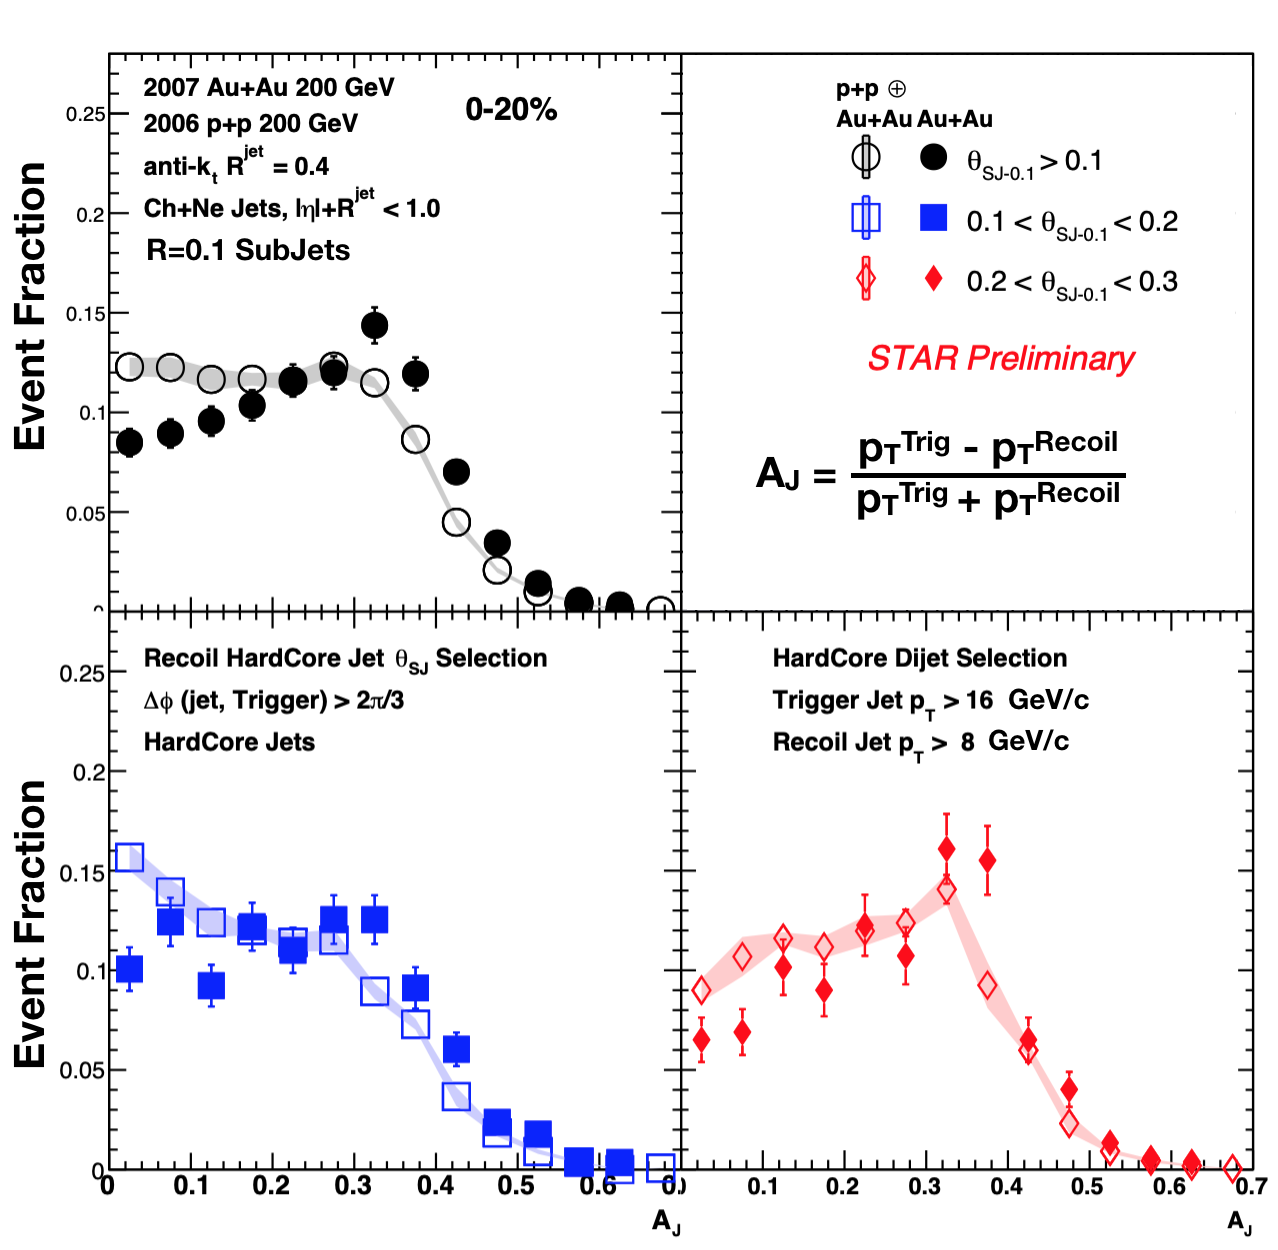
Figure 9: HardCore Dijet Asymmetry (AJ) for events with leading and subleading cut of 16, 8 GeV respectively. The filled markers correspond to Au+Au and the open markers along with the shaded regions show p+p Embedded in Au+Au. The black distributions do not have any cuts on the TwoSubJet Theta whereas the blue and the red apply selections on recoil jets with 0.1 < Theta < 0.2 and 0.2 < Theta < 0.3.
Observations :
- For all theta selections shown, the hardcore Aj is consistently imbalanced between Au+Au and p+p
- For theta selections, the inherent Aj distributions are themselves modified.
- We dont observe any significant difference between different theta selections
-----------------------------------------------------------------------------------------------------------------------------------------------------------------------------------------
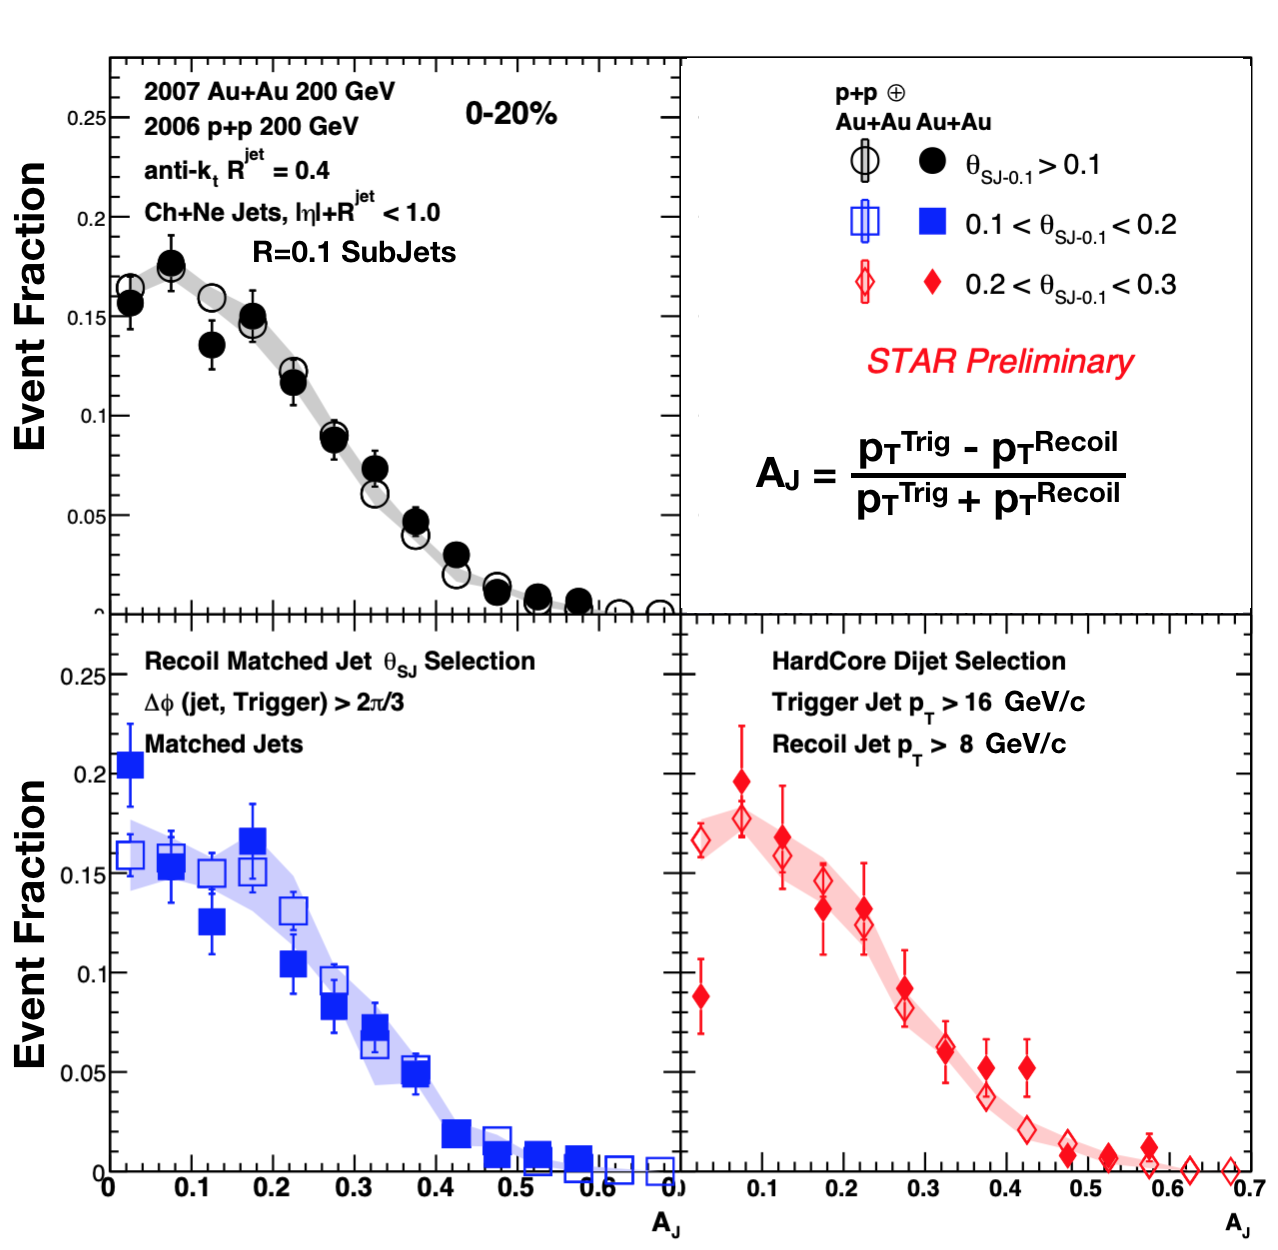
Figure 9: Matched Dijet Asymmetry (AJ) for events with leading and subleading cut of 16, 8 (for HardCore jets) GeV respectively. The filled markers correspond to Au+Au and the open markers along with the shaded regions show p+p Embedded in Au+Au. The black distributions do not have any cuts on the TwoSubJet Theta whereas the blue and the red apply selections on recoil jets with 0.1 < Theta < 0.2 and 0.2 < Theta < 0.3.
Observations :
- For all theta selections shown, the matched Aj is consistently balanced between Au+Au and p+p
- We dont observe any significant difference between different theta selections
-----------------------------------------------------------------------------------------------------------------------------------------------------------------------------------------
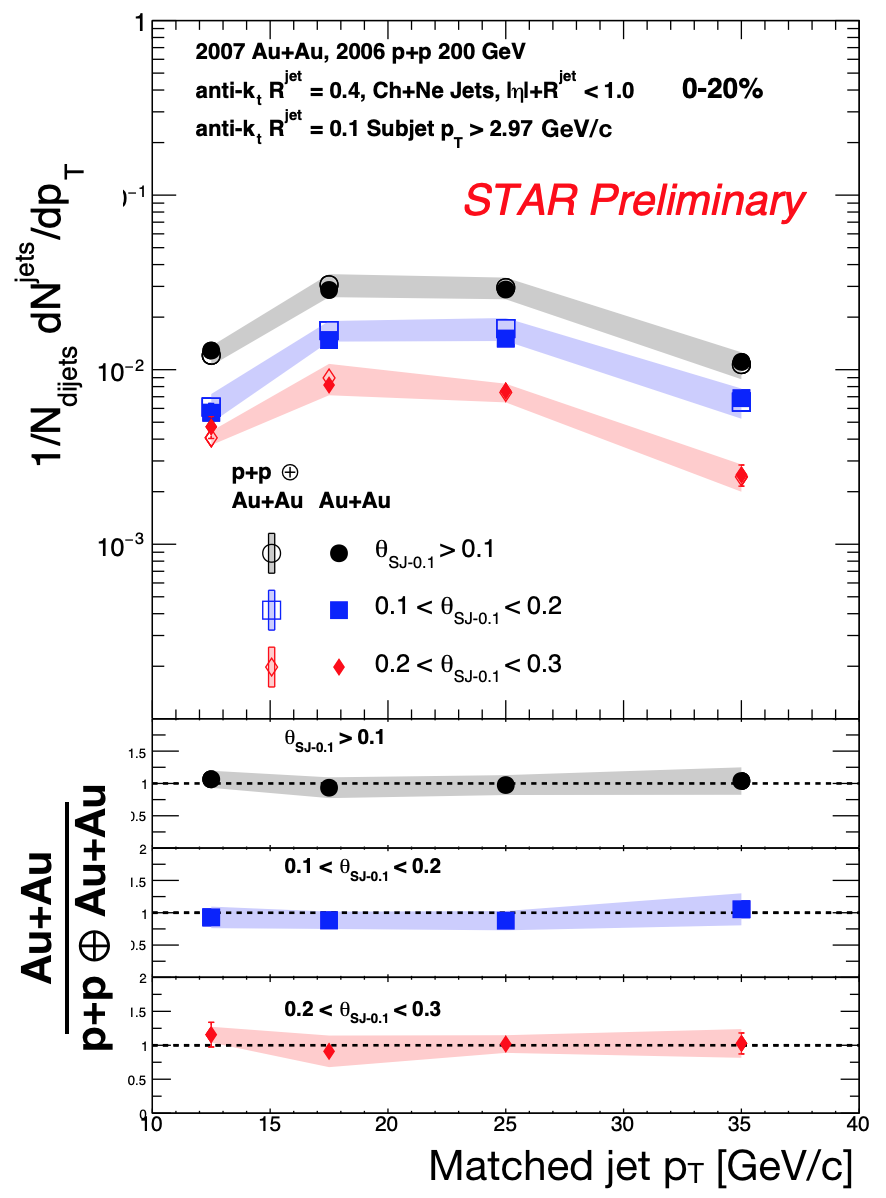
Figure 11: Matched Recoil jet yield normalized to the total number of 16-8 dijet events in the top panels and the ratio of Au+Au to p+p Emb Au+Au in the bottom three panels. The filled markers correspond to Au+Au and the open markers along with the shaded regions show p+p Embedded in Au+Au. The black distributions do not have any cuts on the TwoSubJet Theta whereas the blue and the red apply selections on recoil jets with 0.1 < Theta < 0.2 and 0.2 < Theta < 0.3.
Observations :
- For the black points, the matched jet yield shows us that we fully recover the jet pT that was quenched for the hardcore jets
- We dont observe any significant difference between different theta selections in the ratios and they are all consistent with 1.
-----------------------------------------------------------------------------------------------------------------------------------------------------------------------------------------
Figures in the backup slides
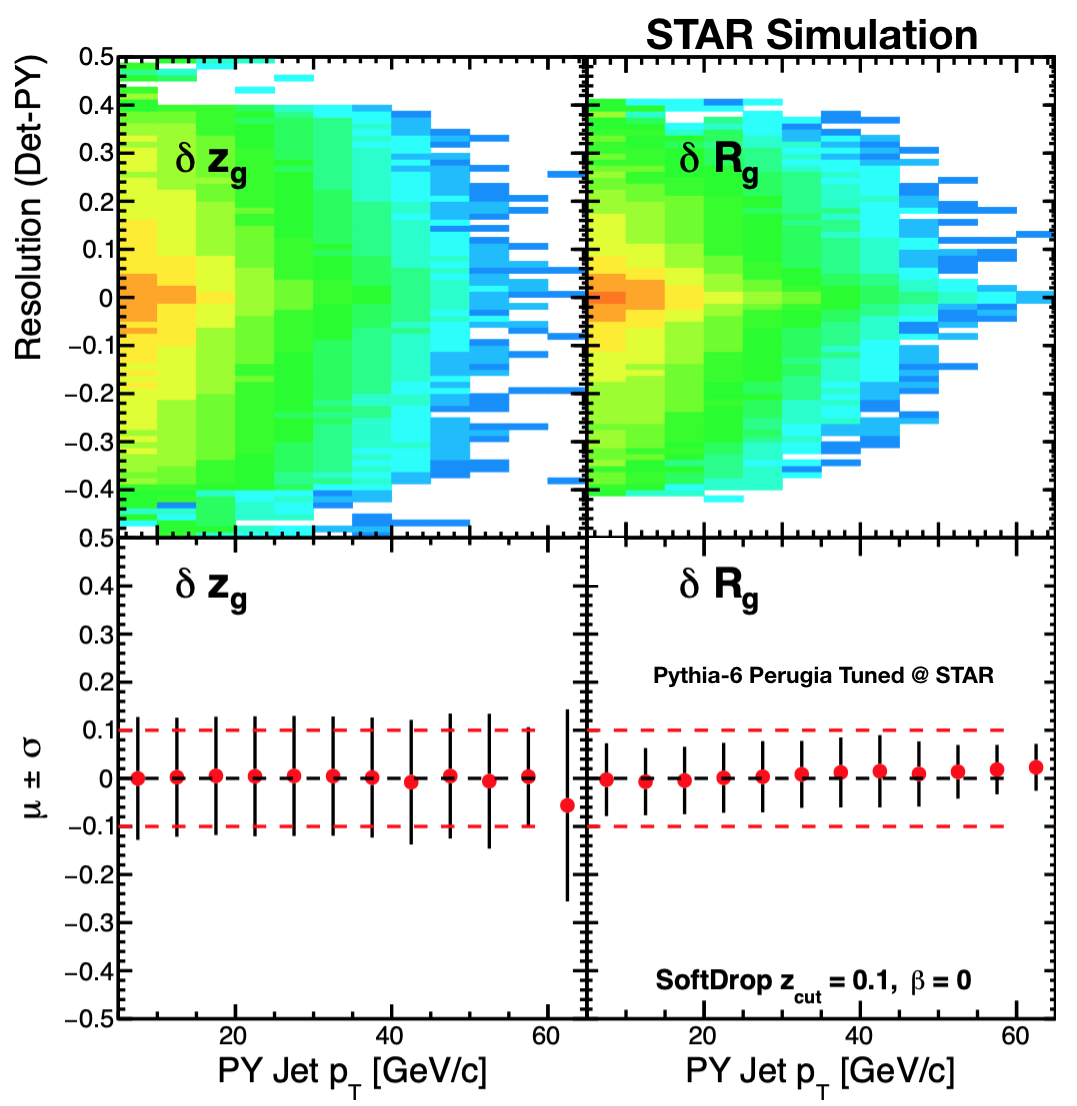
Figure 12: Difference between PYTHIA-6 generator jets and PYTHIA-6+GEANT reconstructed jets for zg (left) and Rg (right) in the top panels and the mean +/- sigma in the bottom panels as a function of the PYTHIA-6 generator jet pT.
-----------------------------------------------------------------------------------------------------------------------------------------------------------------------------------------
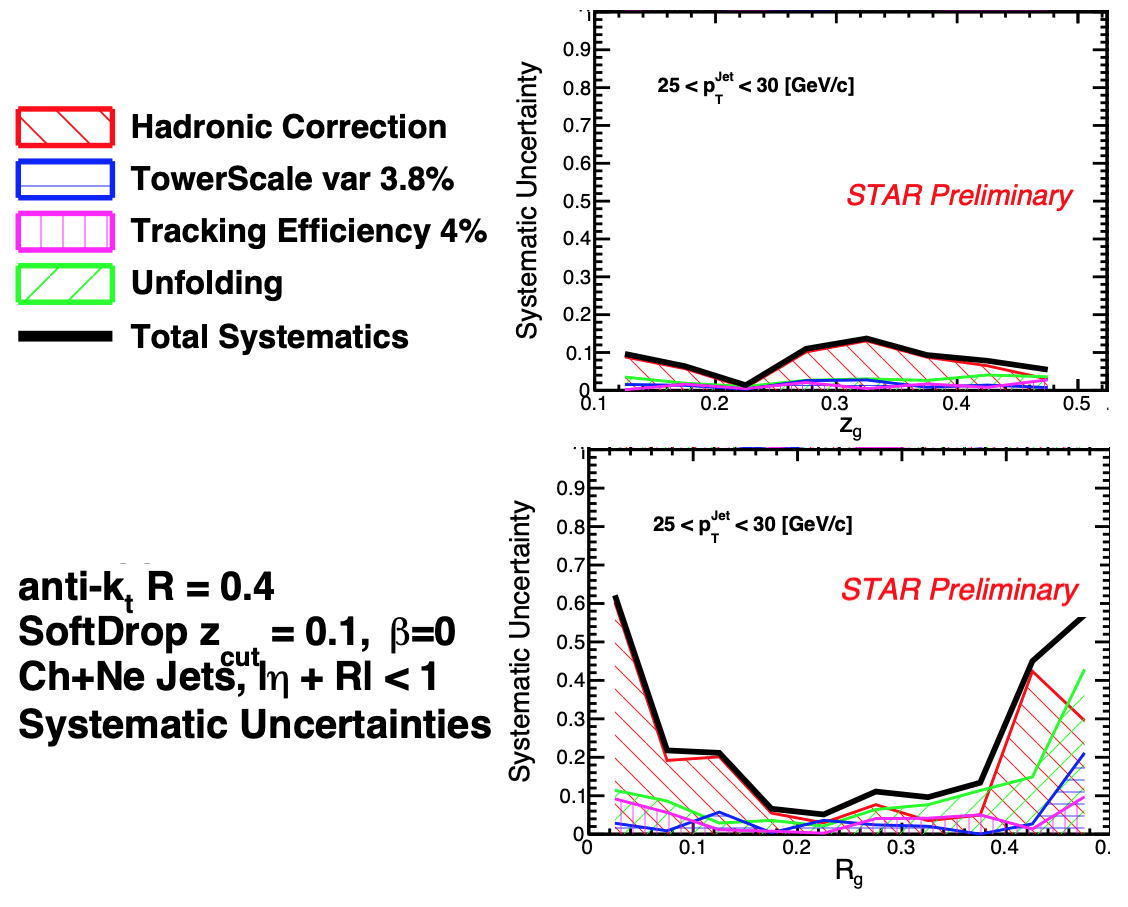
Figure 13: Systematic uncertainties for the fully unfolded zg and Rg distributions shown for a particular pT bin 25-30 GeV. the different colors and shaded regions point to different sources of uncertainties and the solid black line shows the quadrature sum.
-----------------------------------------------------------------------------------------------------------------------------------------------------------------------------------------
- elayavalli's blog
- Login or register to post comments