Run 9 Dijet det-par mass comparisons for different triggers
Taking a look at difference between detector-level dijet mass and particle-level dijet mass, plotted against the detector-level dijet mass. This is then broken into triggers.
Figure 1. Barrel-barrel dijet mass difference. These first plots have the difference of detector-level dijet mass and particle-level dijet mass on the y-axis, plotted againts detector level mass on the x-axis.
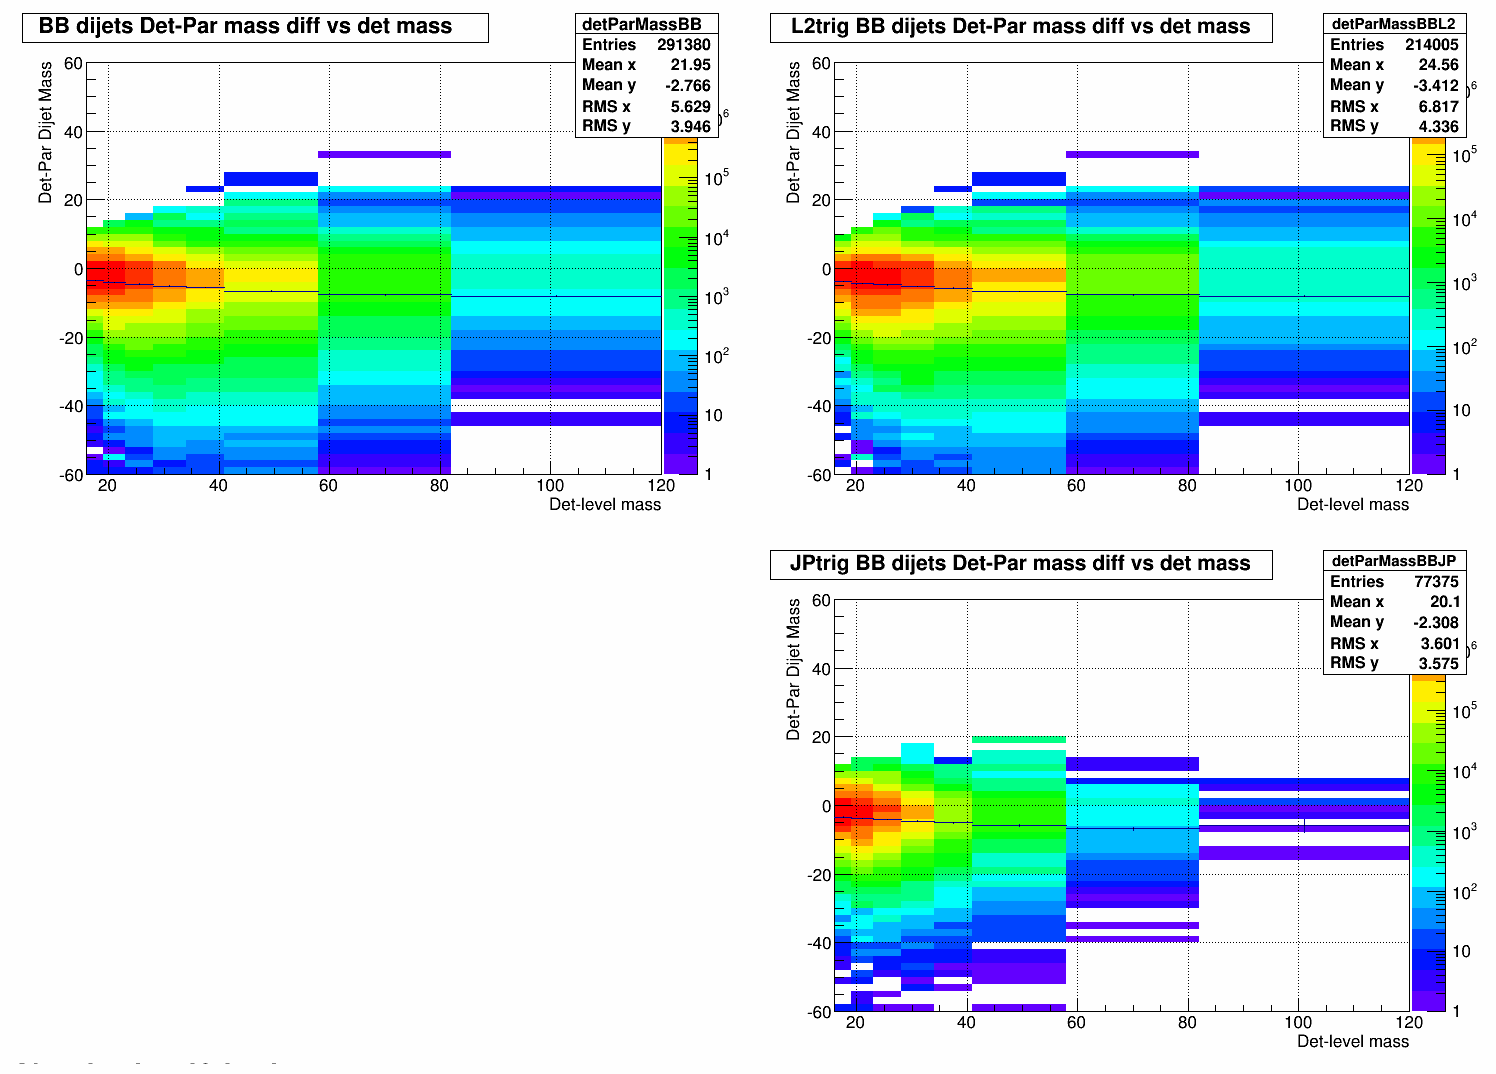
Figure 2. Profile plots for barrel-barrel dijet mass difference. (just combining the profile plots from above.)
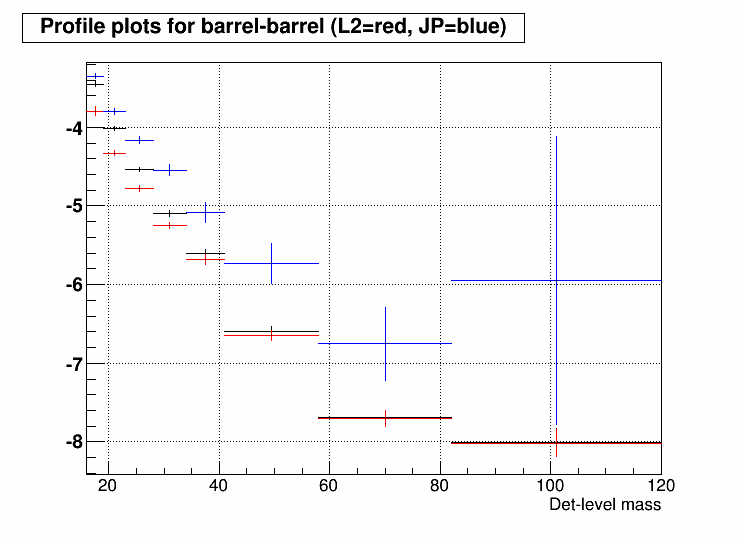
Figure 3. Barrel-endcap dijet mass difference. The first plots the difference between detector- and particle-level dijet mass for all barrel-endcap dijets againts detector dijet mass, and then this plot is broken into the two triggers L2jethigh and JP1.
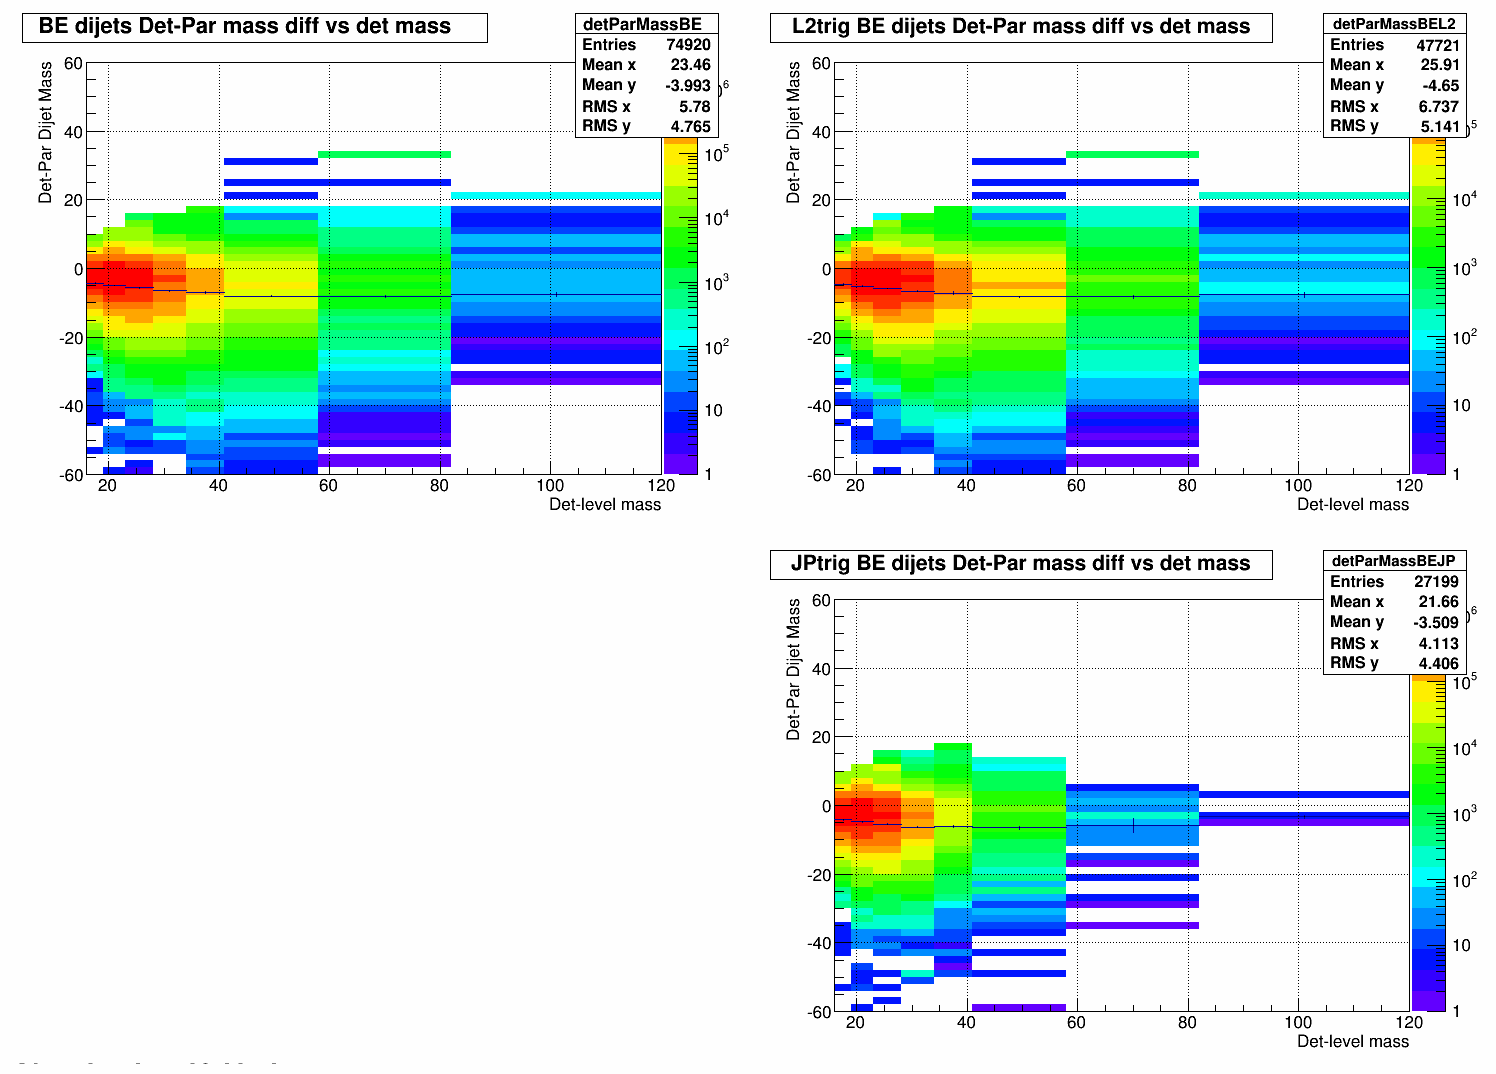
Figure 4. Profile plots for barrel-endcap dijet mass difference. Just plotting the profile plots on top of each other.
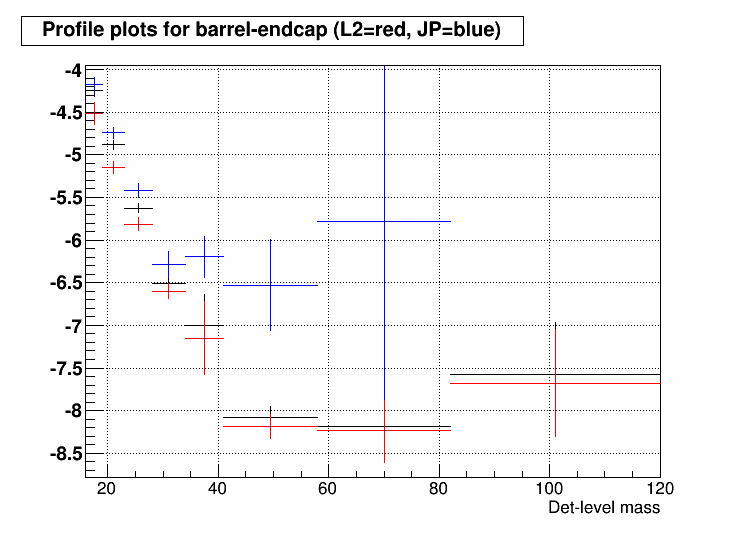
Figure 5. Looking at detEta for the endcap jet. The plots for barrel-endcap L2jetHigh and JP1 triggers are broken into the detector eta for the endcap jet. Left plots are for endcap jet with detector eta <1.4, the right two plots are for endcap jet detector eta >=1.4.
.png)
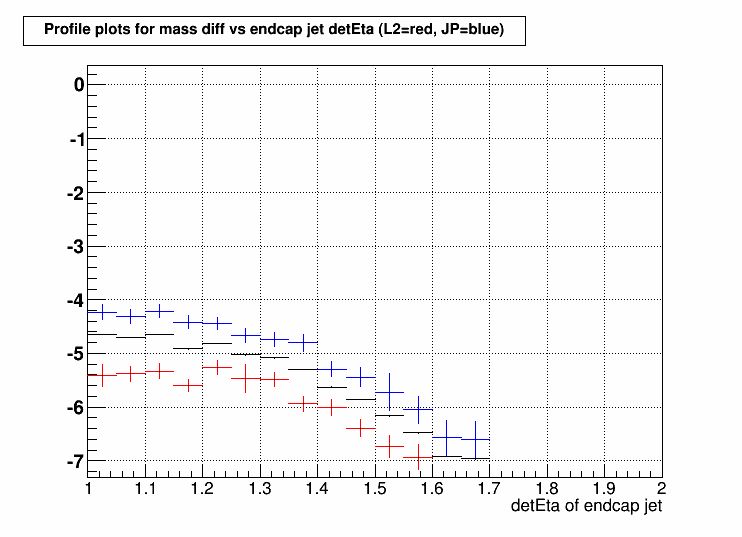
Figure 6. Profile plots for the two triggers broken into endcap jet detector eta. Red and pink are the L2 trigger, green and blue are the JP1 trigger. Pink and blue are from the more forward endcap jets.
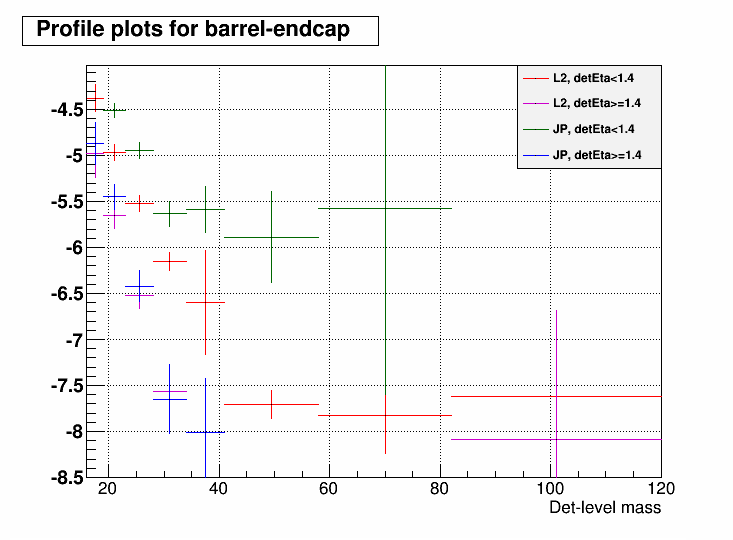
Figure 7. Det-par difference plotted against detector eta for the endcap jet.
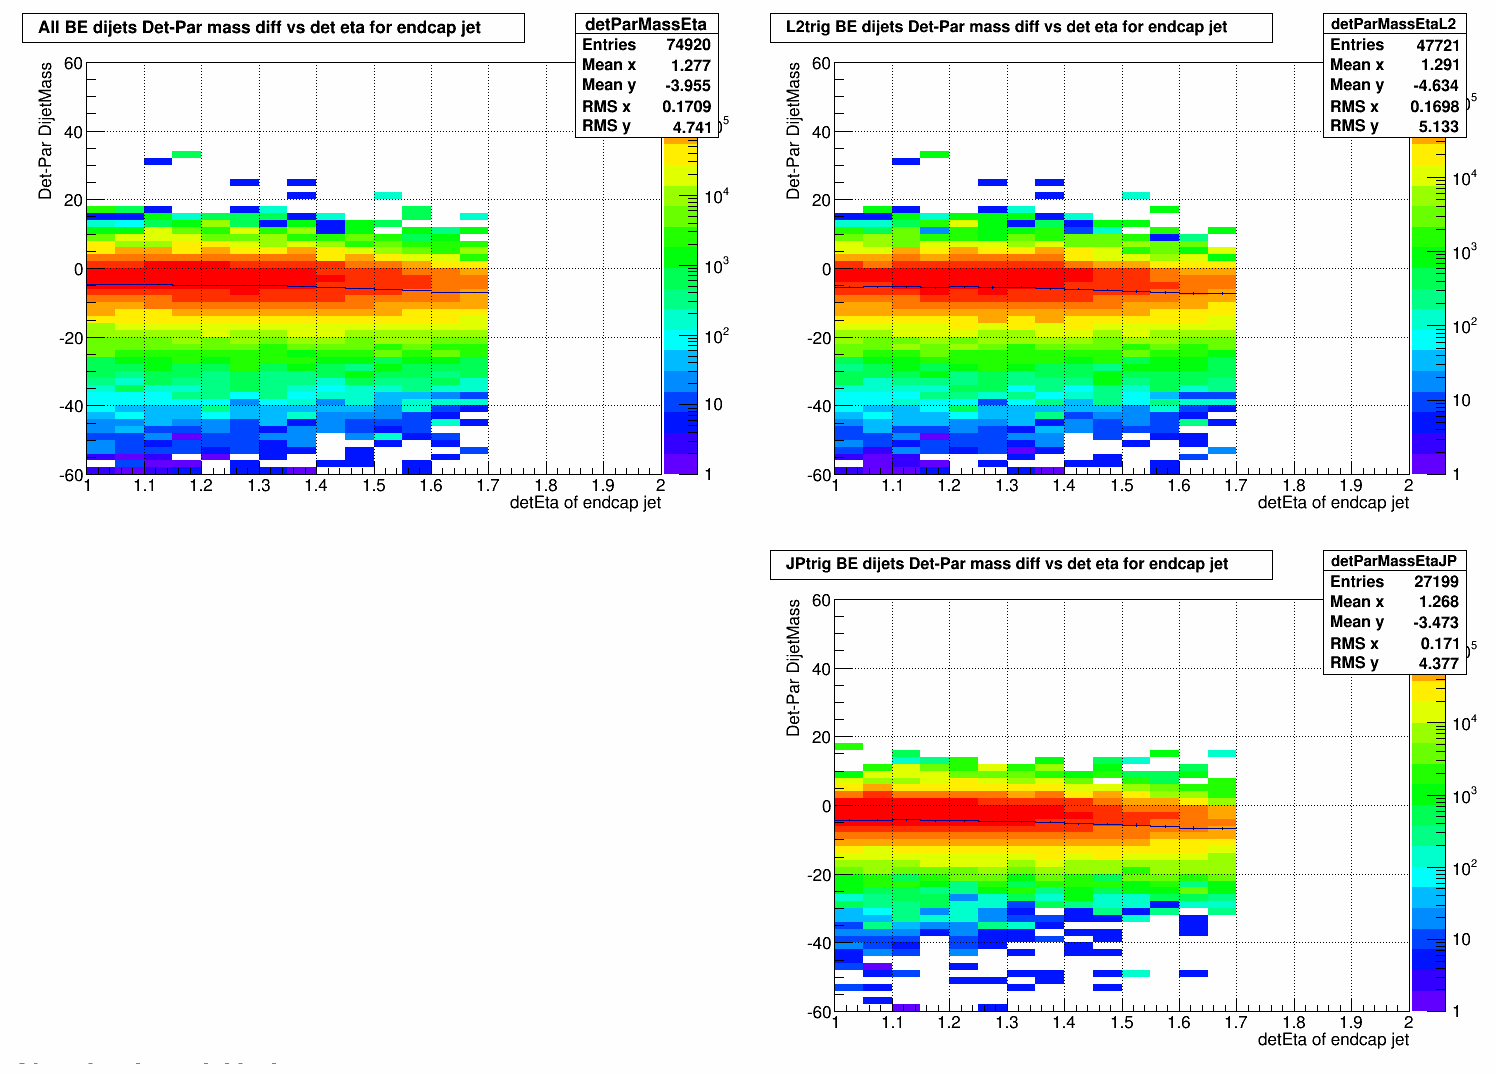
Figure 8. Profile plots from above plotted together.
- ezarndt's blog
- Login or register to post comments