Baryon CF paper at 3 GeV
Title: Measurements of Proton-Proton, Proton-Λ and Proton-Ξ- Correlation Functions in √s_NN= 3 GeV Au+Au Collisions at RHIC
Analysis note : https://drupal.star.bnl.gov/STAR/blog/fuchuan/pppLampXi-analysis-notes
Paper proposal : https://drupal.star.bnl.gov/STAR/system/files/BaryonCF_3GeV_paper_proposal_04_05.pdf
CVS codes on rcf:
Outline
- Abstract
- Motivation
- Figures
- Summary
- Supporting-materials
- Questions-in-PWGC-preview
Abstract
from two-particle correlation function measured in high-energy.
for p-p and p-Λ pairs (spin-averaged) are extracted in different collision centrality and rapidity bins.
Motivation
Figures
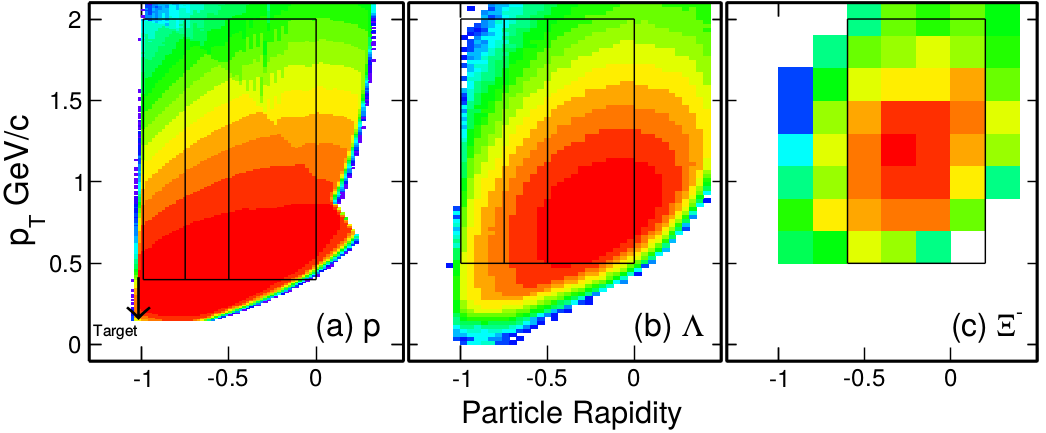
A momentum cut with p < 2 GeV/c is applied in proton selection by TPC. Correlation functions are measured within the pT-y regions shown by the box.
and p−Λ (middle panel) from 3 GeV Au+Au collisions. For p−Ξ- (right panel) correlation function, only 0-60% result is available
due to the limitation in statistics. Symbols, solid lines and dashed lines represent the results from experiment, fitting results of
Lednický-Lyuboshitz (LL) model and UrQMD model calculation, respectively. Vertical bar and band on data points represent statistical and
systematic uncertainty, respectively.
For p-p pairs, the resulting 3-σ contour-lines for 0-10% (dot-dashed line), 10-20% (short-dashed line), 20-40% (solid line) and
40-60% (dotted line) centrality bins and rapidity windows of [-0.5, 0] (blue), [-0.75, -0.5] (red) and [-1.0, -0.75] (gray) are shown
in the right and insert. For p−Λ pairs, due to limited statistics, only 1-σ contours from three centrality bins 0-10 % (dot-dashed line),
10-20% (short-dashed line), 20-60% (long dashed line) and two rapidity windows [-0.5, 0] (blue) and [-0.75, -0.5] (red) are shown.
Black stars and solid lines represent the results of combined fits: while the size parameters vary as a function of collision centrality and
different rapidity windows, only one set of the strong interaction parameter (f0, d0) is extracted for given sets of correlation functions.
Fig. 4: Left panel: Solid circles represent the final state strong interaction parameters (f0, d0) extracted from p-p and p−Λ correlation functions.
Open triangles represent the predictions from model calculations. Brown square denotes the value from low energy scattering experiment.
1-σ contours are shown for both p-p and p−Λ pairs.
Right panel: Mid-rapidity (-0.5 < y < 0) source size parameter, shown as a function of collision centrality, for p-p and p−Λ pairs
from = 3.0 GeV Au+Au collisions. Solid and open symbols represent the results extracted from the LL fitting to experimental data and the UrQMD
calculations, respectively. A Gaussian type single particle space distribution is assumed in the LL fit. All source-size parameters are extracted as the
RMS of pair space distribution in the pair rest frame. For data, both statistical and systematic uncertainties are included in the plot but not visible.
centrality and rapidity bins As expected, the source size parameters vary with centrality and rapidity, showing the characteristic expansion dynamics in such collisions.
On the other hand, both values of (f0, d0) do not show any visible centrality and rapidity dependence.
scattering experiment. For p-Λ pairs, the spin-averaged value of f0 is 2.34±0.1 fm. Because of the involvement of the strange quark, the scattering strength for p-Λ is much weaker
than that of p-p pairs. In case of p-Ξ- pairs, one could not determine the interaction parameters due to low statistics.
information on the properties of the baryon strong interaction which is crucial for understanding the inner structure of compact stars.
Supporting-materials
p-p:
https://drupal.star.bnl.gov/STAR/system/files/Proton_CF_PWG_2020_1217.pdf
https://drupal.star.bnl.gov/STAR/system/files/QPT2021_Chuan_v7.pdf
https://drupal.star.bnl.gov/STAR/system/files/Proton_CF_CollaborationMeeting_Chuan_0916_v2.pdf
https://drupal.star.bnl.gov/STAR/system/files/BaryonCF_3GeV_CollaborationMeeting_Chuan_20220913.pdf
https://drupal.star.bnl.gov/STAR/system/files/Proton_CF_CollaborationMeeting_Chuan_2023_10_17.pdf
https://drupal.star.bnl.gov/STAR/system/files/pXi_CorrelationFunction_qm22poster_v5.pdf
https://drupal.star.bnl.gov/STAR/system/files/LambdaProton_CF_QinZhi_20220714.pdf
https://drupal.star.bnl.gov/STAR/system/files/pLambda_CF_Zhi_PWG20230601.pdf
https://drupal.star.bnl.gov/STAR/system/files/ProtonLambdaCF_LLFit_AuAu3GeV_QinZhi_20230826.pdf
https://drupal.star.bnl.gov/STAR/system/files/PWG_pLambdaCF_3GeV_Update_QinZhi_20240111.pdf
p-Ξ-:
https://drupal.star.bnl.gov/STAR/system/files/yingjie_20220217_3GeV_pXi.pdf
https://drupal.star.bnl.gov/STAR/system/files/yingjie_20220317_3GeV_pXi_v1_0.pdf
https://drupal.star.bnl.gov/STAR/system/files/pXi_CorrelationFunction_qm22poster_v5.pdf
https://drupal.star.bnl.gov/STAR/system/files/yingjie_20231214_pXi_update_0.pdf
Questions-in-PWGC-preview
- fuchuan's blog
- Login or register to post comments