- genevb's home page
- Posts
- 2025
- 2024
- 2023
- 2022
- September (1)
- 2021
- 2020
- 2019
- 2018
- 2017
- December (1)
- October (3)
- September (1)
- August (1)
- July (2)
- June (2)
- April (2)
- March (2)
- February (1)
- 2016
- November (2)
- September (1)
- August (2)
- July (1)
- June (2)
- May (2)
- April (1)
- March (5)
- February (2)
- January (1)
- 2015
- December (1)
- October (1)
- September (2)
- June (1)
- May (2)
- April (2)
- March (3)
- February (1)
- January (3)
- 2014
- 2013
- 2012
- 2011
- January (3)
- 2010
- February (4)
- 2009
- 2008
- 2005
- October (1)
- My blog
- Post new blog entry
- All blogs
Run 10 scaler plots
Updated on Fri, 2010-02-26 13:16. Originally created by genevb on 2010-02-09 10:32.
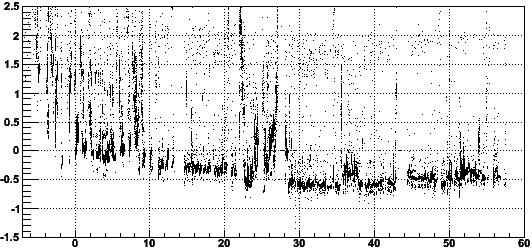
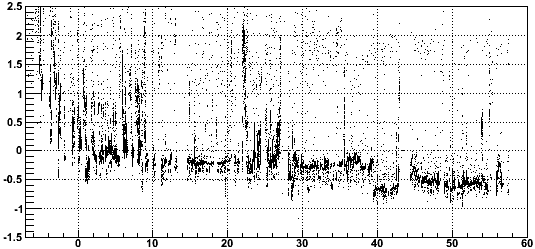
Here are plots of BBC backgrounds divided by ZDC coincidence rates vs. day using the You do not have access to view this node for Run 10:
sc.Draw("log10(bbcyb/zdcx):((t-5*3600)/(24*3600))-16>>hhy1(67,-7.,60.,40,-1.5,2.5)","zdcx>100")
sc.Draw("log10(bbcbb/zdcx):((t-5*3600)/(24*3600))-16>>hhb1(67,-7.,60.,40,-1.5,2.5)","zdcx>100")
log10(bbcyb/zdcx) vs. day:
log10(bbcbb/zdcx) vs day:
»
- genevb's blog
- Login or register to post comments