- genevb's home page
- Posts
- 2025
- 2024
- 2023
- 2022
- September (1)
- 2021
- 2020
- 2019
- December (1)
- October (4)
- September (2)
- August (6)
- July (1)
- June (2)
- May (4)
- April (2)
- March (3)
- February (3)
- 2018
- 2017
- December (1)
- October (3)
- September (1)
- August (1)
- July (2)
- June (2)
- April (2)
- March (2)
- February (1)
- 2016
- November (2)
- September (1)
- August (2)
- July (1)
- June (2)
- May (2)
- April (1)
- March (5)
- February (2)
- January (1)
- 2015
- December (1)
- October (1)
- September (2)
- June (1)
- May (2)
- April (2)
- March (3)
- February (1)
- January (3)
- 2014
- December (2)
- October (2)
- September (2)
- August (3)
- July (2)
- June (2)
- May (2)
- April (9)
- March (2)
- February (2)
- January (1)
- 2013
- December (5)
- October (3)
- September (3)
- August (1)
- July (1)
- May (4)
- April (4)
- March (7)
- February (1)
- January (2)
- 2012
- December (2)
- November (6)
- October (2)
- September (3)
- August (7)
- July (2)
- June (1)
- May (3)
- April (1)
- March (2)
- February (1)
- 2011
- November (1)
- October (1)
- September (4)
- August (2)
- July (4)
- June (3)
- May (4)
- April (9)
- March (5)
- February (6)
- January (3)
- 2010
- December (3)
- November (6)
- October (3)
- September (1)
- August (5)
- July (1)
- June (4)
- May (1)
- April (2)
- March (2)
- February (4)
- January (2)
- 2009
- November (1)
- October (2)
- September (6)
- August (4)
- July (4)
- June (3)
- May (5)
- April (5)
- March (3)
- February (1)
- 2008
- 2005
- October (1)
- My blog
- Post new blog entry
- All blogs
An SL09g vs. SL10j comparison
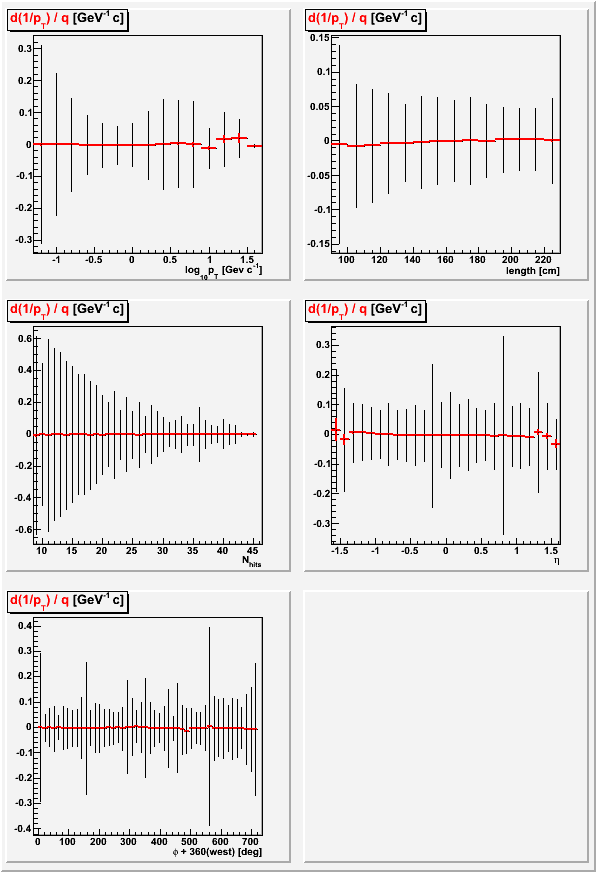
Using code slightly modified from a recent study I did to see differences between two datasets, I generated plots of Δ(1/pT) / q {which is approximately equal to -Δ(pT) / (q*pT2) for small changes}, I generated plots using ~1000 events (and ~725k matched global tracks with flag>0) from a single st_W file from Run 9 (st_W_10103041_raw_4180001). Keep in mind that for this data, the global tracks are dominated by pile-up. Here are the plots (red shows [sometimes difficult to see] errors on the mean, and black shows distribution RMS):
Δ(1/pT) / q:
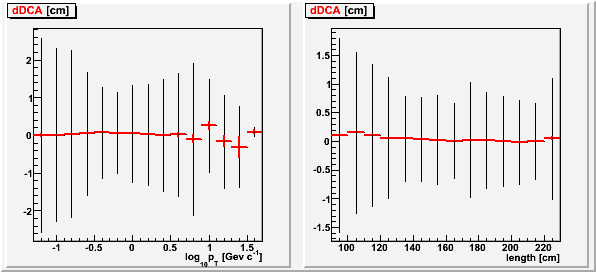
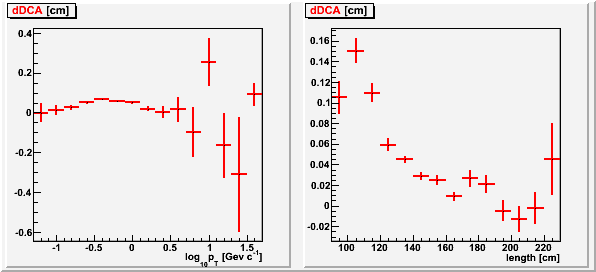
Δ(DCA):
Since this is SL10j minus SL09g, it means that where 1/pT/q decreased (such as for short length tracks), pT/q increased. There are some fluctuations at high pT and high η, but the statistics get a little weak out there too. Removing the black RMS indicators allows us to zoom in and see the systematics a little more clearly:
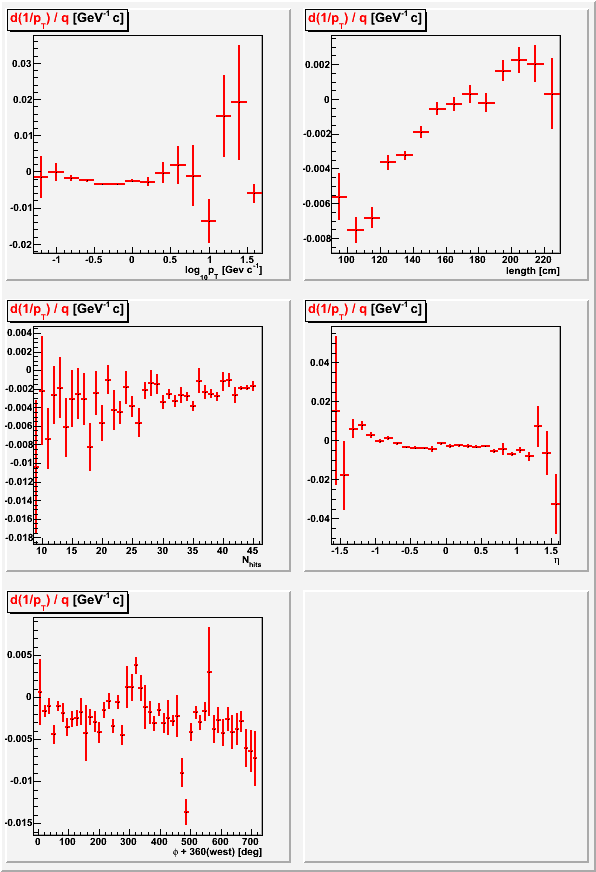
Interestingly, the track length dependencies are quite strong. And the Nhits dependence plot is uniform enough that it can been that there is an overall systematic change in the momenta, which may be attributable to a modified SpaceCharge & GridLeak calibration between the two datasets (and so isn't necessarily a degradation).
-Gene
Groups:
- genevb's blog
- Login or register to post comments