- genevb's home page
- Posts
- 2025
- 2024
- 2023
- 2022
- September (1)
- 2021
- 2020
- 2019
- December (1)
- October (4)
- September (2)
- August (6)
- July (1)
- June (2)
- May (4)
- April (2)
- March (3)
- February (3)
- 2018
- 2017
- December (1)
- October (3)
- September (1)
- August (1)
- July (2)
- June (2)
- April (2)
- March (2)
- February (1)
- 2016
- November (2)
- September (1)
- August (2)
- July (1)
- June (2)
- May (2)
- April (1)
- March (5)
- February (2)
- January (1)
- 2015
- December (1)
- October (1)
- September (2)
- June (1)
- May (2)
- April (2)
- March (3)
- February (1)
- January (3)
- 2014
- December (2)
- October (2)
- September (2)
- August (3)
- July (2)
- June (2)
- May (2)
- April (9)
- March (2)
- February (2)
- January (1)
- 2013
- December (5)
- October (3)
- September (3)
- August (1)
- July (1)
- May (4)
- April (4)
- March (7)
- February (1)
- January (2)
- 2012
- December (2)
- November (6)
- October (2)
- September (3)
- August (7)
- July (2)
- June (1)
- May (3)
- April (1)
- March (2)
- February (1)
- 2011
- November (1)
- October (1)
- September (4)
- August (2)
- July (4)
- June (3)
- May (4)
- April (9)
- March (5)
- February (6)
- January (3)
- 2010
- December (3)
- November (6)
- October (3)
- September (1)
- August (5)
- July (1)
- June (4)
- May (1)
- April (2)
- March (2)
- February (4)
- January (2)
- 2009
- November (1)
- October (2)
- September (6)
- August (4)
- July (4)
- June (3)
- May (5)
- April (5)
- March (3)
- February (1)
- 2008
- 2005
- October (1)
- My blog
- Post new blog entry
- All blogs
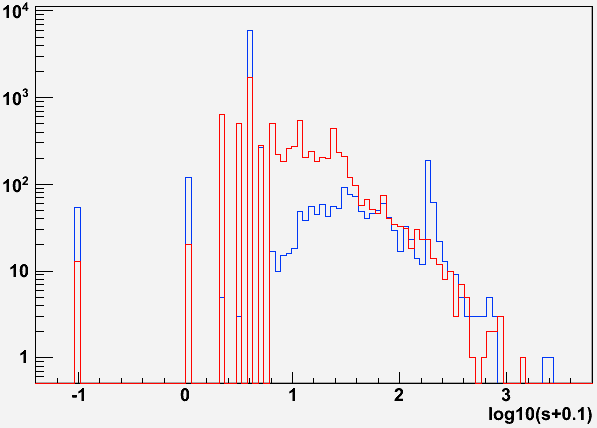
Run start/end vs. first/last event
Informational only...
Run 11 (as of 2011-06-07)
Blue: firstEventTime - startRunTime
Red: endRunTime - lastEventTime
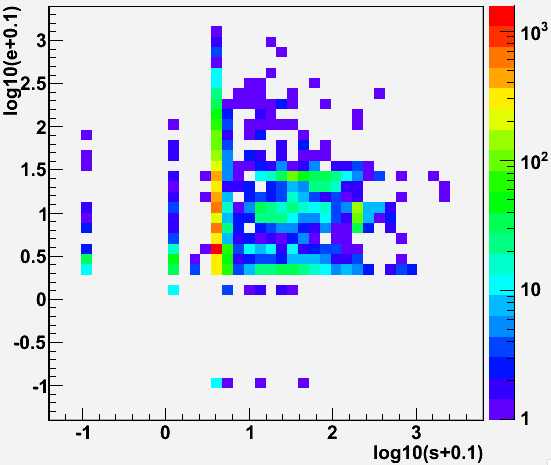
Plots are of log10(difference + 0.1), so no difference => -1, while 1 second => ~0, etc. 2D plot has (first-start) on horizontal axis, (end-last) on vertical.
(first-start) vs. day, and (end-last) vs. day:
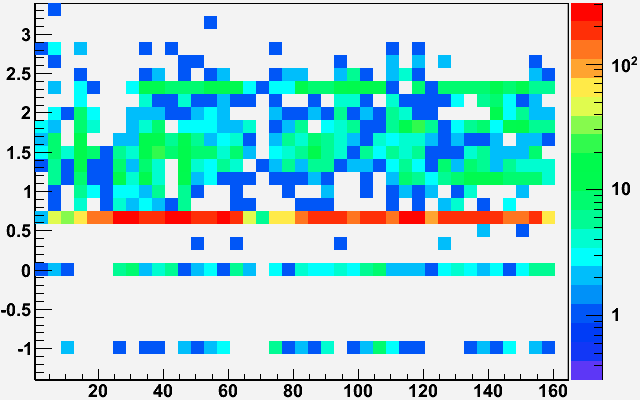
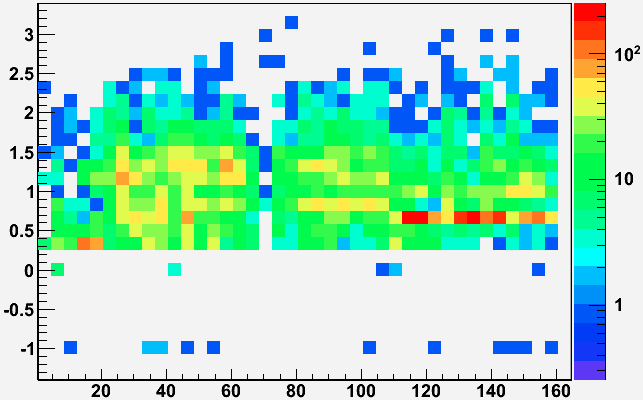
Differences can be as much as a few 103 seconds (just over half an hour). Correlations do not look strong between the two differences (structures along each axis appear to generally propagate across other axis).
Major peaks in (first-start) of 4 seconds, and ~200 seconds (log10 ~= 2.3) may be two classes of common run start-up modes, persistent over the whole of Run 11?
Peak at (end-last) of 4 seconds appears only during AuAu operations.
Direct Online DB Query moved to the protected page, because it is not intended for common usage (Dmitry)
database query for event timestamp difference calculation
-Gene
Groups:
- genevb's blog
- Login or register to post comments