- genevb's home page
- Posts
- 2025
- 2024
- 2023
- 2022
- September (1)
- 2021
- 2020
- 2019
- December (1)
- October (4)
- September (2)
- August (6)
- July (1)
- June (2)
- May (4)
- April (2)
- March (3)
- February (3)
- 2018
- 2017
- December (1)
- October (3)
- September (1)
- August (1)
- July (2)
- June (2)
- April (2)
- March (2)
- February (1)
- 2016
- November (2)
- September (1)
- August (2)
- July (1)
- June (2)
- May (2)
- April (1)
- March (5)
- February (2)
- January (1)
- 2015
- December (1)
- October (1)
- September (2)
- June (1)
- May (2)
- April (2)
- March (3)
- February (1)
- January (3)
- 2014
- December (2)
- October (2)
- September (2)
- August (3)
- July (2)
- June (2)
- May (2)
- April (9)
- March (2)
- February (2)
- January (1)
- 2013
- December (5)
- October (3)
- September (3)
- August (1)
- July (1)
- May (4)
- April (4)
- March (7)
- February (1)
- January (2)
- 2012
- December (2)
- November (6)
- October (2)
- September (3)
- August (7)
- July (2)
- June (1)
- May (3)
- April (1)
- March (2)
- February (1)
- 2011
- November (1)
- October (1)
- September (4)
- August (2)
- July (4)
- June (3)
- May (4)
- April (9)
- March (5)
- February (6)
- January (3)
- 2010
- December (3)
- November (6)
- October (3)
- September (1)
- August (5)
- July (1)
- June (4)
- May (1)
- April (2)
- March (2)
- February (4)
- January (2)
- 2009
- November (1)
- October (2)
- September (6)
- August (4)
- July (4)
- June (3)
- May (5)
- April (5)
- March (3)
- February (1)
- 2008
- 2005
- October (1)
- My blog
- Post new blog entry
- All blogs
Some quick looks at the Run 13 RICH scalers so far
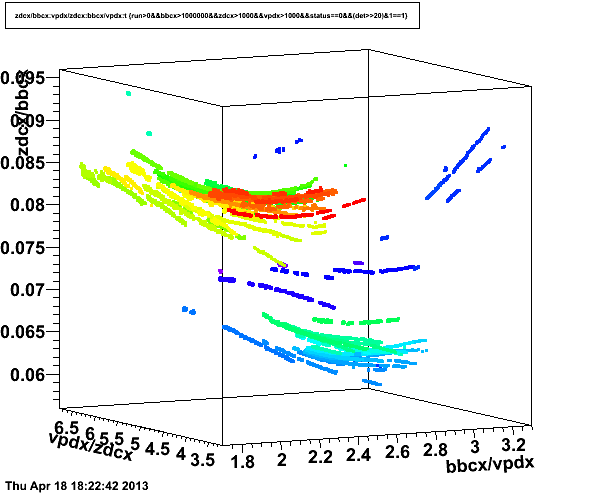
One of the ways to look for changes in RHIC and/or STAR operations that affect our ability to use RICH scalers unifornmly across the data for luminosity dependent corrections (e.g. TPC SpaceCharge & GridLeak) is to look at the ratios between the scalers. When RHIC operations change, all scalers probably change. When STAR operations change, it is probably a single measure which has changed, so only ratios involving that measure change. Here is what I see using the ratios plotted against each other.
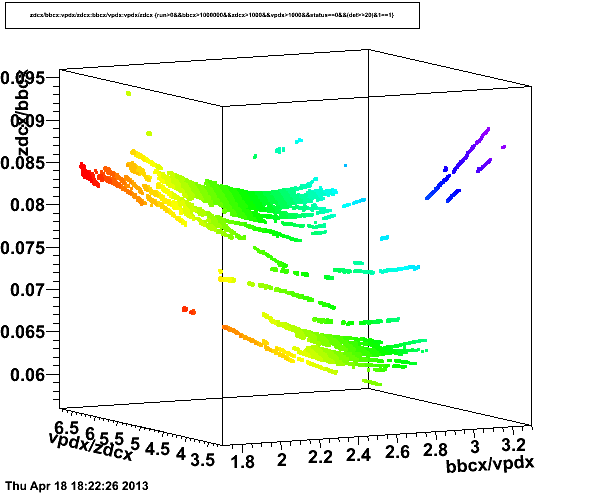
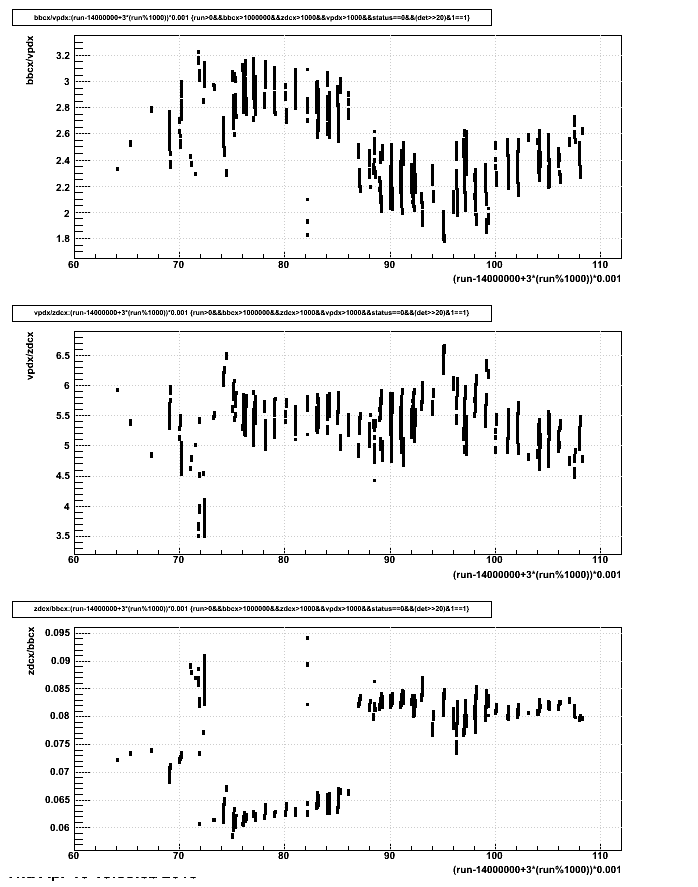
First plot uses time for the color (blue is around day 64, red is day 108). The second plot uses vpdx/zdcx (depth axis) for the color. Individual fills are clearly identifiable as strings of points within these 3D plots. These plots show that, ignoring very early days of running, there are two major groups of data, which differ mainly by the ratios which involve BBC, while the ratio of vpdx/zdcx stays in the same [red,cyan] range. The triple of plots that follows these first two plots show the three ratios vs. day number, and demonstrate that the transition between these two major groupings occurs approximately between days 86 and 87.
-Gene
p.s. I have placed cuts on using only scalers recorded during good TPC runs, excluding very low luminosities.
Groups:
- genevb's blog
- Login or register to post comments