Changes at STAR near 2013-05-09 (day 129)
This study is motivated by the ongoing Run 13 BeamLine calibration, for which an upward shift is currently seen in the BeamLine's vertical position by nearly 1mm around day 129 (±1 day, perhaps). The PXL detector was inserted on 2013-05-08 (day 128), but the first physics runs were not record until day 129.
Some additional change in TPC behavior was seen in the field cage currents around the same time.
Note: most plots on this page are reduced for presentation within the page; opening the images in a new browser tab/window will allow full resolution.
_______________________
RICH Scalers
Looking for things that may have occurred around day 129, here are zdcx and bbcx (as well as half-daily profile means in green and black respectively) vs. day number showing that there is no easily-seen change in these around day 129:
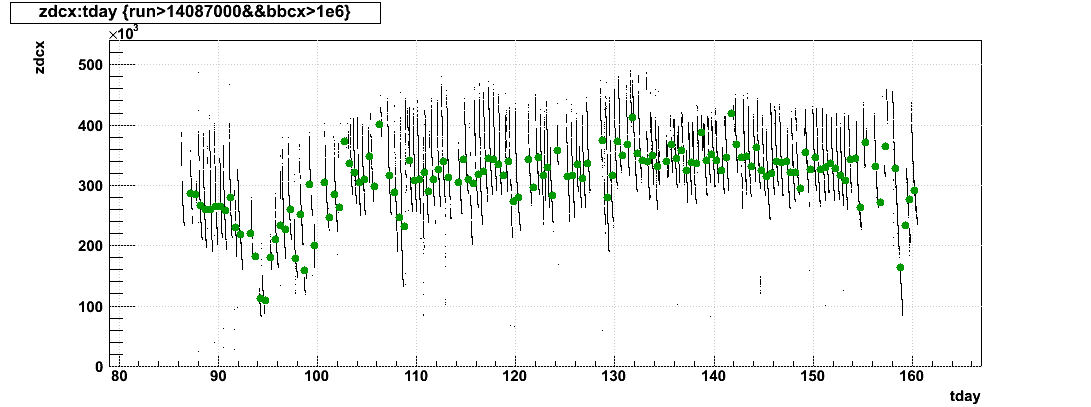
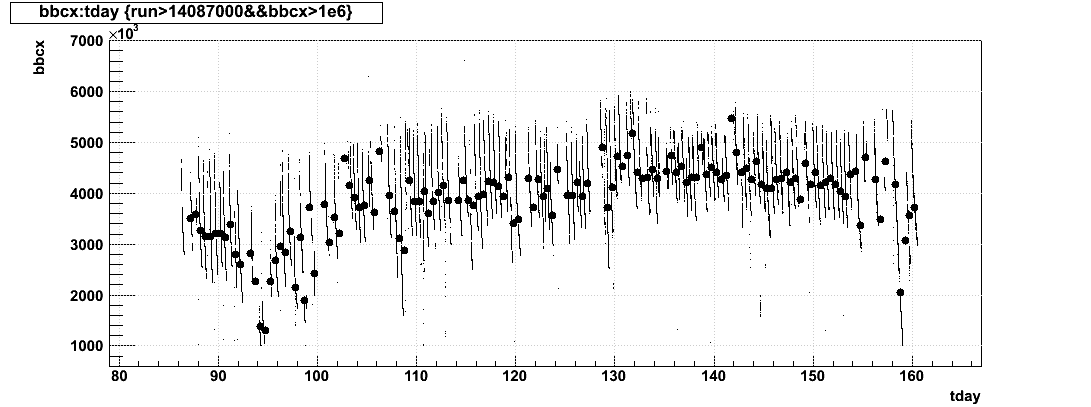
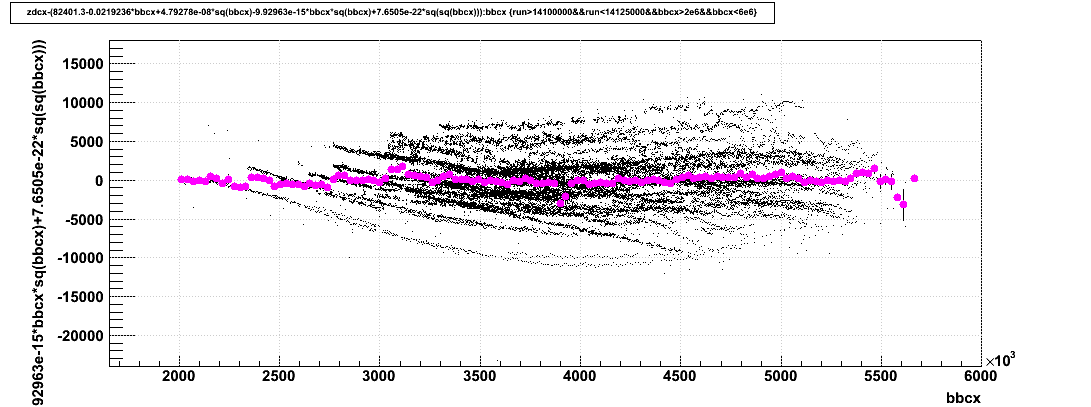
To at least cancel out the effects of the varying (and falling) collision rates to some degree, I decided to use these scalers against each other for changes in relative behavior. I fit zdcx as a function of bbcx for days 100-125, 2e6 < bbcx < 6e6 with a 4th order polynomial and got:
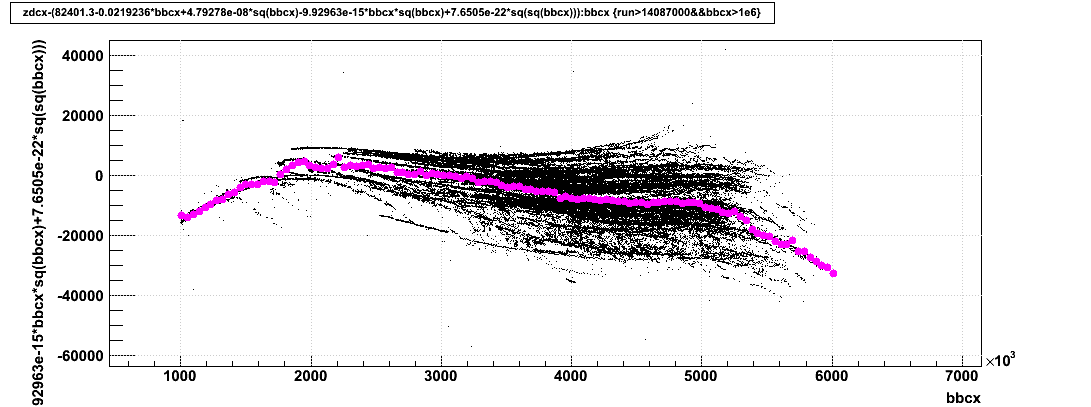
zdcx'(bbcx) = 82401.3-0.0219236*bbcx+4.79278e-08*bbcx2-9.92963e-15*bbcx3+7.6505e-22*bbcx4
Here is the difference between the zdcx data and the fit (zdcx - zdcx') vs. bbcx (profile in magenta), using only the fit data in the first plot, and then using all runs starting on day 87 in the second plot. Individual fills of the collider are apparent as narrow bands, and show some variation of a few kHz in this metric within the course of a fill (the fit does not truly describe any single fill). But fill-to-fill variations are larger, opening up to the 10s of kHz in the larger dataset.
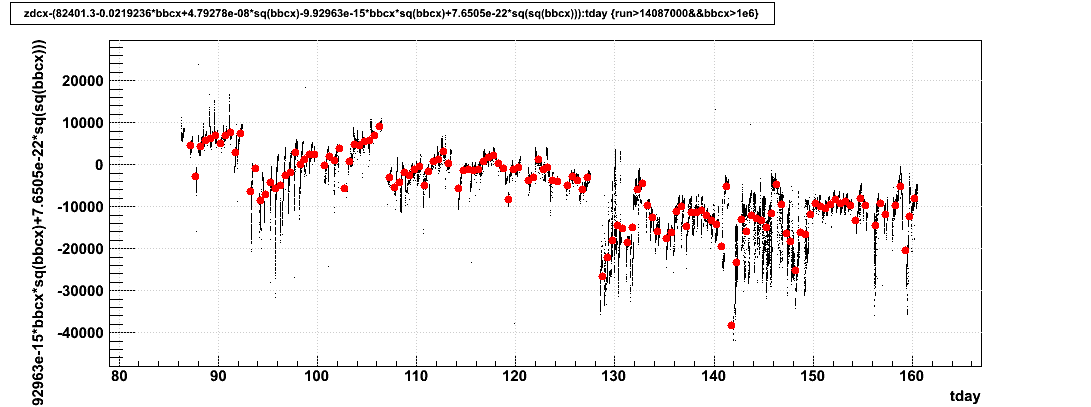
I then looked at the difference (zdcx - zdcx') and ratio (zdcx / zdcx') as a function of day number (with profile means in red and blue respectively, binned in half days):
Difference:
Ratio:
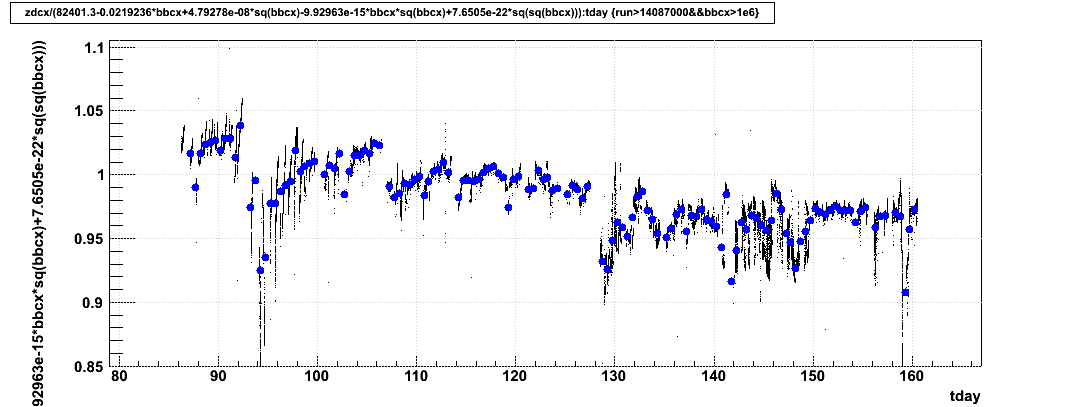
Both of the above plots show what appears to be perhaps 4 distinct periods of operation, with changes happening on days 93 (2013-04-03), 107 (2013-04-17), and day 128 (2013-05-08). Data from days 107-127 show the least deviations (within a few kHz, or 1%), indicative of the fact that they dominated the fit. On other days, the systematic shifts away from 0 (by 10s of kHz; or from 1, by a few %) and larger fluctuations (on the scale of 10s of kHz, or a few %) within the data indicate that the fit does not apply as well there; these deviations are larger than the within-fill deviations one might expect from simply having different mean luminosity from one fill to the next. Whatever happened around day 128 shifted the zdcx-to-bbcx relationship on the order of ~4%.
-Gene
Some additional change in TPC behavior was seen in the field cage currents around the same time.
Note: most plots on this page are reduced for presentation within the page; opening the images in a new browser tab/window will allow full resolution.
_______________________
RICH Scalers
Looking for things that may have occurred around day 129, here are zdcx and bbcx (as well as half-daily profile means in green and black respectively) vs. day number showing that there is no easily-seen change in these around day 129:
To at least cancel out the effects of the varying (and falling) collision rates to some degree, I decided to use these scalers against each other for changes in relative behavior. I fit zdcx as a function of bbcx for days 100-125, 2e6 < bbcx < 6e6 with a 4th order polynomial and got:
zdcx'(bbcx) = 82401.3-0.0219236*bbcx+4.79278e-08*bbcx2-9.92963e-15*bbcx3+7.6505e-22*bbcx4
Here is the difference between the zdcx data and the fit (zdcx - zdcx') vs. bbcx (profile in magenta), using only the fit data in the first plot, and then using all runs starting on day 87 in the second plot. Individual fills of the collider are apparent as narrow bands, and show some variation of a few kHz in this metric within the course of a fill (the fit does not truly describe any single fill). But fill-to-fill variations are larger, opening up to the 10s of kHz in the larger dataset.
I then looked at the difference (zdcx - zdcx') and ratio (zdcx / zdcx') as a function of day number (with profile means in red and blue respectively, binned in half days):
Difference:
Ratio:
Both of the above plots show what appears to be perhaps 4 distinct periods of operation, with changes happening on days 93 (2013-04-03), 107 (2013-04-17), and day 128 (2013-05-08). Data from days 107-127 show the least deviations (within a few kHz, or 1%), indicative of the fact that they dominated the fit. On other days, the systematic shifts away from 0 (by 10s of kHz; or from 1, by a few %) and larger fluctuations (on the scale of 10s of kHz, or a few %) within the data indicate that the fit does not apply as well there; these deviations are larger than the within-fill deviations one might expect from simply having different mean luminosity from one fill to the next. Whatever happened around day 128 shifted the zdcx-to-bbcx relationship on the order of ~4%.
-Gene
Groups:
- genevb's blog
- Login or register to post comments