- genevb's home page
- Posts
- 2025
- 2024
- 2023
- 2022
- September (1)
- 2021
- 2020
- 2019
- December (1)
- October (4)
- September (2)
- August (6)
- July (1)
- June (2)
- May (4)
- April (2)
- March (3)
- February (3)
- 2018
- 2017
- December (1)
- October (3)
- September (1)
- August (1)
- July (2)
- June (2)
- April (2)
- March (2)
- February (1)
- 2016
- November (2)
- September (1)
- August (2)
- July (1)
- June (2)
- May (2)
- April (1)
- March (5)
- February (2)
- January (1)
- 2015
- December (1)
- October (1)
- September (2)
- June (1)
- May (2)
- April (2)
- March (3)
- February (1)
- January (3)
- 2014
- December (2)
- October (2)
- September (2)
- August (3)
- July (2)
- June (2)
- May (2)
- April (9)
- March (2)
- February (2)
- January (1)
- 2013
- December (5)
- October (3)
- September (3)
- August (1)
- July (1)
- May (4)
- April (4)
- March (7)
- February (1)
- January (2)
- 2012
- December (2)
- November (6)
- October (2)
- September (3)
- August (7)
- July (2)
- June (1)
- May (3)
- April (1)
- March (2)
- February (1)
- 2011
- November (1)
- October (1)
- September (4)
- August (2)
- July (4)
- June (3)
- May (4)
- April (9)
- March (5)
- February (6)
- January (3)
- 2010
- December (3)
- November (6)
- October (3)
- September (1)
- August (5)
- July (1)
- June (4)
- May (1)
- April (2)
- March (2)
- February (4)
- January (2)
- 2009
- November (1)
- October (2)
- September (6)
- August (4)
- July (4)
- June (3)
- May (5)
- April (5)
- March (3)
- February (1)
- 2008
- 2005
- October (1)
- My blog
- Post new blog entry
- All blogs
The 6.6 second anomaly
Updated on Tue, 2019-06-04 14:57. Originally created by genevb on 2019-05-31 17:09.
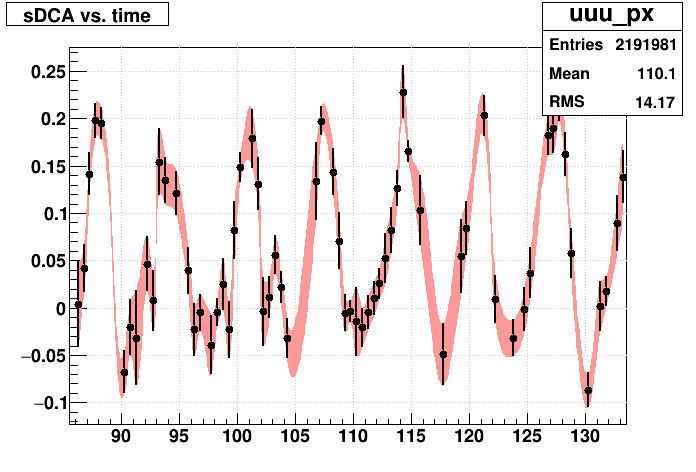
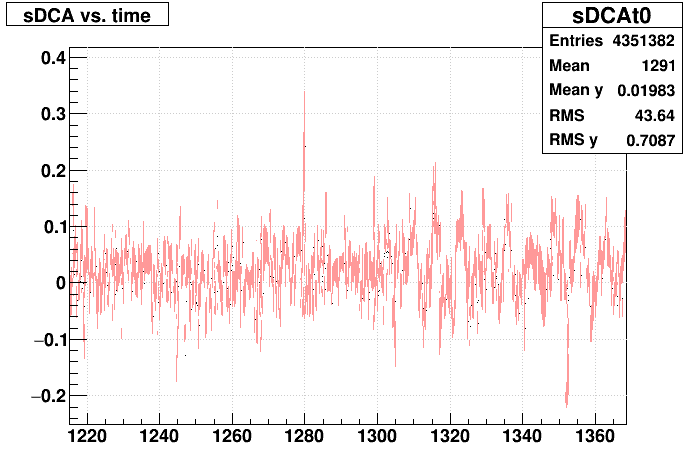
While looking for anomalous abort gap cleaning events in Run 18 AuAu27 data, I found something different in a few of the runs. It was most obvious to me in run 19134041, so I will focus on that run here. These first set of plots are profiles of signed DCAs [cm] vs. time [sec] in a single st_mtd file from this run produced for the large calibration production, which means that the Abort Gap Cleaning distortion correction is already applied. This signed DCA is calculated from the global partners of all primary tracks in the MuDsts. The plots going from left to right zoom in on the time axis, with the third (right) plot adding an "e6" plotting option that makes a filled curve through the error bands to show the flow of the data points more clearly.
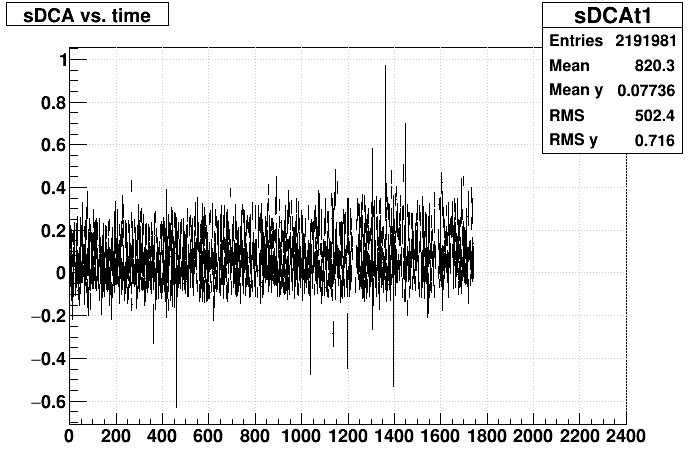
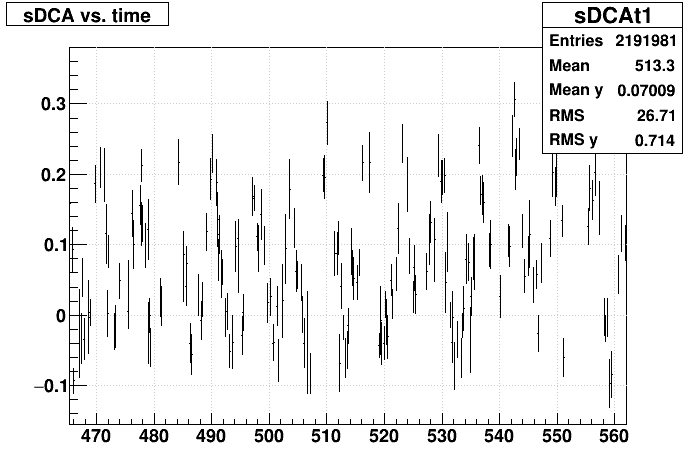
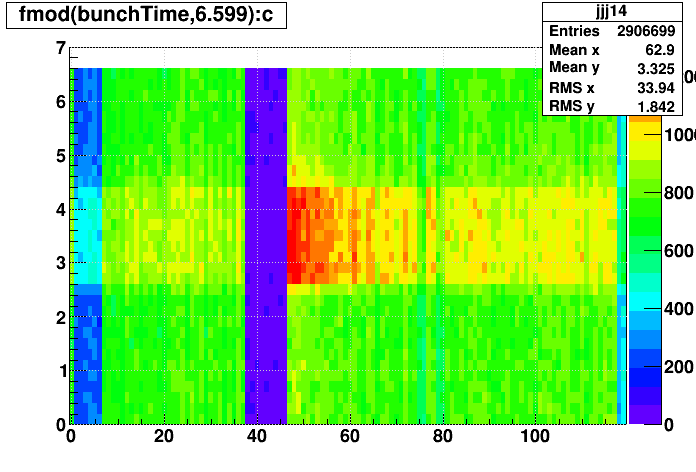
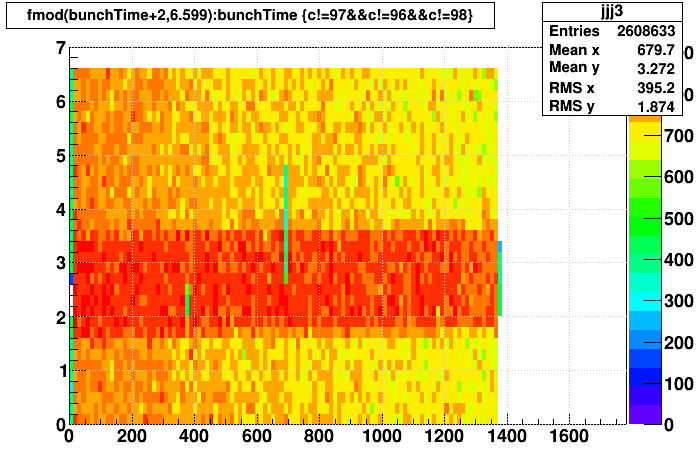
There is a feature in the signed DCAs with a periodicity between 6 and 7 seconds. Using the DAQ event size data and a technique I employed when first studying the Abort Gap Cleaning, I was able to see something that was of the appropriate time periodicity. The idea is to see periodicity by plotting the time of events (with high resolution using the bunch crossing counter divided by the RHIC clock frequency) modulo some expectation of the periodicity, versus the time in the run (no modulo). When the expectation of periodicity is incorrect, periodic features show up as diagonal stripes. When correct, the feature becomes a straight horizontal stripe.
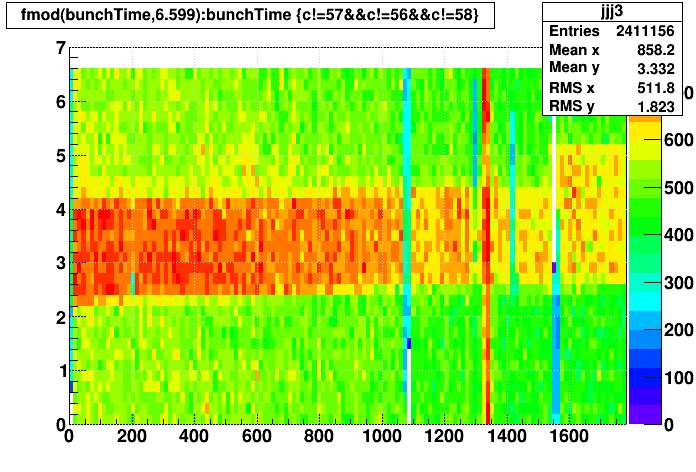
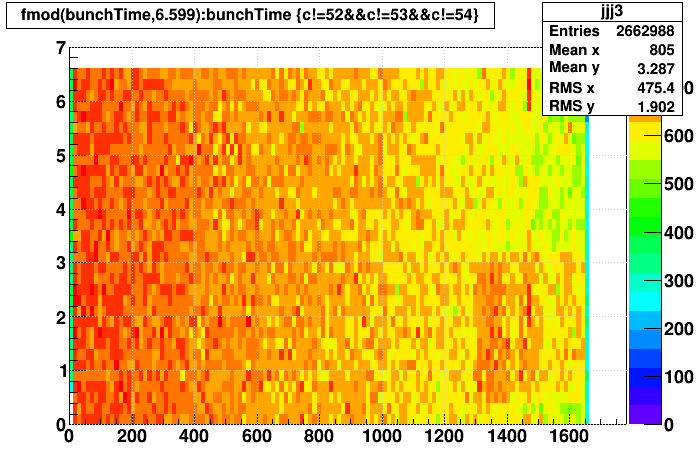
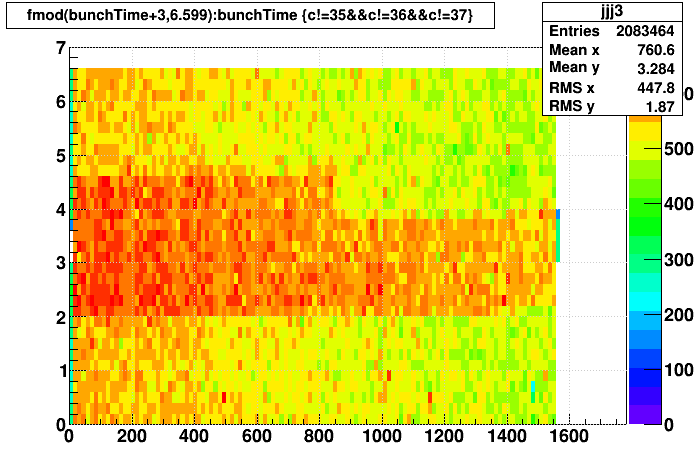
Here are three plots from the DAQ data using this technique (abscissa and ordinate units are [sec]), where the periodicity was found to be 6.599 seconds (one can actually see a slight tilt when using 6.600 seconds, but I will nevertheless refer to this as the "6.6 second anomaly" for now), of (left) the sum of all event sizes, (middle) the count of events, and (right) the average (sum/counts) event sizes:
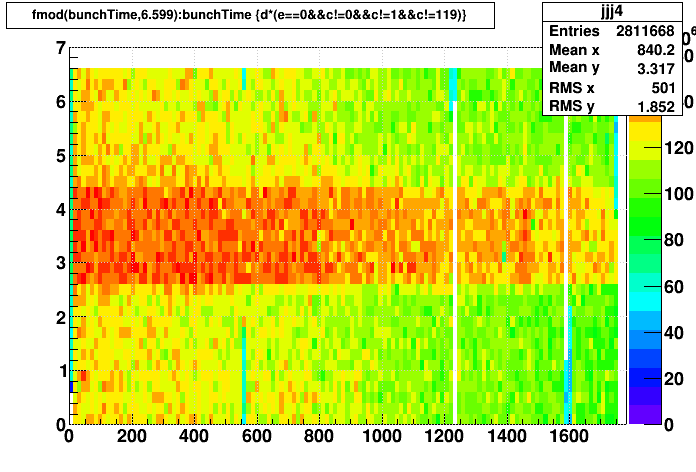
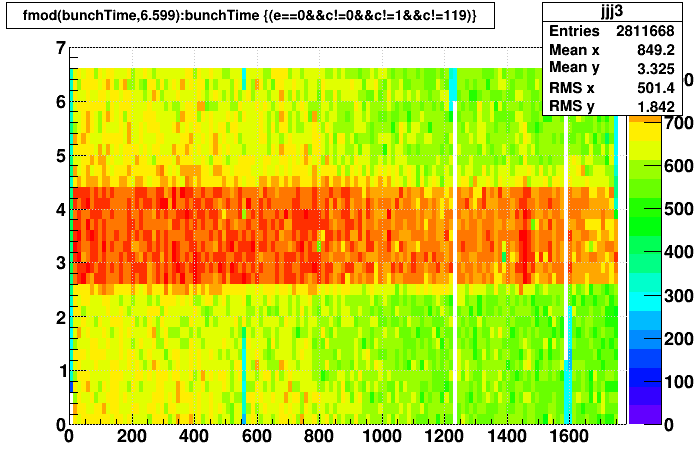
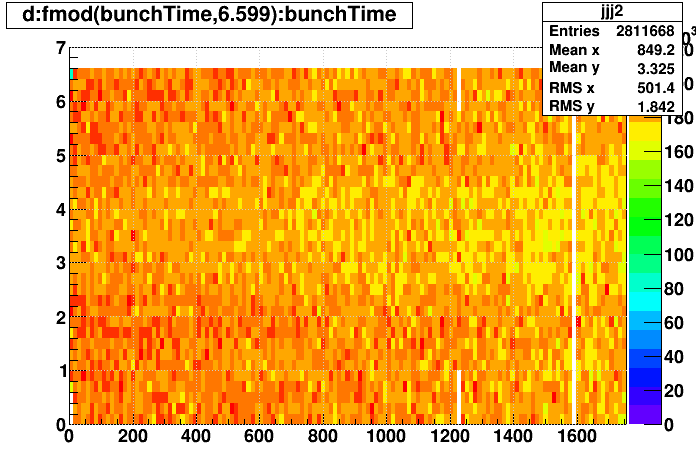
The feature appears to be "on" for a duration of ~1.8 seconds out of each 6.599 second period. It leads to smaller-than-usual events, but they are triggered (acquired) more often, leading to an increase in total data being acquired during the feature.
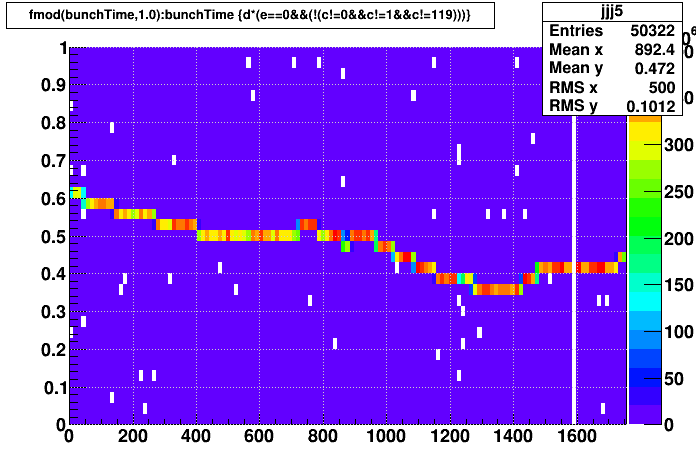
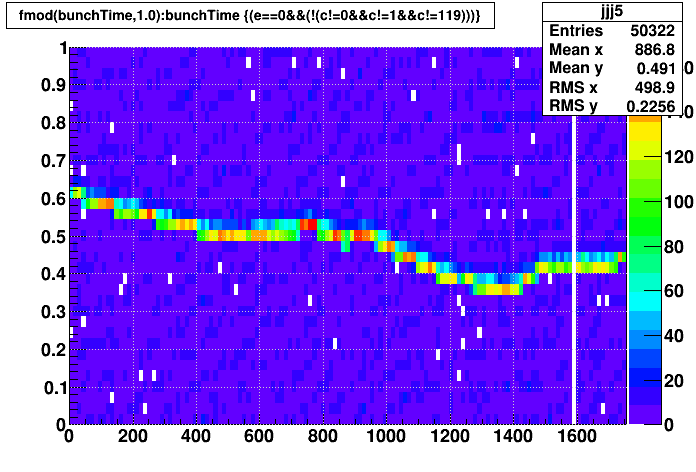
As an aside, to see the above feature, I made a cut to exclude the DAQ metadata that corresponded with the Abort Gap Cleaning, and also excluded "adc" events. For comparison, here are the same three plots where I specifically cut to focus on the Abort Gap Cleaning. One can see that a periodicity of 1 second is not quite correct, particularly because the periodicity does not hold constant! One can also see that the Abort Gap Cleaning events' average size is much larger than other events, unlike the new 6.6 second anomaly.
I discussed this feature with Jamie D. and Jeff L., and our conclusion is that we are triggering on a lot of low-multiplicity backgrounds (undesired collisions of beam with something) that are excessive during the "on" time of the feature.
But...what is it? The periodicity matches that of injection runs seen in Run 19, but we did not acquire data during RHIC injection for Run 18. I turned to Angelika D. from C-AD, who suspects it is the cycling of the Booster Main Magnet (BMM), which was on during this run. She also noticed that the STAR ZDC west singles rate appeared to have an increase in variance during periods when the Booster Main Magnet was on around that time. This seems quite surprising, given that the Booster operation is considered to be independent of RHIC after RHIC injection, and implies some kind of electrical linkage to something (magnets?) at RHIC. I hope to pursue this understanding more when I find out more details from Angelika. For now, I did learn from an internet search that the BMM used to operate with a 1 second flattop at a periodicity of 4 seconds (anyone who used to do experiments at the AGS will recognize these numbers and may remember the associated whooping sound!); and my suspicion is that these numbers changed in recent years, perhaps for RHIC BES purposes, or something else like NSRL experiments.
Anyhow, I looked at some other observables to see what else I could learn...
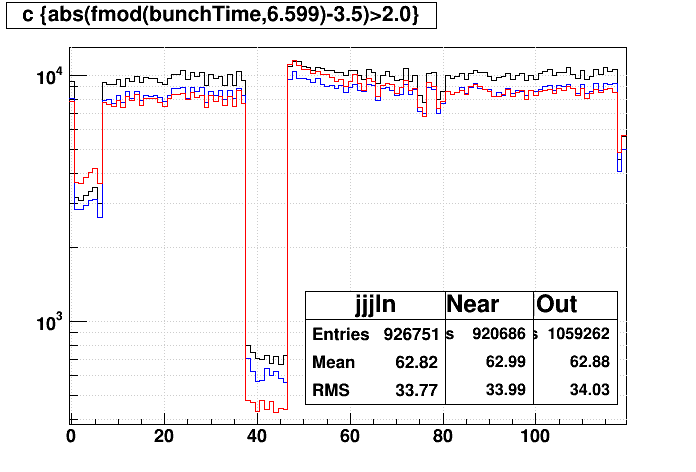
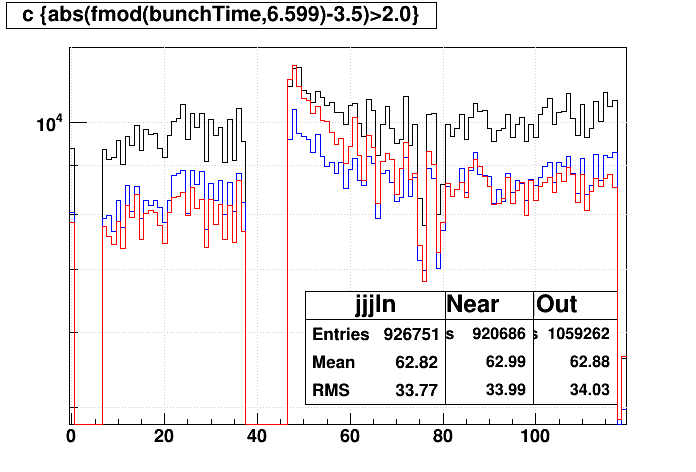
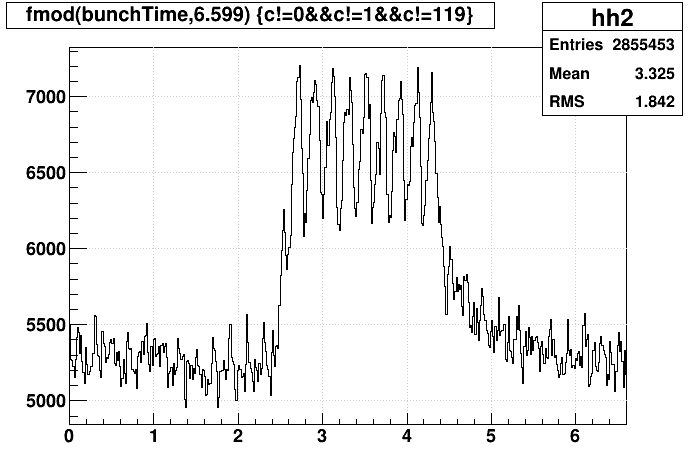
Do the 6.6 second anomaly events come at a specific bunch crossing index, just like the Abort Gap Cleaning does? Here are some plots vs. bunch crossing index that do appear to demonstrate an increase in events at bunch crossings just after one of the beams' abort gaps, though I'm not sure which beam it is (the abort gaps clearly weren't aligned at STAR during this run). The right two plots are essentially horizontal slices of the left plot along times which are clearly inside (red), outside but near (blue), and clearly outside (black) the feature (the right plot zooms in on the vertical axis). The red data appears to rise a bit more above the rest of its histogram in the bins (bunch crossing indices) roughly around 48-60. It would take more statistics to make this more convincing. Also of note, I did not exclude the Abort Gap Cleaning events from these particular plots, and they show up at bunch crossing index 0±1 (-1 is actually 119) for this run.
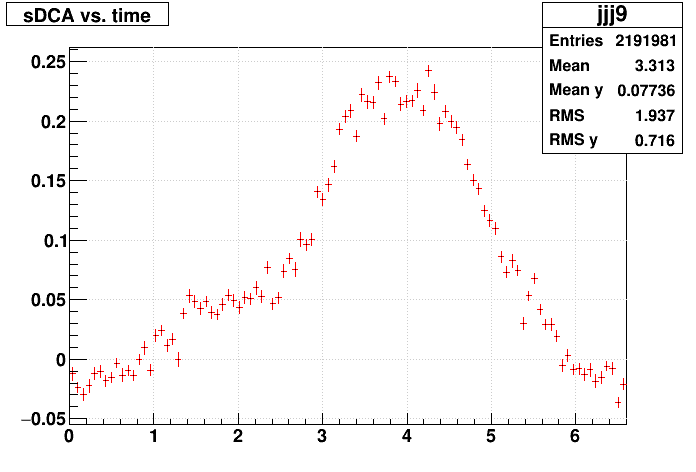
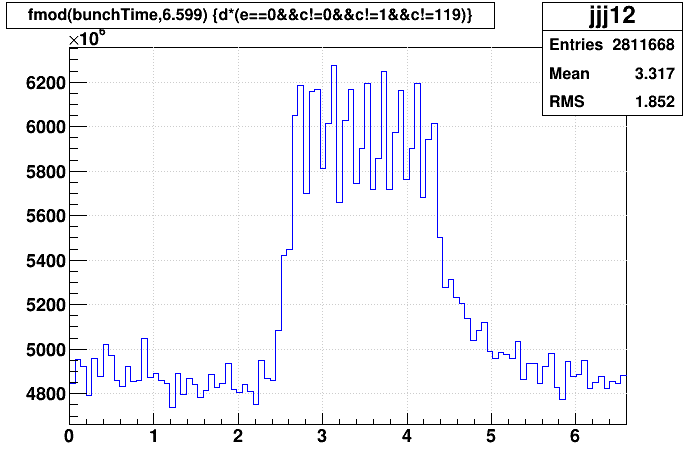
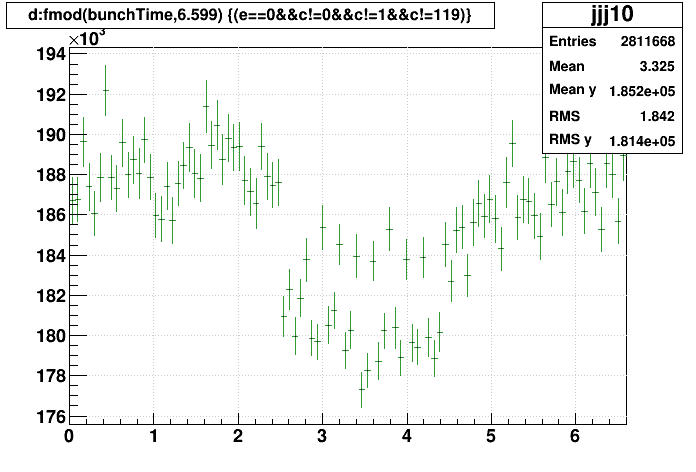
How do the signed DCAs look when plotted versus time modulo the 6.599 second period, and do the features in signed DCA line up in time with the feature in the DAQ data? Here's signed DCA on top, then the DAQ data of event size sum, event counts, and event size average vs. the periodic time. The signed DCA rises by about 0.25 cm starting around 2.5 seconds, coinciding with the DAQ data feature turning "on", and begins to fall again at at around 4.3 seconds when the DAQ feature turns "off": this is a nearly perfect match! I will note that the signed DCA continues to drop by about another 0.08 cm and stays low for a couple seconds after one would expect the full STAR TPC ion drift to complete, and this matches an as yet not understood feature seen in some of the anomalous Abort Gap Cleaning events.
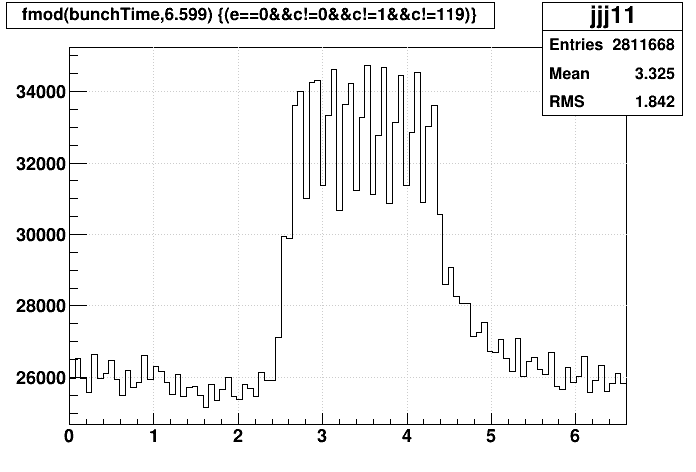
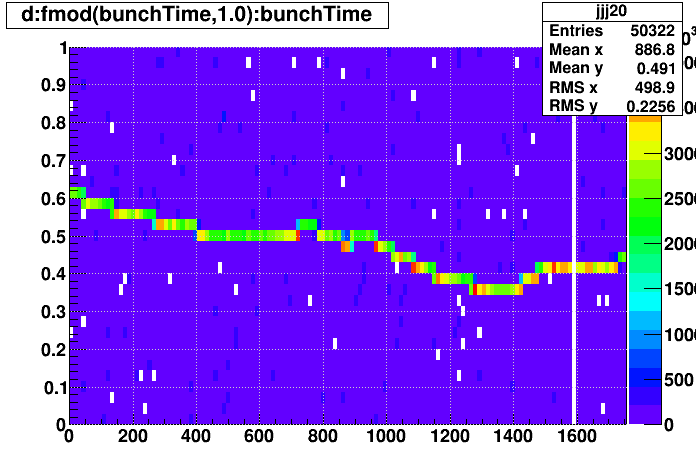
There seems to remain an additional feature in the data at a different periodicity that shows up as peaks every ~0.2 seconds in the DAQ data, as more clearly seen in the finer-binned version of the event counts plot (without excluding adc events) below. This does not mean it is something that happens with a periodicity of ~0.2 seconds, merely that it has some difference from 6.599 seconds (or ~6.6 seconds) that is some particular multiple of 0.2 seconds. For example, something with a periodicity of ~1.0 seconds would residually show up at ~0.2 second intervals in this modulo plot (though it should be noted that the Abort Gap Cleaning events have been removed and should not be a remaining 1.0 second source). However, without any other corroborating information to give me an expectation of a periodicity, I'm not sure at the moment how to hunt this down, so I'll leave it unaddressed for now.
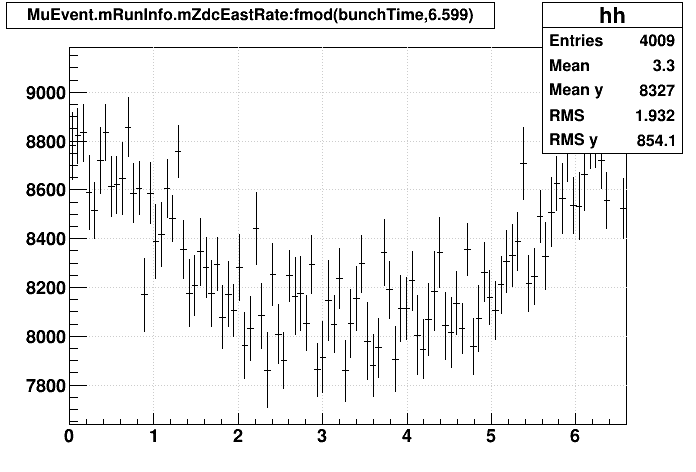
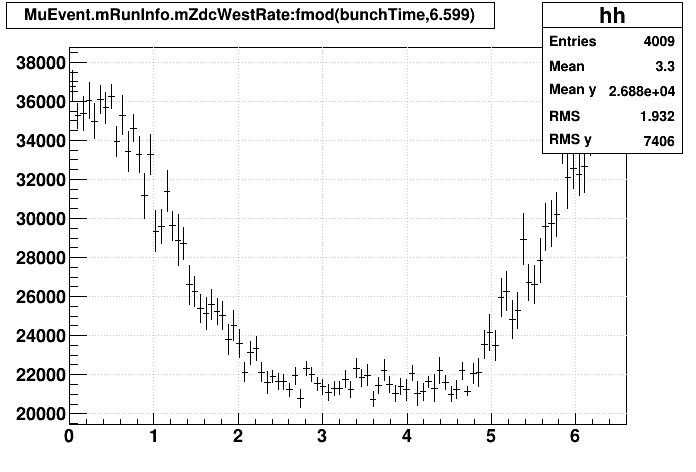
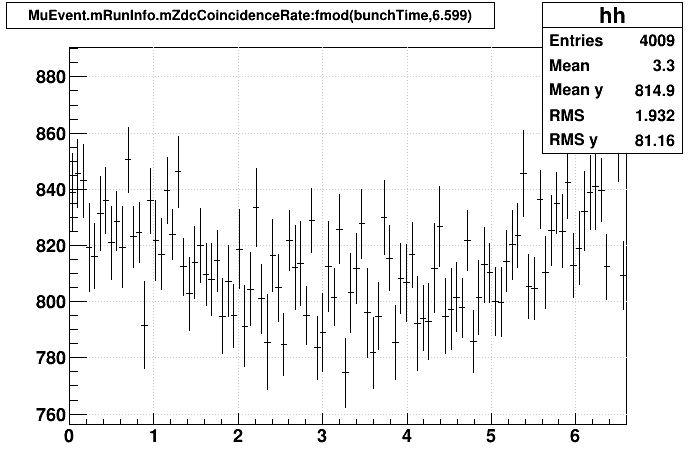
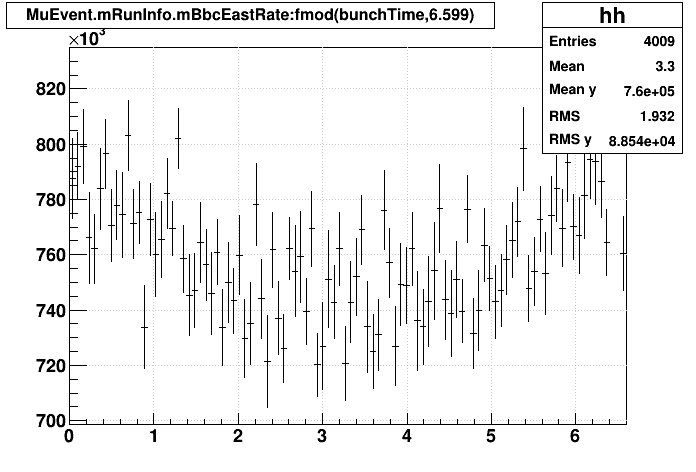
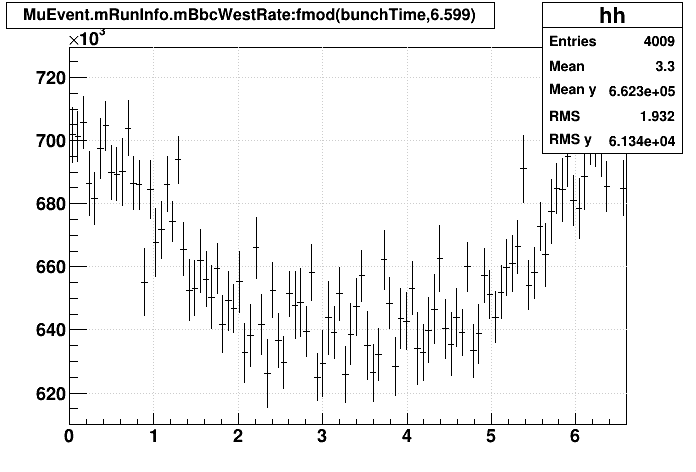
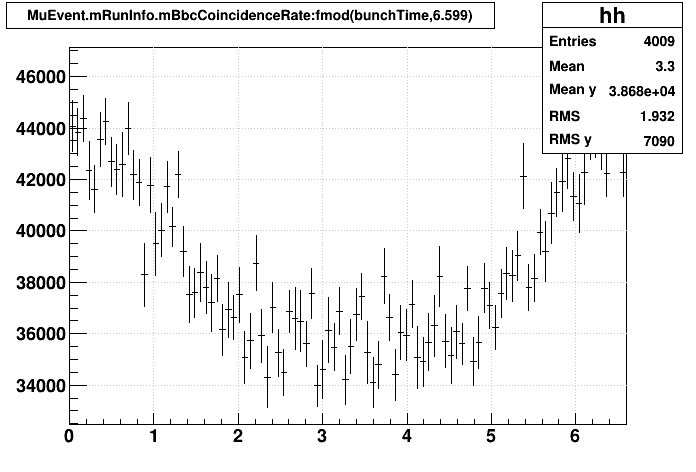
Do we see any evidence for such features in the RICH scalers? The RICH scalers are at best recorded with a granularity of about 1 second within the DAQ stream. So a clear picture cannot be made. However, that should be enough granularity to see something over a 6.599 second period. An important caveat is that RICH scalers are recorded with a timestamp that is not accurate to the time at which their measurement was made: the calculation is inherently performed after the integration period, and there are additional sources of latency in getting that information to DAQ. So while we can hope to see a (perhaps fuzzy) feature, it may be shifted within the period with respect to the above plots. And this is just what we see, looking at ZDC east, west, and coincidence rates, as well as BBC east, west, and coincidence rates from the MuDst shown below. Note that it is probably NOT the dip in these rates over ~2 to ~5 seconds that corresponds to the feature of interest, but rather the increased rates wrapping around from ~6 to ~1 seconds that represents a delayed recording of these rates. The former is a little broader than the latter, as should be the case with a longer "off" time than "on" time. Also, it is worth pointing out that the ZDC west singles rate appears to be the most impacted, increasing by more than 60% during the "on" time! This is consistent with Angelika's observation that the ZDC west singles rate also appeared to have the most increase in variation during operation of the BMM.
I expect there is more to learn, and I should look at more runs to see how consistent things are (I did look briefly at the neighboring runs 19134040 and 19134042 and I still see the effect - more on other runs below). But these findings already raise some important questions:
p.s. In the above plots, I define "bunchTime" in the following way, to avoid any possible issues associated with 32-bit vs. 64-bit numbers (the bunch crossing counter needs more than 32 bits and is stored in two 32-bit variables), where freq is the value of the RHIC clock frequency [Hz]:
UPDATE #1 2019-06-03:
I took a closer look at neighboring runs 19134040 and 19134042 (the three runs pretty much comprise all of fill 21725). For the most part these look just like run 19134041, just at higher and lower luminosity respectively as the beam intensities dropped. However, run 19134042 appears to show a very slight change in the periodicity (the feature appears to drift slightly later over the course of the run). And then for the last several minutes of run 19134042, the flattop appears to step up to something like ~2.5 seconds in duration!
(plotting note: the location of the feature along the vertical axis should not be compared between runs as the time at which we start bunchTime=0 is not a constant with respect to the 6.599 second period.)
Another check I can make is that Angelika has informed me that the BMM turned "on" at approximately 2018-05-14 16:45 EDT. This is about 1400±100 seconds into run 19134035. And here in fact is the data from that run showing the feature beginning around 1300 seconds into the run. The left plot is run 19134035, and the right one is 19134036, showing that the flattop starts out at the longer ~2.5 second duration, then drops down to ~1.8 second duration half way through the second run.
Supporting this is the signed DCA profile from run 19134035, where I have restricted to a time range near 1300 seconds into the run. The 6.6-second pulses do appear here beginning around 1300 seconds into the run:
An important bit of information from the runs I have examined is that this feature is not something introduced at injection that remains in RHIC during the fill. It is a dynamic feature that can change mid-fill.
-Gene
There is a feature in the signed DCAs with a periodicity between 6 and 7 seconds. Using the DAQ event size data and a technique I employed when first studying the Abort Gap Cleaning, I was able to see something that was of the appropriate time periodicity. The idea is to see periodicity by plotting the time of events (with high resolution using the bunch crossing counter divided by the RHIC clock frequency) modulo some expectation of the periodicity, versus the time in the run (no modulo). When the expectation of periodicity is incorrect, periodic features show up as diagonal stripes. When correct, the feature becomes a straight horizontal stripe.
Here are three plots from the DAQ data using this technique (abscissa and ordinate units are [sec]), where the periodicity was found to be 6.599 seconds (one can actually see a slight tilt when using 6.600 seconds, but I will nevertheless refer to this as the "6.6 second anomaly" for now), of (left) the sum of all event sizes, (middle) the count of events, and (right) the average (sum/counts) event sizes:
The feature appears to be "on" for a duration of ~1.8 seconds out of each 6.599 second period. It leads to smaller-than-usual events, but they are triggered (acquired) more often, leading to an increase in total data being acquired during the feature.
As an aside, to see the above feature, I made a cut to exclude the DAQ metadata that corresponded with the Abort Gap Cleaning, and also excluded "adc" events. For comparison, here are the same three plots where I specifically cut to focus on the Abort Gap Cleaning. One can see that a periodicity of 1 second is not quite correct, particularly because the periodicity does not hold constant! One can also see that the Abort Gap Cleaning events' average size is much larger than other events, unlike the new 6.6 second anomaly.
I discussed this feature with Jamie D. and Jeff L., and our conclusion is that we are triggering on a lot of low-multiplicity backgrounds (undesired collisions of beam with something) that are excessive during the "on" time of the feature.
But...what is it? The periodicity matches that of injection runs seen in Run 19, but we did not acquire data during RHIC injection for Run 18. I turned to Angelika D. from C-AD, who suspects it is the cycling of the Booster Main Magnet (BMM), which was on during this run. She also noticed that the STAR ZDC west singles rate appeared to have an increase in variance during periods when the Booster Main Magnet was on around that time. This seems quite surprising, given that the Booster operation is considered to be independent of RHIC after RHIC injection, and implies some kind of electrical linkage to something (magnets?) at RHIC. I hope to pursue this understanding more when I find out more details from Angelika. For now, I did learn from an internet search that the BMM used to operate with a 1 second flattop at a periodicity of 4 seconds (anyone who used to do experiments at the AGS will recognize these numbers and may remember the associated whooping sound!); and my suspicion is that these numbers changed in recent years, perhaps for RHIC BES purposes, or something else like NSRL experiments.
Anyhow, I looked at some other observables to see what else I could learn...
Do the 6.6 second anomaly events come at a specific bunch crossing index, just like the Abort Gap Cleaning does? Here are some plots vs. bunch crossing index that do appear to demonstrate an increase in events at bunch crossings just after one of the beams' abort gaps, though I'm not sure which beam it is (the abort gaps clearly weren't aligned at STAR during this run). The right two plots are essentially horizontal slices of the left plot along times which are clearly inside (red), outside but near (blue), and clearly outside (black) the feature (the right plot zooms in on the vertical axis). The red data appears to rise a bit more above the rest of its histogram in the bins (bunch crossing indices) roughly around 48-60. It would take more statistics to make this more convincing. Also of note, I did not exclude the Abort Gap Cleaning events from these particular plots, and they show up at bunch crossing index 0±1 (-1 is actually 119) for this run.
How do the signed DCAs look when plotted versus time modulo the 6.599 second period, and do the features in signed DCA line up in time with the feature in the DAQ data? Here's signed DCA on top, then the DAQ data of event size sum, event counts, and event size average vs. the periodic time. The signed DCA rises by about 0.25 cm starting around 2.5 seconds, coinciding with the DAQ data feature turning "on", and begins to fall again at at around 4.3 seconds when the DAQ feature turns "off": this is a nearly perfect match! I will note that the signed DCA continues to drop by about another 0.08 cm and stays low for a couple seconds after one would expect the full STAR TPC ion drift to complete, and this matches an as yet not understood feature seen in some of the anomalous Abort Gap Cleaning events.
There seems to remain an additional feature in the data at a different periodicity that shows up as peaks every ~0.2 seconds in the DAQ data, as more clearly seen in the finer-binned version of the event counts plot (without excluding adc events) below. This does not mean it is something that happens with a periodicity of ~0.2 seconds, merely that it has some difference from 6.599 seconds (or ~6.6 seconds) that is some particular multiple of 0.2 seconds. For example, something with a periodicity of ~1.0 seconds would residually show up at ~0.2 second intervals in this modulo plot (though it should be noted that the Abort Gap Cleaning events have been removed and should not be a remaining 1.0 second source). However, without any other corroborating information to give me an expectation of a periodicity, I'm not sure at the moment how to hunt this down, so I'll leave it unaddressed for now.
Do we see any evidence for such features in the RICH scalers? The RICH scalers are at best recorded with a granularity of about 1 second within the DAQ stream. So a clear picture cannot be made. However, that should be enough granularity to see something over a 6.599 second period. An important caveat is that RICH scalers are recorded with a timestamp that is not accurate to the time at which their measurement was made: the calculation is inherently performed after the integration period, and there are additional sources of latency in getting that information to DAQ. So while we can hope to see a (perhaps fuzzy) feature, it may be shifted within the period with respect to the above plots. And this is just what we see, looking at ZDC east, west, and coincidence rates, as well as BBC east, west, and coincidence rates from the MuDst shown below. Note that it is probably NOT the dip in these rates over ~2 to ~5 seconds that corresponds to the feature of interest, but rather the increased rates wrapping around from ~6 to ~1 seconds that represents a delayed recording of these rates. The former is a little broader than the latter, as should be the case with a longer "off" time than "on" time. Also, it is worth pointing out that the ZDC west singles rate appears to be the most impacted, increasing by more than 60% during the "on" time! This is consistent with Angelika's observation that the ZDC west singles rate also appeared to have the most increase in variation during operation of the BMM.
I expect there is more to learn, and I should look at more runs to see how consistent things are (I did look briefly at the neighboring runs 19134040 and 19134042 and I still see the effect - more on other runs below). But these findings already raise some important questions:
- Do we need to attempt to correct for this distortion in the data?
- Do we have any issues in "counting" due to the "enhanced" background triggering during the anomalous times?
- Do we need to ask C-AD to discontinue running the BMM during our data-taking?
p.s. In the above plots, I define "bunchTime" in the following way, to avoid any possible issues associated with 32-bit vs. 64-bit numbers (the bunch crossing counter needs more than 32 bits and is stored in two 32-bit variables), where freq is the value of the RHIC clock frequency [Hz]:
float freq = 9361218.0;
MuDst->SetAlias("bunchTime",Form("(MuEvent.mEventInfo.mBunchCrossingNumber[][0]/%f)+(MuEvent.mEventInfo.mBunchCrossingNumber[][1]*pow(2,16)/(%f/pow(2,16)))",freq,freq));
_____________________________________UPDATE #1 2019-06-03:
I took a closer look at neighboring runs 19134040 and 19134042 (the three runs pretty much comprise all of fill 21725). For the most part these look just like run 19134041, just at higher and lower luminosity respectively as the beam intensities dropped. However, run 19134042 appears to show a very slight change in the periodicity (the feature appears to drift slightly later over the course of the run). And then for the last several minutes of run 19134042, the flattop appears to step up to something like ~2.5 seconds in duration!
(plotting note: the location of the feature along the vertical axis should not be compared between runs as the time at which we start bunchTime=0 is not a constant with respect to the 6.599 second period.)
Another check I can make is that Angelika has informed me that the BMM turned "on" at approximately 2018-05-14 16:45 EDT. This is about 1400±100 seconds into run 19134035. And here in fact is the data from that run showing the feature beginning around 1300 seconds into the run. The left plot is run 19134035, and the right one is 19134036, showing that the flattop starts out at the longer ~2.5 second duration, then drops down to ~1.8 second duration half way through the second run.
Supporting this is the signed DCA profile from run 19134035, where I have restricted to a time range near 1300 seconds into the run. The 6.6-second pulses do appear here beginning around 1300 seconds into the run:
An important bit of information from the runs I have examined is that this feature is not something introduced at injection that remains in RHIC during the fill. It is a dynamic feature that can change mid-fill.
-Gene
»
- genevb's blog
- Login or register to post comments