- genevb's home page
- Posts
- 2025
- 2024
- 2023
- 2022
- September (1)
- 2021
- 2020
- 2019
- 2018
- 2017
- December (1)
- October (3)
- September (1)
- August (1)
- July (2)
- June (2)
- April (2)
- March (2)
- February (1)
- 2016
- November (2)
- September (1)
- August (2)
- July (1)
- June (2)
- May (2)
- April (1)
- March (5)
- February (2)
- January (1)
- 2015
- December (1)
- October (1)
- September (2)
- June (1)
- May (2)
- April (2)
- March (3)
- February (1)
- January (3)
- 2014
- 2013
- 2012
- 2011
- January (3)
- 2010
- February (4)
- 2009
- 2008
- 2005
- October (1)
- My blog
- Post new blog entry
- All blogs
Event-by-Event T0 in Run 21 FXT
Updated on Thu, 2023-08-10 16:25. Originally created by genevb on 2023-08-10 16:25.
This is a calibration of my event-by-event T0 correction method for Run 21 FXT data due to when a collision occurs within a bunch crossing (primarily an issue for long bunches, as is the case in fixed target data). There are 5 FXT beam energies, so these are the results for all 5.
NB: The 3p85 GeV data has a correction for SpaceCharge while the others do not.
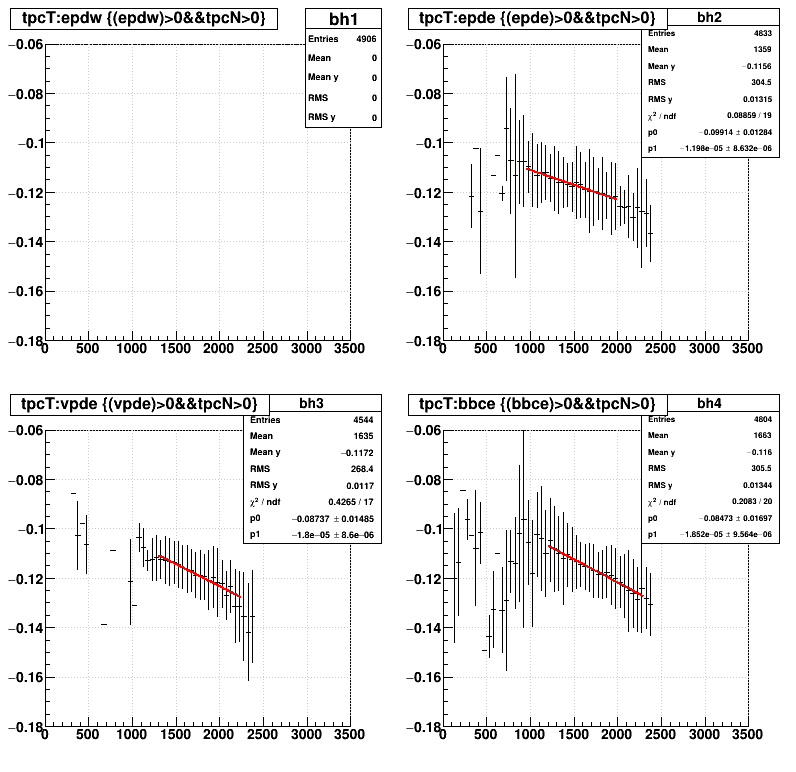
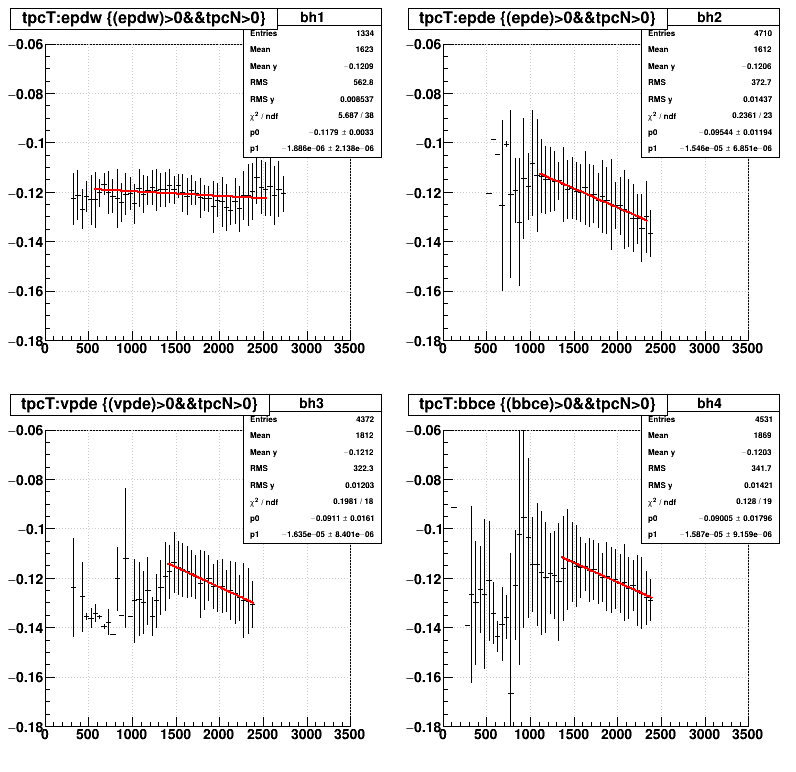
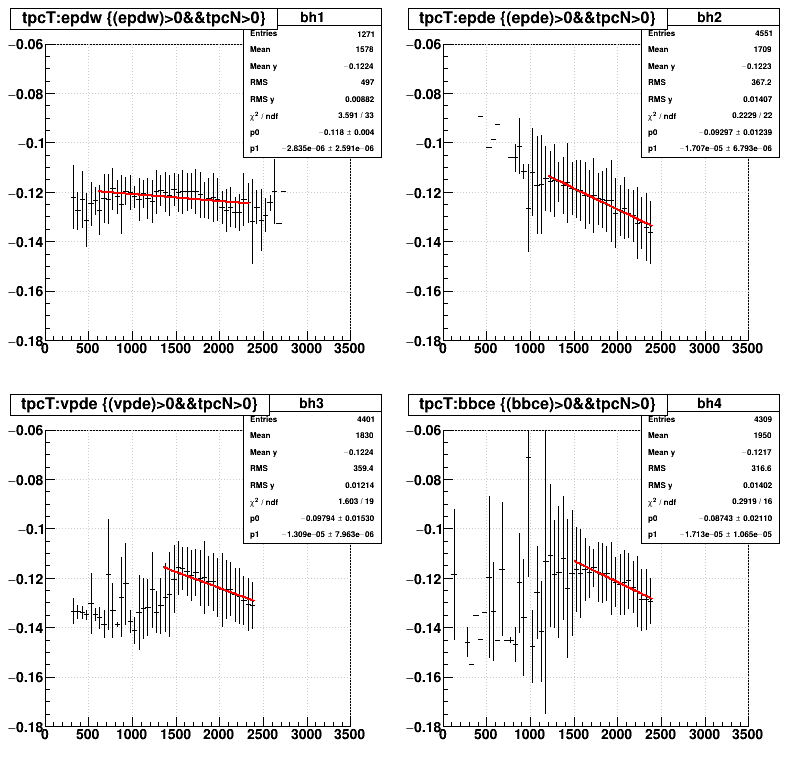
You may want to open the plots in a separate browser tab or window to see them at full resolution. They are shrunk here to fit nicely. The left set of 4 plots show the dependency TPC timing as measured by a mean (profile) of TPC prompt hit times in the east TPC versus various trigger detector first hit times:
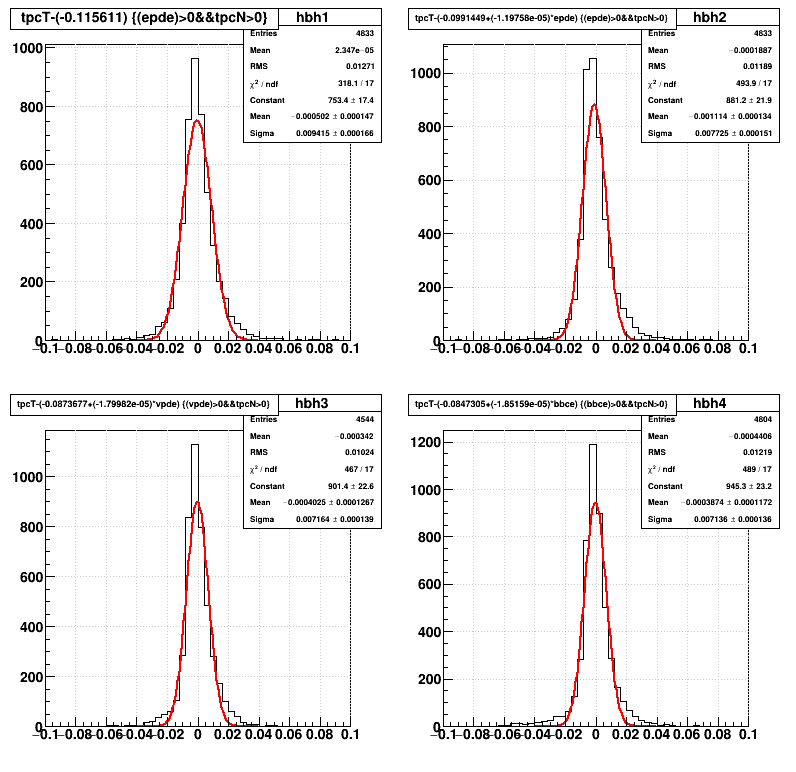
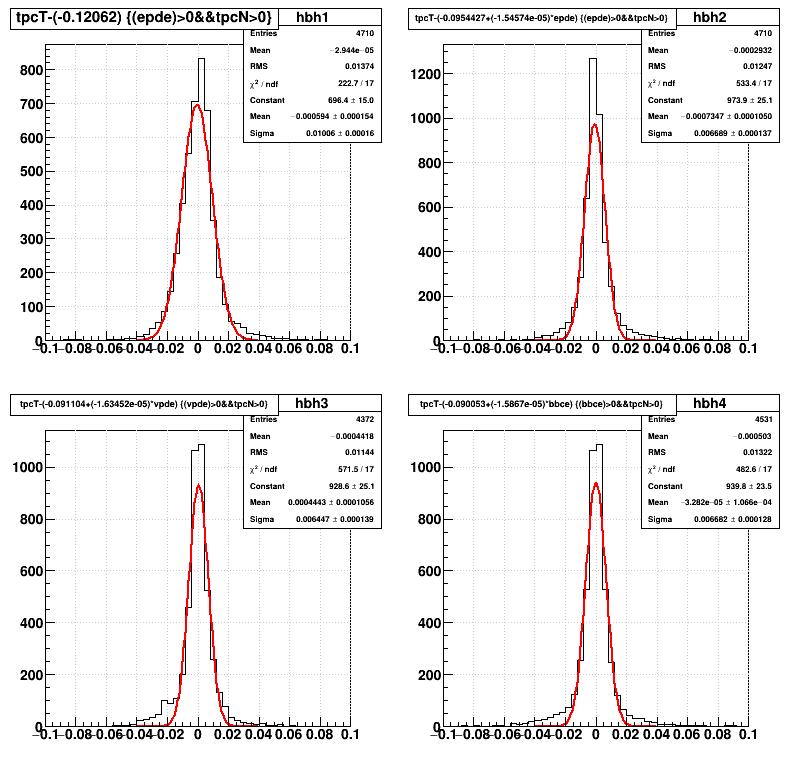
The right side plots use those fits to correct the TPC timings for the dependence and then show the spread of the remaining time distribution. The top left plot no longer shows EPD west, but rather the uncorrected TPC time distribution.
After the plots is a table of relevant information for how these three corrections perform in reducing the spread of the timing, and what database parameters would need to be used for those corrections to be applied properly.
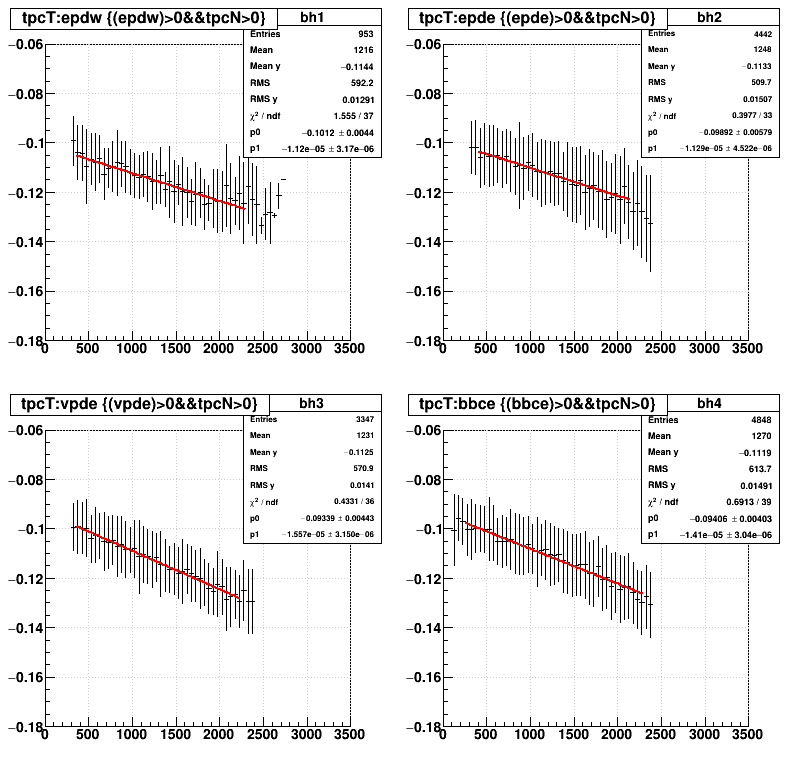
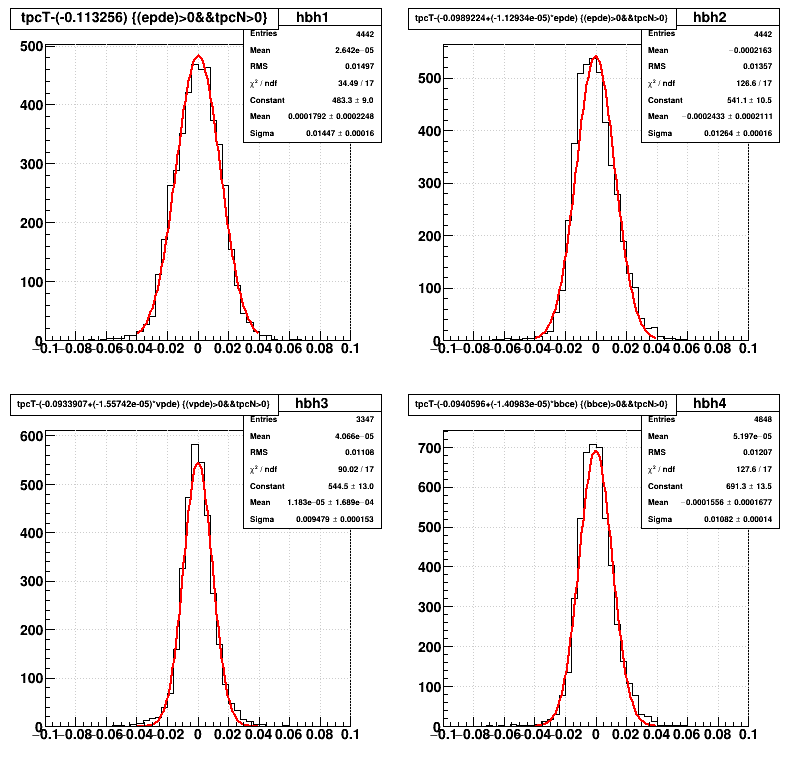
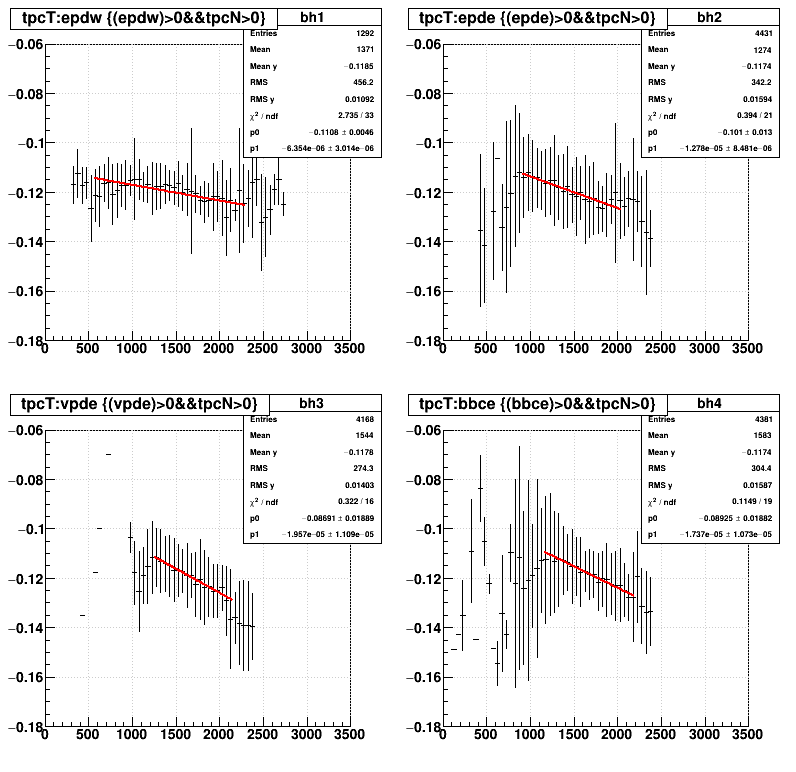
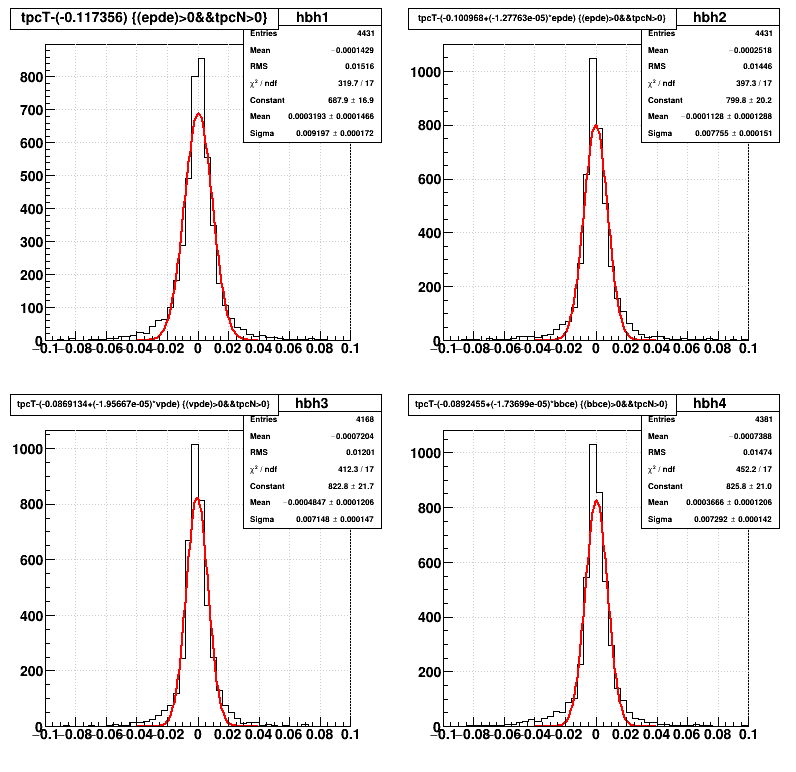

3p85: P2021a,StiCA,FXT,EbyET0,BEmcChkStat,-OPr13,OPr40,-hitfilt,-mtd,-etofA,-picoWrite,-EventQA
others: P2021a,StiCA,FXT,EbyET0,-OSpaceZ2,-OGridLeakFull,BEmcChkStat,-hitfilt,-mtd,-etofA,-picoWrite,-EventQA
I have attached the macro that I use to fit the data. One can execute it via:
NB: The 3p85 GeV data has a correction for SpaceCharge while the others do not.
You may want to open the plots in a separate browser tab or window to see them at full resolution. They are shrunk here to fit nicely. The left set of 4 plots show the dependency TPC timing as measured by a mean (profile) of TPC prompt hit times in the east TPC versus various trigger detector first hit times:
- EPD west (upper left)
- EPD east (upper right)
- VPD east (lower left)
- BBC east (lower right)
The right side plots use those fits to correct the TPC timings for the dependence and then show the spread of the remaining time distribution. The top left plot no longer shows EPD west, but rather the uncorrected TPC time distribution.
After the plots is a table of relevant information for how these three corrections perform in reducing the spread of the timing, and what database parameters would need to be used for those corrections to be applied properly.
3p85


original width = 0.0144715	rms = 0.0149664	mean = -0.11323
epde	: width = 0.0126401	rms = 0.013566	from: -0.0140909	1.12934e-05
vpde	: width = 0.00947877	rms = 0.0110784	from: -0.0198795	1.55742e-05
bbce	: width = 0.0108243	rms = 0.0120654	from: -0.0192219	1.40983e-05
26p5


original width = 0.00919687	rms = 0.0151638	mean = -0.117499
epde	: width = 0.00775517	rms = 0.014457	from: -0.0162789	1.27763e-05
vpde	: width = 0.00714808	rms = 0.012014	from: -0.0298654	1.95667e-05
bbce	: width = 0.00729246	rms = 0.0147443	from: -0.0275149	1.73699e-05
44p5


original width = 0.00941487	rms = 0.0127096	mean = -0.115587
epde	: width = 0.00772533	rms = 0.0118944	from: -0.0162537	1.19758e-05
vpde	: width = 0.00716421	rms = 0.010239	from: -0.0278776	1.79982e-05
bbce	: width = 0.00713588	rms = 0.0121915	from: -0.0304162	1.85159e-05
70


original width = 0.0100569	rms = 0.0137423	mean = -0.12065
epde	: width = 0.00668909	rms = 0.0124718	from: -0.0249138	1.54574e-05
vpde	: width = 0.00644711	rms = 0.0114357	from: -0.0291038	1.63452e-05
bbce	: width = 0.00668231	rms = 0.0132153	from: -0.0300936	1.5867e-05
100


original width = 0.0100891	rms = 0.0131649	mean = -0.122306
epde	: width = 0.00642588	rms = 0.0114771	from: -0.0291507	1.70661e-05
vpde	: width = 0.00645699	rms = 0.0119975	from: -0.0238381	1.30892e-05
bbce	: width = 0.00652631	rms = 0.0127114	from: -0.0340659	1.71333e-05
Additional information:
Reconstruction chains used in processing 5000 events from each energy:3p85: P2021a,StiCA,FXT,EbyET0,BEmcChkStat,-OPr13,OPr40,-hitfilt,-mtd,-etofA,-picoWrite,-EventQA
others: P2021a,StiCA,FXT,EbyET0,-OSpaceZ2,-OGridLeakFull,BEmcChkStat,-hitfilt,-mtd,-etofA,-picoWrite,-EventQA
I have attached the macro that I use to fit the data. One can execute it via:
root -l EbyET0.22126023.2553948.root 'dofits.C(0,"44p5")'
»
- genevb's blog
- Login or register to post comments
