- genevb's home page
- Posts
- 2025
- 2024
- 2023
- 2022
- September (1)
- 2021
- 2020
- 2019
- December (1)
- October (4)
- September (2)
- August (6)
- July (1)
- June (2)
- May (4)
- April (2)
- March (3)
- February (3)
- 2018
- 2017
- December (1)
- October (3)
- September (1)
- August (1)
- July (2)
- June (2)
- April (2)
- March (2)
- February (1)
- 2016
- November (2)
- September (1)
- August (2)
- July (1)
- June (2)
- May (2)
- April (1)
- March (5)
- February (2)
- January (1)
- 2015
- December (1)
- October (1)
- September (2)
- June (1)
- May (2)
- April (2)
- March (3)
- February (1)
- January (3)
- 2014
- December (2)
- October (2)
- September (2)
- August (3)
- July (2)
- June (2)
- May (2)
- April (9)
- March (2)
- February (2)
- January (1)
- 2013
- December (5)
- October (3)
- September (3)
- August (1)
- July (1)
- May (4)
- April (4)
- March (7)
- February (1)
- January (2)
- 2012
- December (2)
- November (6)
- October (2)
- September (3)
- August (7)
- July (2)
- June (1)
- May (3)
- April (1)
- March (2)
- February (1)
- 2011
- November (1)
- October (1)
- September (4)
- August (2)
- July (4)
- June (3)
- May (4)
- April (9)
- March (5)
- February (6)
- January (3)
- 2010
- December (3)
- November (6)
- October (3)
- September (1)
- August (5)
- July (1)
- June (4)
- May (1)
- April (2)
- March (2)
- February (4)
- January (2)
- 2009
- November (1)
- October (2)
- September (6)
- August (4)
- July (4)
- June (3)
- May (5)
- April (5)
- March (3)
- February (1)
- 2008
- 2005
- October (1)
- My blog
- Post new blog entry
- All blogs
Impacts of loading high-core-count nodes
Updated on Thu, 2025-03-13 23:01. Originally created by genevb on 2025-03-11 21:45.
NB: Much of the discussion in this blog post relates very closely with the discussions that took place in SDCC RT ticket 37663.
______
Running many similar root4star jobs simultaneously on any high-core-count node in the SDCC farm leads to slower (longer) CPU times, less efficient cores. These efficiency losses are outweighed by the benefit of more cores, so maximal throughput per node is still with all (virtual) cores loaded. However, at the time of this posting, the efficiency losses are not understood.
These tests are on machines with 48 real cores, which provide 96 virtual cores via hyperthreading (HT).

Inverting and multiplying by the number of jobs (i.e. # jobs divided by slowdown factor) gives the effective number of cores on the machine (i.e. 45 means effectively x45 faster than a single, isolated core).

Costin argues that this is the expected behavior of the CPU clocks on Intel's Xeon Gold CPUs, colorfully documented here, and further links that can be followed therein. The machines at SDCC hold 2 of these 24-core Xeon Gold CPUs, giving them 48 real cores (before hyperthreading). Our root4star jobs contain no SIMD instructions, so the CPUs should be in their "Normal" mode, for which the base frequency is 2.1 GHz and maximum "turbo" frequency is 3.7 GHz, but the CPUs can go into a low frequency mode that slows the clock further if the electrical and thermal loads necessitate it.
Costin also referred me to the Grafana plots that allow essentially a real-time examination of the varying clock frequencies of individual nodes. He also gave a warning that he did not feel confident that what is displayed is necessarily accurate of the clock speeds as they can vary significantly in time and are only sampled at some interval (looks like every 15 seconds) for Grafana with a tool that may not even give an accurate number.
That said....I went ahead and studied the behavior of the Grafana information when loading the nodes with root4star jobs.
First, it should be noted that there is a lot of volatility for the initial part of the jobs during the initializations and overheads of the first event. After that, a somewhat steady state appeared during the remainder of the jobs. These two plots show the transition into the steady state for the cases of 48 (left) and 96 (right) jobs on the node from a 5 minute span of time:


Here now are 5-minute span steady state plots for various loads:
Some observations on the behavior:


There's a notable spread in the mean clock frequencies even under steady state for each degree of loading, but we're presumably sampling a variety of event reconstruction processes on a variety of events (even if they're all similar physics events). The 96-job data even shows a clear bi-modality (and the modes even seem to mostly be in large blocks of consecutively numbered cores, but it isn't worth spending time on understanding that any better here). At idle, most cores are sitting at the maximum 3.7 GHz.
We could interpret the average of the mean clock frequencies as the "slow-down" factor contributions for the node from the slower clocks when loading the cores, just as discussed in the linked information about the Xeon Gold processor. In that light, the clock frequencies give about x1.3 slow-down for 48 jobs, and just shy of x1.5 for 96 jobs. These values aren't quite as large as the slow-down factors seen from the root4star job CPU times earlier on this page, but it is clear that lowering of clock frequencies is a signficant contributor, and may perhaps explain all of it if we're not capturing the full extent of the lowering that is really happening on the chips.
-Gene
______
Running many similar root4star jobs simultaneously on any high-core-count node in the SDCC farm leads to slower (longer) CPU times, less efficient cores. These efficiency losses are outweighed by the benefit of more cores, so maximal throughput per node is still with all (virtual) cores loaded. However, at the time of this posting, the efficiency losses are not understood.
These tests are on machines with 48 real cores, which provide 96 virtual cores via hyperthreading (HT).
- Closed symbols are with HT; open symbols are without HT
- Circles are 64-bit; triangles are 32-bit
- Red and orange are on an Alma9 machine; blues and greens are on an SL7 machine
- Darker colors are in SL7 containers; lighter colors are directly on SL7 (I do not have root4star running directly on Alma9)
Inverting and multiplying by the number of jobs (i.e. # jobs divided by slowdown factor) gives the effective number of cores on the machine (i.e. 45 means effectively x45 faster than a single, isolated core).
Costin argues that this is the expected behavior of the CPU clocks on Intel's Xeon Gold CPUs, colorfully documented here, and further links that can be followed therein. The machines at SDCC hold 2 of these 24-core Xeon Gold CPUs, giving them 48 real cores (before hyperthreading). Our root4star jobs contain no SIMD instructions, so the CPUs should be in their "Normal" mode, for which the base frequency is 2.1 GHz and maximum "turbo" frequency is 3.7 GHz, but the CPUs can go into a low frequency mode that slows the clock further if the electrical and thermal loads necessitate it.
Costin also referred me to the Grafana plots that allow essentially a real-time examination of the varying clock frequencies of individual nodes. He also gave a warning that he did not feel confident that what is displayed is necessarily accurate of the clock speeds as they can vary significantly in time and are only sampled at some interval (looks like every 15 seconds) for Grafana with a tool that may not even give an accurate number.
That said....I went ahead and studied the behavior of the Grafana information when loading the nodes with root4star jobs.
First, it should be noted that there is a lot of volatility for the initial part of the jobs during the initializations and overheads of the first event. After that, a somewhat steady state appeared during the remainder of the jobs. These two plots show the transition into the steady state for the cases of 48 (left) and 96 (right) jobs on the node from a 5 minute span of time:
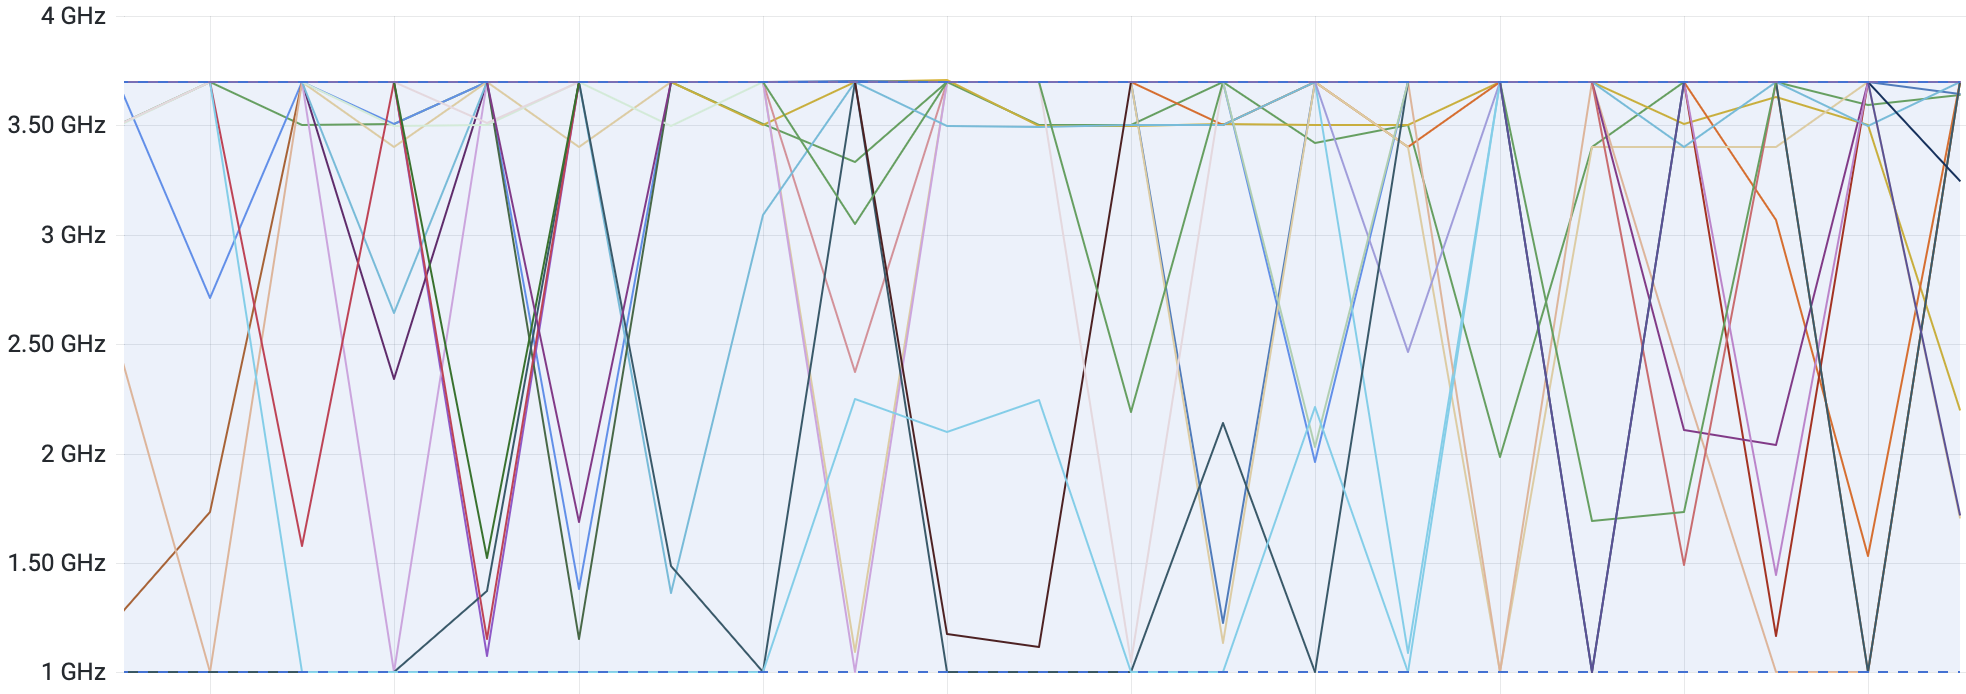
Here now are 5-minute span steady state plots for various loads:
| 0 jobs (idle) |
 |
| 4 jobs | 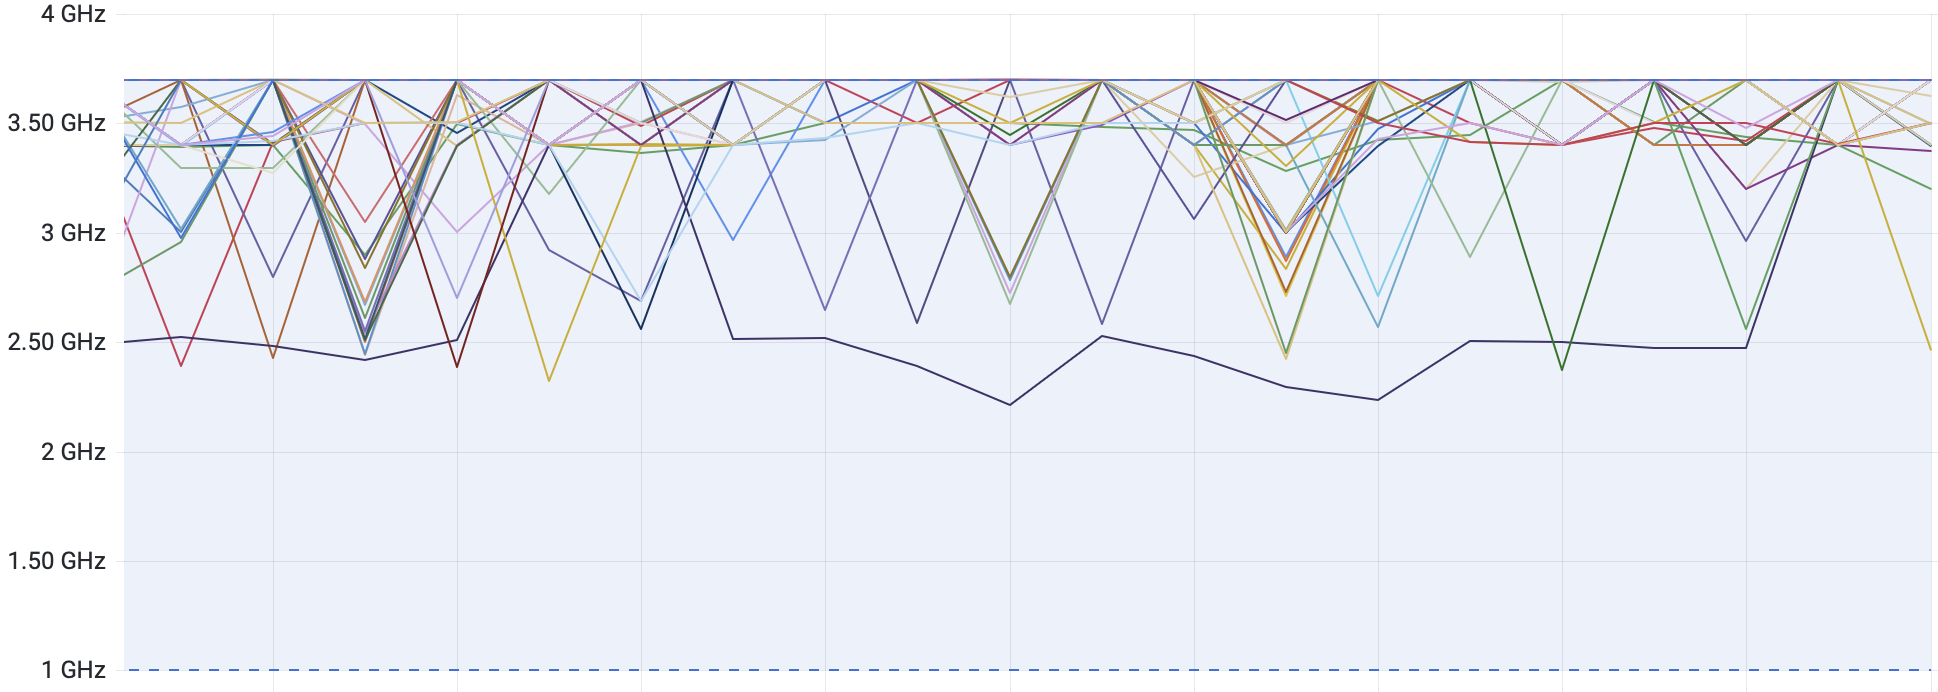 |
| 16 jobs | 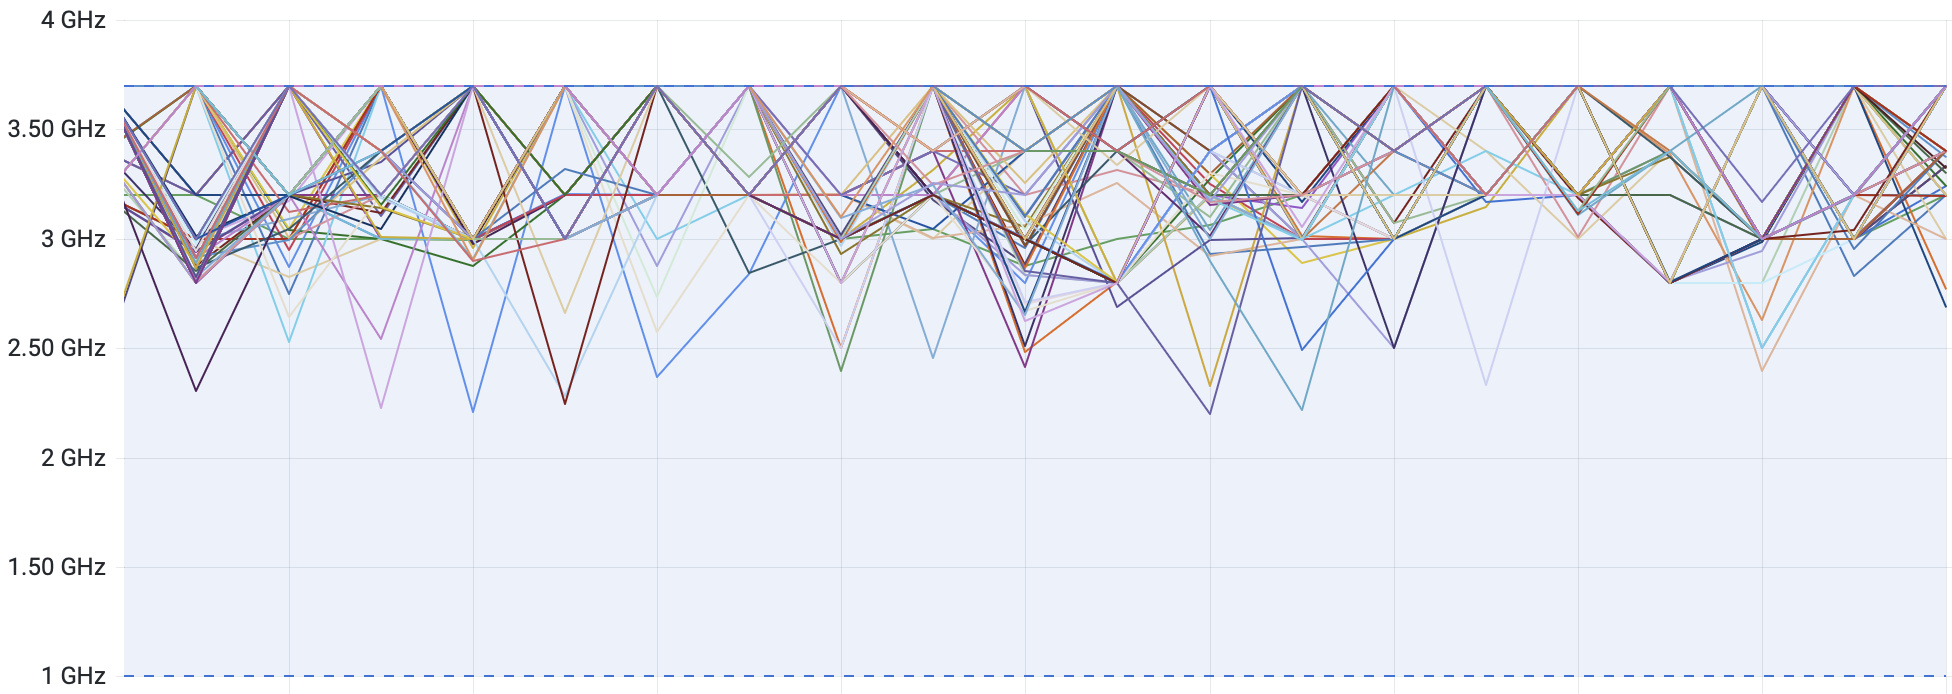 |
| 32 jobs | 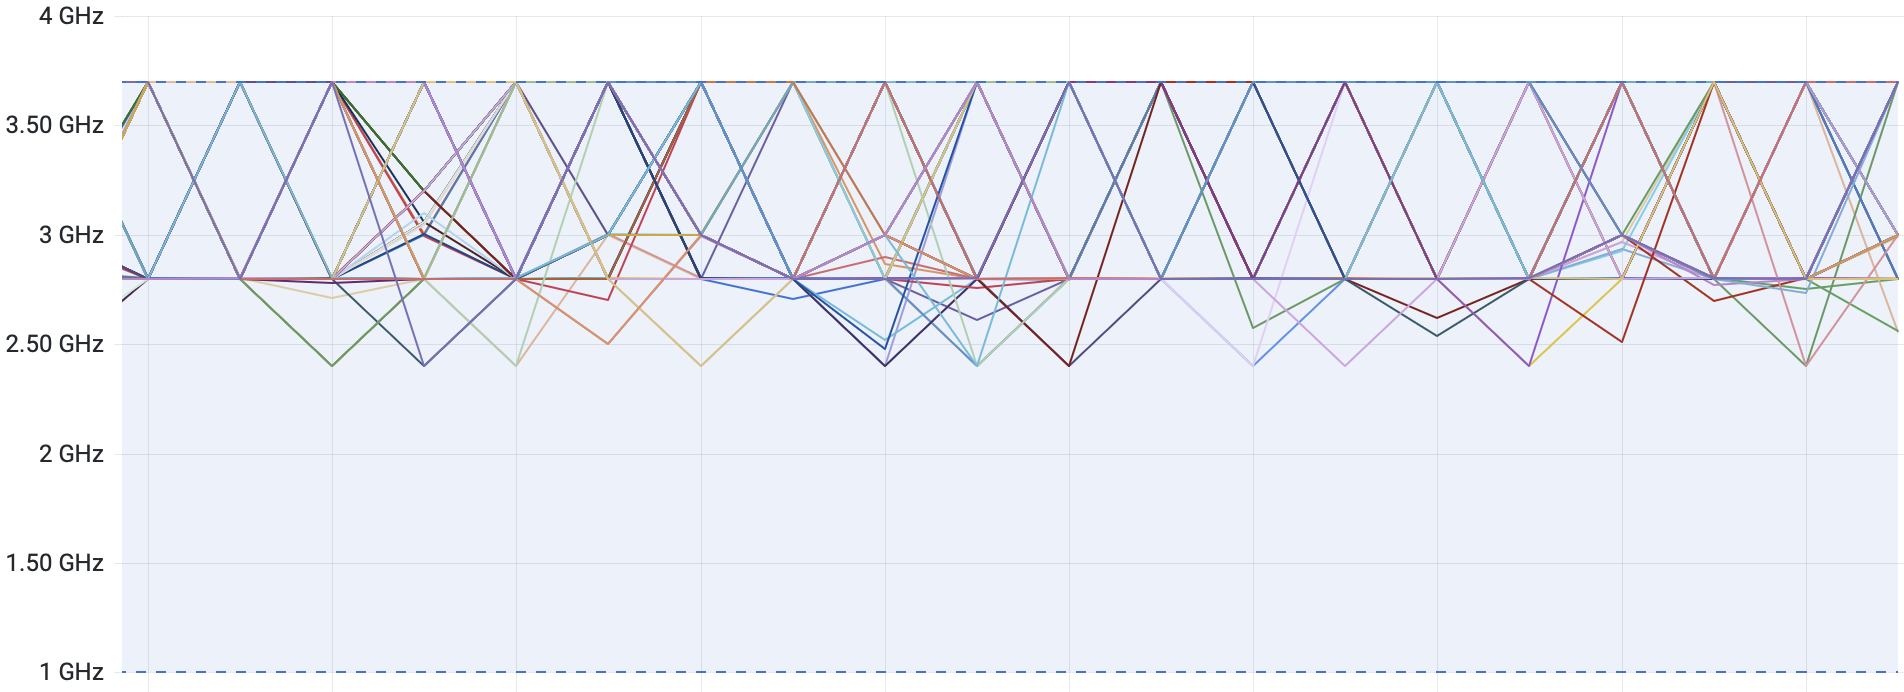 |
| 48 jobs | 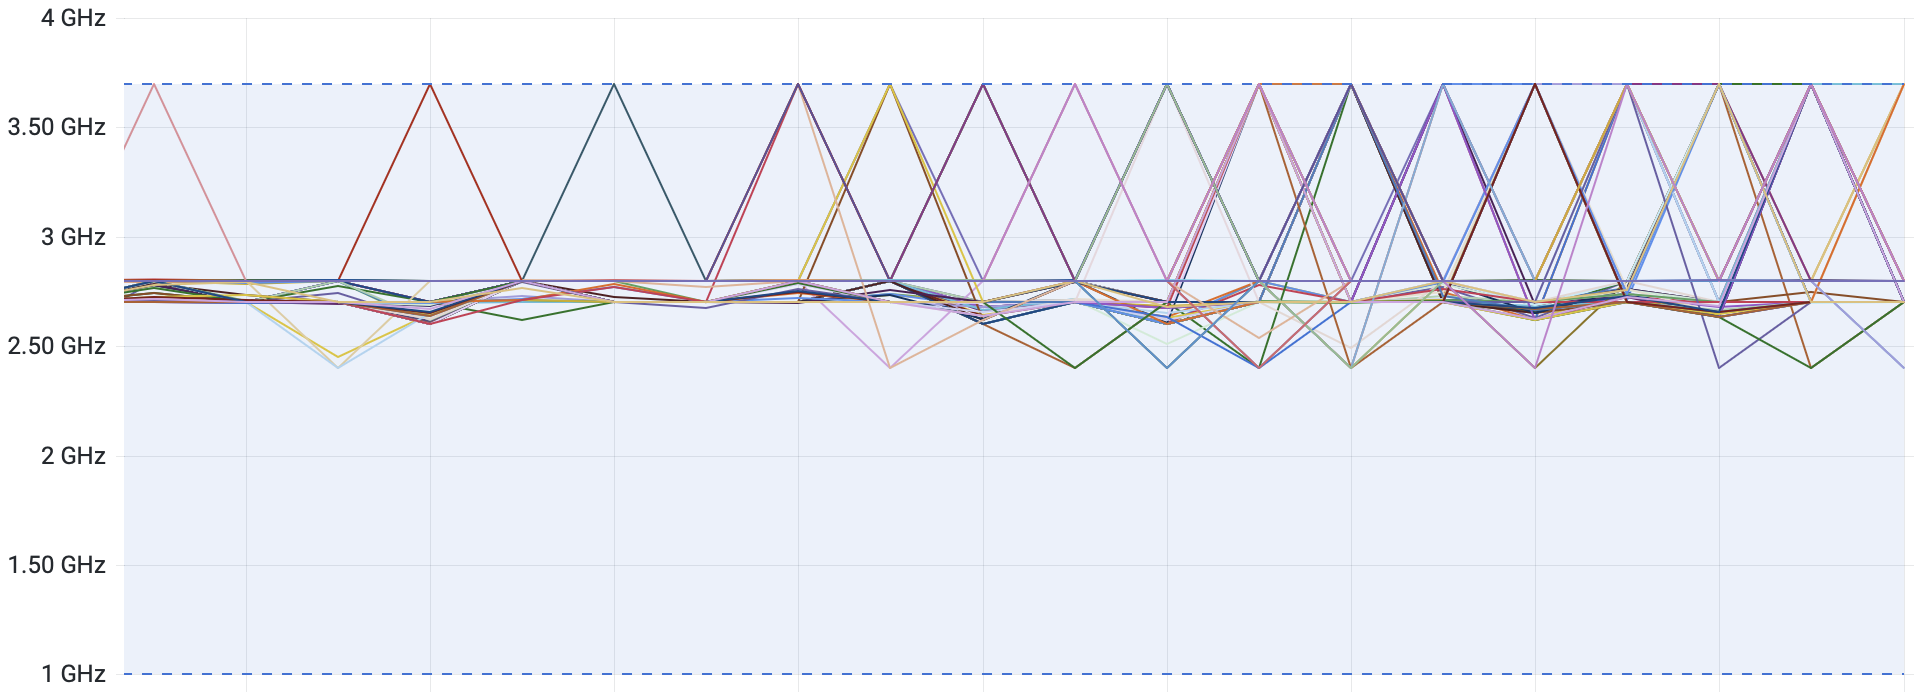 |
| 96 jobs | 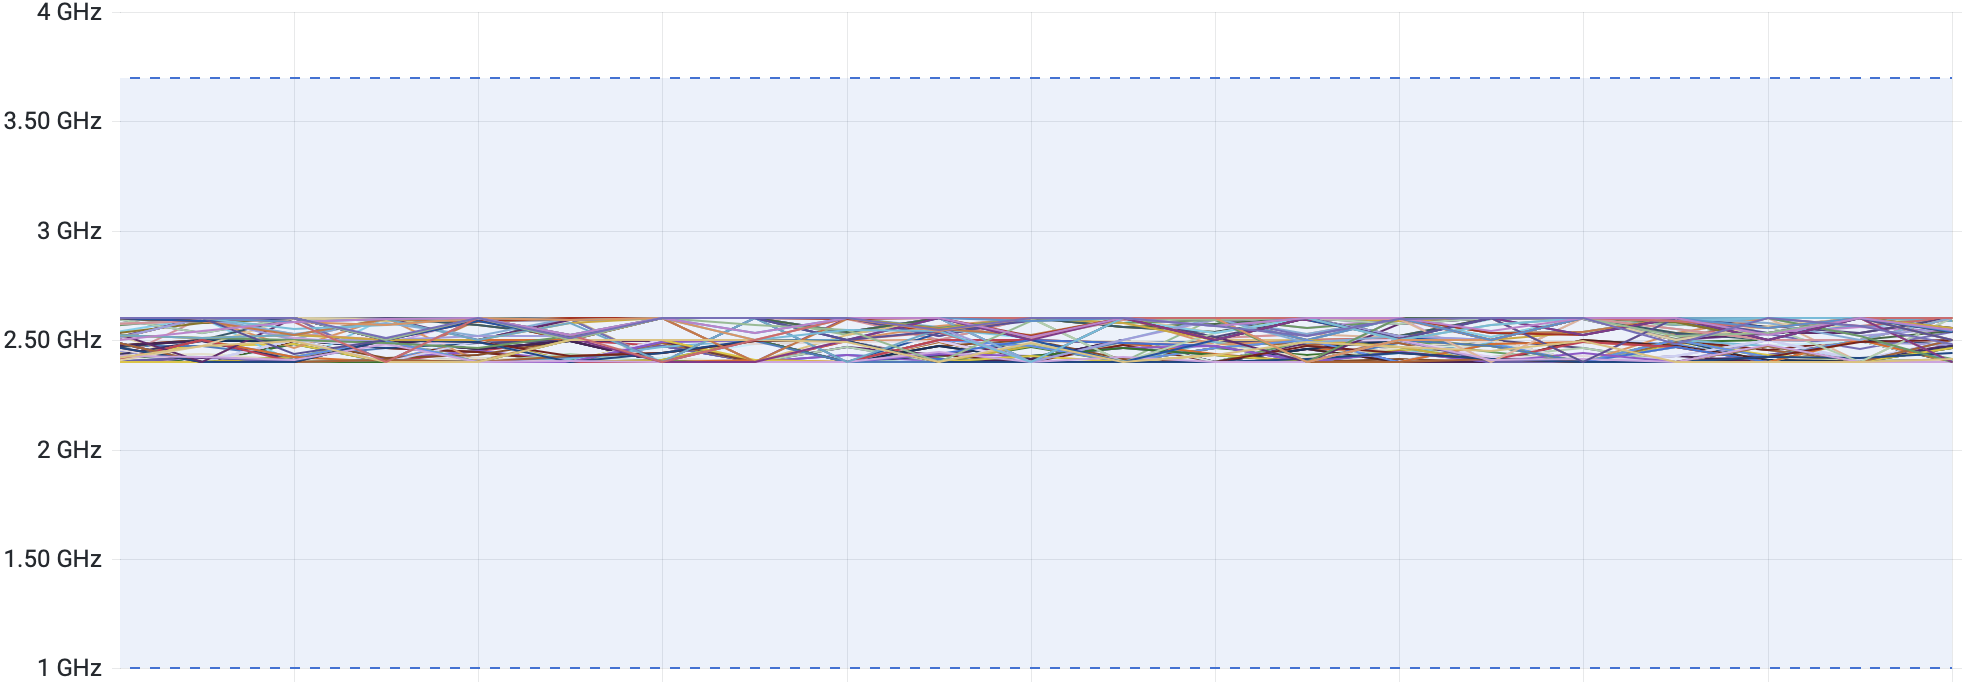 |
Some observations on the behavior:
- The frequencies are all over the place at idle.
- When N jobs start, it isn't just N cores dropping in frequency (perhaps because the actual processing of any one job may hop from one core to another, even if run as embarrassingly parallel?)
- At 48 and fewer jobs, each core may from time-to-time go back up to the maximum 3.7 GHz, but at 96 jobs all cores are held in a narrow range of frequencies.
- No frequencies below 2.2 GHz appear outside of idle (that's about 60% of 3.7 GHz, which translates to an instantaneous "slow-down factor" of ~x1.7), so these plots (for what they're worth) don't show signs of low frequency mode.
There's a notable spread in the mean clock frequencies even under steady state for each degree of loading, but we're presumably sampling a variety of event reconstruction processes on a variety of events (even if they're all similar physics events). The 96-job data even shows a clear bi-modality (and the modes even seem to mostly be in large blocks of consecutively numbered cores, but it isn't worth spending time on understanding that any better here). At idle, most cores are sitting at the maximum 3.7 GHz.
We could interpret the average of the mean clock frequencies as the "slow-down" factor contributions for the node from the slower clocks when loading the cores, just as discussed in the linked information about the Xeon Gold processor. In that light, the clock frequencies give about x1.3 slow-down for 48 jobs, and just shy of x1.5 for 96 jobs. These values aren't quite as large as the slow-down factors seen from the root4star job CPU times earlier on this page, but it is clear that lowering of clock frequencies is a signficant contributor, and may perhaps explain all of it if we're not capturing the full extent of the lowering that is really happening on the chips.
-Gene
»
- genevb's blog
- Login or register to post comments