- genevb's home page
- Posts
- 2025
- 2024
- 2023
- 2022
- September (1)
- 2021
- 2020
- 2019
- 2018
- 2017
- December (1)
- October (3)
- September (1)
- August (1)
- July (2)
- June (2)
- April (2)
- March (2)
- February (1)
- 2016
- November (2)
- September (1)
- August (2)
- July (1)
- June (2)
- May (2)
- April (1)
- March (5)
- February (2)
- January (1)
- 2015
- December (1)
- October (1)
- September (2)
- June (1)
- May (2)
- April (2)
- March (3)
- February (1)
- January (3)
- 2014
- 2013
- 2012
- 2011
- January (3)
- 2010
- February (4)
- 2009
- 2008
- 2005
- October (1)
- My blog
- Post new blog entry
- All blogs
Run 20 AuAu9.2 EbyE T0 calibration
Updated on Fri, 2023-01-27 16:12. Originally created by genevb on 2023-01-27 16:12.
I looked at 4 runs spread across the three trigger setups (production_9p2GeV_2020, production_9p2GeV_2020b, and production_9p2GeV_2020c):
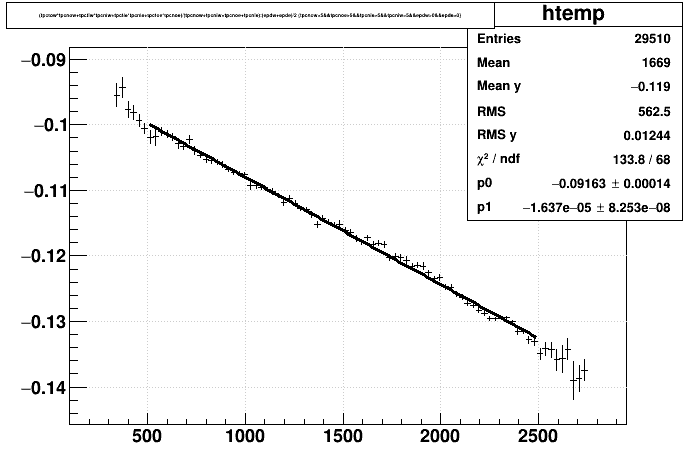
Next we take the profile plot and fit, as shown on the left below to arrive at the calibration numbers to use in the database:
-Gene
Run 20 AuAu9.2 EbyE T0 calibration
I looked at 4 runs spread across the three trigger setups (production_9p2GeV_2020, production_9p2GeV_2020b, and production_9p2GeV_2020c):
- st_physics_21038010_raw_3000003.daq
- st_physics_21041004_raw_1000002.daq
- st_physics_21080013_raw_1000002.daq (b)
- st_physics_21245006_raw_2500001.daq (c)
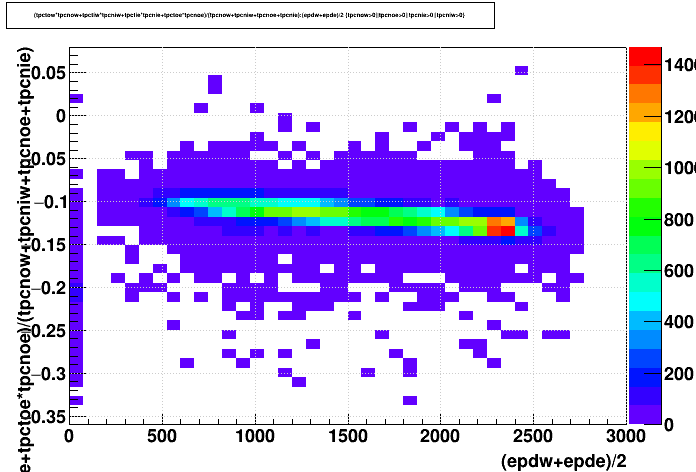
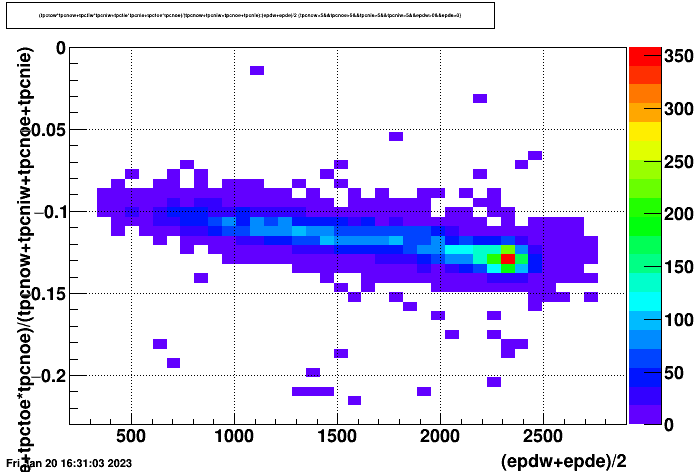
ebyeT0tree->Draw("(tpctow*tpcnow+tpctiw*tpcniw+tpctie*tpcnie+tpctoe*tpcnoe)/
(tpcnow+tpcniw+tpcnoe+tpcnie):(epdw+epde)/ 2",
"tpcnow>5&&tpcnoe>5&&tpcnie>5&&tpcniw>5&&epdw>0&&epde>0","prof");
Next we take the profile plot and fit, as shown on the left below to arrive at the calibration numbers to use in the database:
- constant = [Mean y] - [p0] = -0.119 - (-0.09163) = -0.02737
- slope = - [p1] = 1.637e-5
-Gene
»
- genevb's blog
- Login or register to post comments