- genevb's home page
- Posts
- 2025
- 2024
- 2023
- 2022
- September (1)
- 2021
- 2020
- 2019
- 2018
- 2017
- December (1)
- October (3)
- September (1)
- August (1)
- July (2)
- June (2)
- April (2)
- March (2)
- February (1)
- 2016
- November (2)
- September (1)
- August (2)
- July (1)
- June (2)
- May (2)
- April (1)
- March (5)
- February (2)
- January (1)
- 2015
- December (1)
- October (1)
- September (2)
- June (1)
- May (2)
- April (2)
- March (3)
- February (1)
- January (3)
- 2014
- 2013
- 2012
- 2011
- January (3)
- 2010
- February (4)
- 2009
- 2008
- 2005
- October (1)
- My blog
- Post new blog entry
- All blogs
Run 22 pp500 reconstruction slowdowns
Updated on Wed, 2023-09-27 10:47. Originally created by genevb on 2023-09-27 10:47.
I was interested to see whether there were clear reconstruction time differences between events with and without TPC for the FWD test productions that have been reconstructed recently. I extracted the event-wise reconstructionCPU times from the production logs from the two very similar test productions and plotted them versus the index of the events within their files and clearly saw the differences as seen here, but I was also quite surprised to find how much the reconstruction slows down as the jobs progress!
Left: st_physics files from the forwardCrossSection_2022 runs on days 61-62 (excluding jobs that I had to limit to only 20k total events to make sure they completed)
Right: st_fwd files from the production_pp500_2022 runs on days 63-64
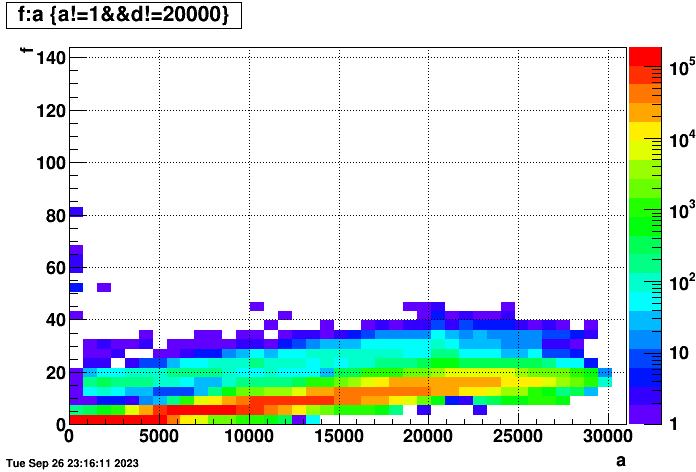
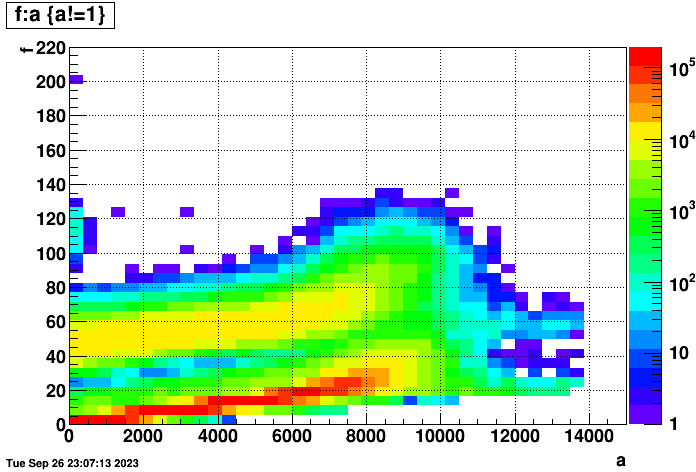
The forwardCrossSection_2022 files are a bit of a special case as they were taken with low luminosity and the trigger mix is a bit different. One can see two bands in that left plot for with and without TPC, but the standard production_pp500_2022 data from the right plot is a bit easier to continue to work with for this study...
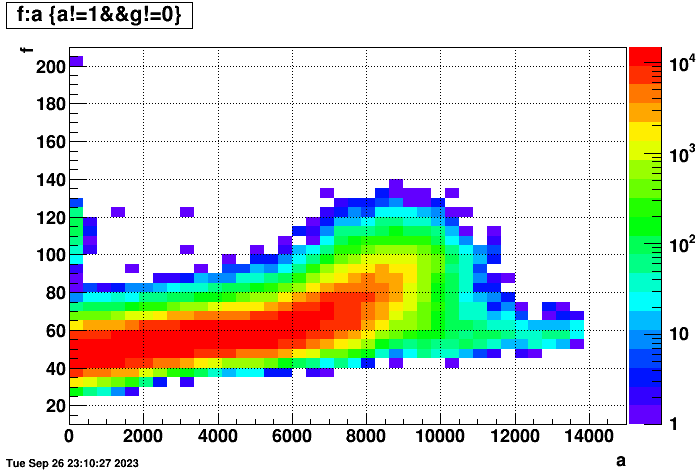
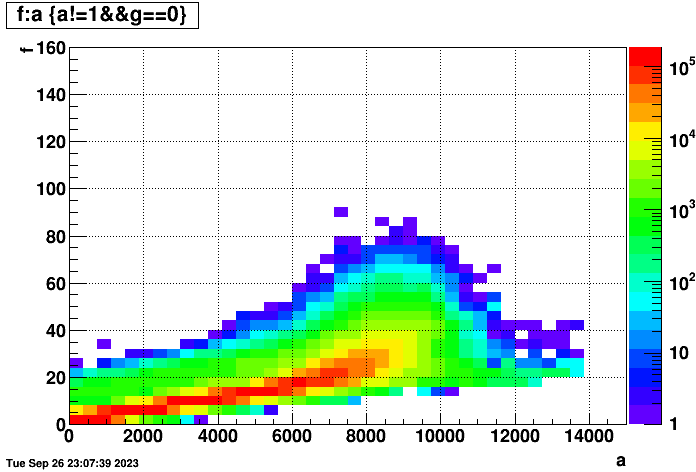
To make things even more clear, I managed to separate the right plot from above into events (left) with and (right) without TPC hits in the below two plots, clearly demonstrating that the two bands are from those two different kinds of events:
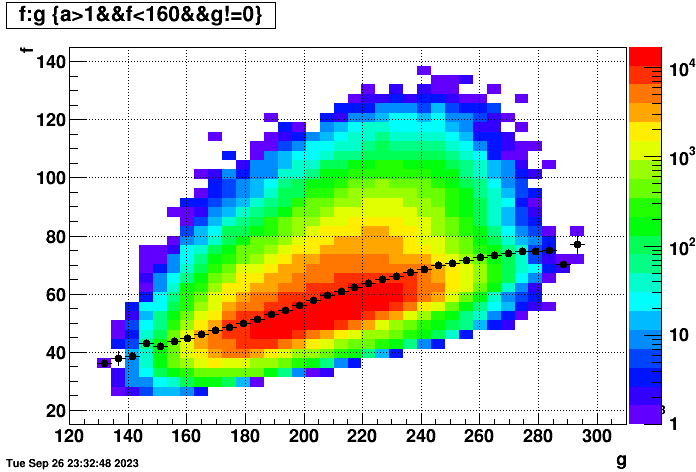
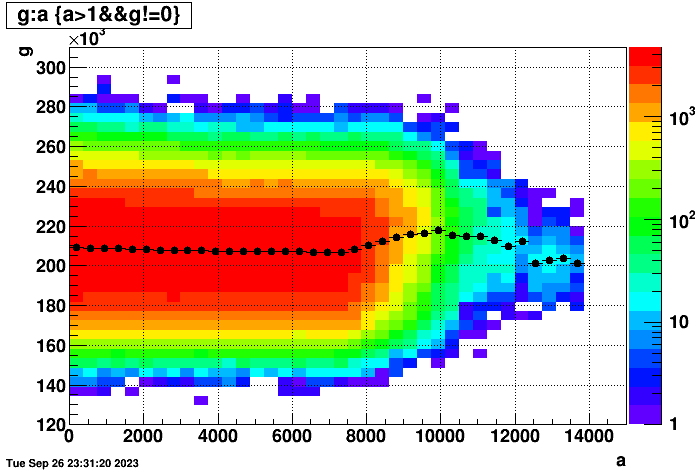
I also realized that the time to reconstruct an event is dependent on the number of hits in the event. So the following two plots show (left) time per event vs. number of TPC hits in the event (for those events with TPC hits), and (right) hits vs. event index in the files to show that there isn't some major cross-correlation to worry about (there does seem to be a small dependence, but not worth worrying about here):
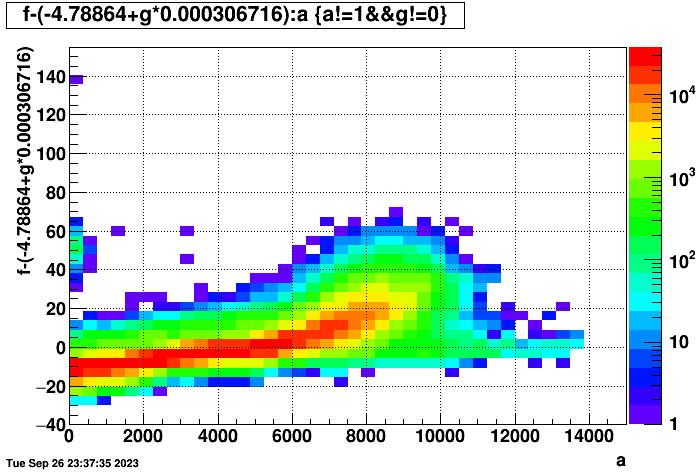
Fitting that linear dependence on the number of TPC hits and subtracting it from the time per event with TPC obtains this plot, which is considerably sharper, though the vertical offset has now inappropriately shifted too far down as the fit subtraction essentially brings the mean inappropriately to zero (i.e. I really should have only fit the hit dependence for the first few hundred events, and even then not subtracted off the intercept at zero hits).
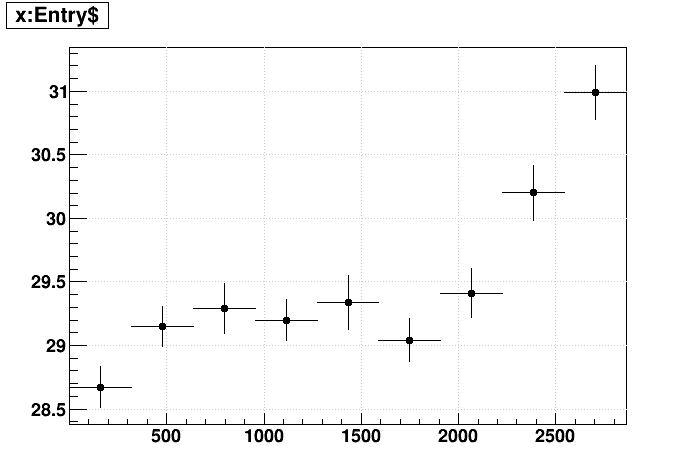
Getting back to the clear dependence on hit index, this appears to be a significant issue for production jobs. Of note, the slowdown appears to be similar in absolute time for events with and without the TPC, not in relative time (i.e. if the TPC events go from being ~40 sec/evt to ~80 sec/evt, the non-TPC events don't take twice as long also but instead go from ~1 sec/evt to ~40 sec/event, which is about 40 times slower per such event). Given that the st_fwd files are dominated by mostly non-TPC events, which means that they containy many more events than the standard st_physics files in which there are no FWD triggers (because the number of events in the files is inversely proportional to the size of the events, stuffing as many events as possible into the 5 GB DAQ file size limit for that year), the slowdown is actually more impactful on these st_fwd file reconstruction jobs.
Some further details can be found in two areas:
First, there is a clear band that protrudes out the right side of the plots of time-per-event vs. event index plots. I have isolated these to be from just a few scattered files for which there were an especially large number of non-TPC events. For these jobs, the rate of increase in time-per-event seems to rise more slowly because of that. It may imply that the slow-down is happening due to something in the TPC events, event though it impacts the reconstruction speed of both kinds of events.
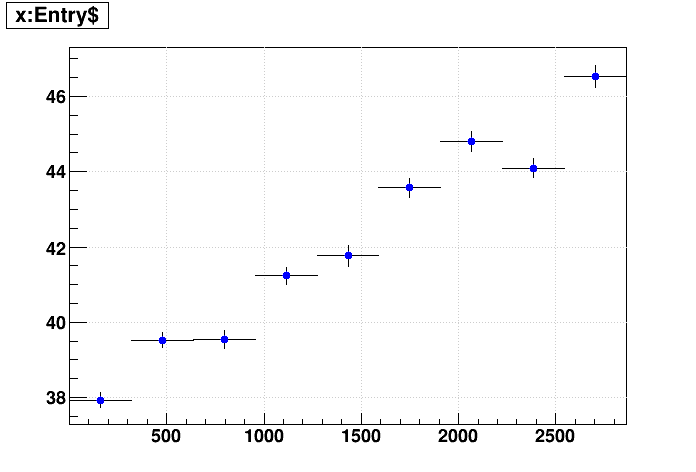
Second, I have reconstructed some standard st_physics files without FWD triggers. These files have fewer events because the events are themselves larger and fewer such events will fit into the 5 GB DAQ files. I looked at time per event vs. event index both in (left) 32-bit reconstruction and (right) 64-bit reconstruction as the above test productions were. Both show a noticeable slowdown. I do want to point out that the slowdown is not so evident from the first 1000 events, so it would not be noticeable from either the nightly jobs or the FastOffline jobs we ran during Run 22. So the slowdown is happening even without the FWD triggers, though I do have the FWD chain options turned on so that those makers are running in the chain.
I'm not sure what this means for the cause yet. Investigating memory leaks and turning on/off makers in the chain may be necessary to get to the bottom of it. I do believe it is important to resolve to keep our job reconstruction efficient on the farm, perhaps even critical to avoid the 3 day job duration limit on the standard CRS production queue into which we want to send the vast majority of our jobs.
-Gene
Left: st_physics files from the forwardCrossSection_2022 runs on days 61-62 (excluding jobs that I had to limit to only 20k total events to make sure they completed)
Right: st_fwd files from the production_pp500_2022 runs on days 63-64


The forwardCrossSection_2022 files are a bit of a special case as they were taken with low luminosity and the trigger mix is a bit different. One can see two bands in that left plot for with and without TPC, but the standard production_pp500_2022 data from the right plot is a bit easier to continue to work with for this study...
To make things even more clear, I managed to separate the right plot from above into events (left) with and (right) without TPC hits in the below two plots, clearly demonstrating that the two bands are from those two different kinds of events:


I also realized that the time to reconstruct an event is dependent on the number of hits in the event. So the following two plots show (left) time per event vs. number of TPC hits in the event (for those events with TPC hits), and (right) hits vs. event index in the files to show that there isn't some major cross-correlation to worry about (there does seem to be a small dependence, but not worth worrying about here):


Fitting that linear dependence on the number of TPC hits and subtracting it from the time per event with TPC obtains this plot, which is considerably sharper, though the vertical offset has now inappropriately shifted too far down as the fit subtraction essentially brings the mean inappropriately to zero (i.e. I really should have only fit the hit dependence for the first few hundred events, and even then not subtracted off the intercept at zero hits).

Getting back to the clear dependence on hit index, this appears to be a significant issue for production jobs. Of note, the slowdown appears to be similar in absolute time for events with and without the TPC, not in relative time (i.e. if the TPC events go from being ~40 sec/evt to ~80 sec/evt, the non-TPC events don't take twice as long also but instead go from ~1 sec/evt to ~40 sec/event, which is about 40 times slower per such event). Given that the st_fwd files are dominated by mostly non-TPC events, which means that they containy many more events than the standard st_physics files in which there are no FWD triggers (because the number of events in the files is inversely proportional to the size of the events, stuffing as many events as possible into the 5 GB DAQ file size limit for that year), the slowdown is actually more impactful on these st_fwd file reconstruction jobs.
Some further details can be found in two areas:
First, there is a clear band that protrudes out the right side of the plots of time-per-event vs. event index plots. I have isolated these to be from just a few scattered files for which there were an especially large number of non-TPC events. For these jobs, the rate of increase in time-per-event seems to rise more slowly because of that. It may imply that the slow-down is happening due to something in the TPC events, event though it impacts the reconstruction speed of both kinds of events.
Second, I have reconstructed some standard st_physics files without FWD triggers. These files have fewer events because the events are themselves larger and fewer such events will fit into the 5 GB DAQ files. I looked at time per event vs. event index both in (left) 32-bit reconstruction and (right) 64-bit reconstruction as the above test productions were. Both show a noticeable slowdown. I do want to point out that the slowdown is not so evident from the first 1000 events, so it would not be noticeable from either the nightly jobs or the FastOffline jobs we ran during Run 22. So the slowdown is happening even without the FWD triggers, though I do have the FWD chain options turned on so that those makers are running in the chain.


I'm not sure what this means for the cause yet. Investigating memory leaks and turning on/off makers in the chain may be necessary to get to the bottom of it. I do believe it is important to resolve to keep our job reconstruction efficient on the farm, perhaps even critical to avoid the 3 day job duration limit on the standard CRS production queue into which we want to send the vast majority of our jobs.
-Gene
»
- genevb's blog
- Login or register to post comments
