- genevb's home page
- Posts
- 2025
- 2024
- 2023
- 2022
- September (1)
- 2021
- 2020
- 2019
- December (1)
- October (4)
- September (2)
- August (6)
- July (1)
- June (2)
- May (4)
- April (2)
- March (3)
- February (3)
- 2018
- 2017
- December (1)
- October (3)
- September (1)
- August (1)
- July (2)
- June (2)
- April (2)
- March (2)
- February (1)
- 2016
- November (2)
- September (1)
- August (2)
- July (1)
- June (2)
- May (2)
- April (1)
- March (5)
- February (2)
- January (1)
- 2015
- December (1)
- October (1)
- September (2)
- June (1)
- May (2)
- April (2)
- March (3)
- February (1)
- January (3)
- 2014
- December (2)
- October (2)
- September (2)
- August (3)
- July (2)
- June (2)
- May (2)
- April (9)
- March (2)
- February (2)
- January (1)
- 2013
- December (5)
- October (3)
- September (3)
- August (1)
- July (1)
- May (4)
- April (4)
- March (7)
- February (1)
- January (2)
- 2012
- December (2)
- November (6)
- October (2)
- September (3)
- August (7)
- July (2)
- June (1)
- May (3)
- April (1)
- March (2)
- February (1)
- 2011
- November (1)
- October (1)
- September (4)
- August (2)
- July (4)
- June (3)
- May (4)
- April (9)
- March (5)
- February (6)
- January (3)
- 2010
- December (3)
- November (6)
- October (3)
- September (1)
- August (5)
- July (1)
- June (4)
- May (1)
- April (2)
- March (2)
- February (4)
- January (2)
- 2009
- November (1)
- October (2)
- September (6)
- August (4)
- July (4)
- June (3)
- May (5)
- April (5)
- March (3)
- February (1)
- 2008
- 2005
- October (1)
- My blog
- Post new blog entry
- All blogs
Run 23 blue beam background track investigation
Updated on Thu, 2023-06-08 15:41. Originally created by genevb on 2023-06-08 15:32.
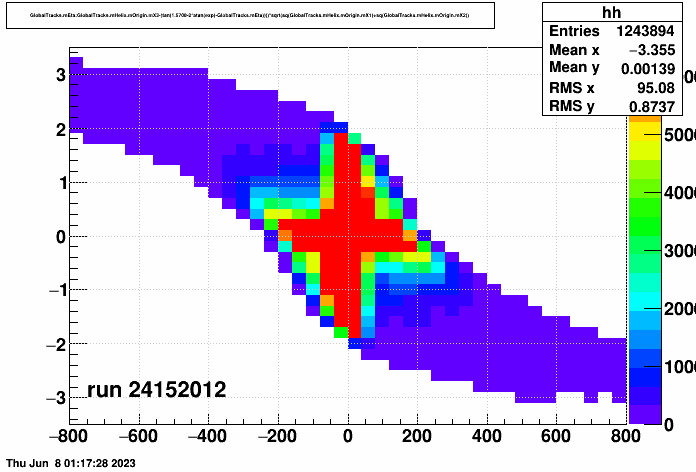
Using a simplistic projection of global tracks to their z location at the beam axis (ignoring both curvature of the tracks and whether they even point at the beamline):
zprojection = zfirst point - radiusfirst point * (pZ/pT)
...I get the following as example plots using 1000 events each (from FastOffline) for a couple recent runs of pseudorapidity (η) vs. zprojection [cm]. The acceptance of the STAR TPC carves out the backwards "s" shape, and the prominent red "+" in the middle is the result of AuAu beam-beam collision tracks, from triggered as well as pile-up events, along with the fact that I set the displayed histogram maximum at 20% of its actual maximum to bring into view less prominent features. Those pile-up AuAu events get spread along the z axis (the horizontal bar of the "+"), and also double up for a window of a couple bins around z=0 (the vertical bar of the "+") because we retain post-crossing tracks (i.e. we record the TPC past its full drift time).
In addition to those features from AuAu collisions, some runs show a notable feature at η near +2 and z near -400 cm. This is likely to be the location of the flange where the beampipe narrows from 5" diameter down to 3" diameter (I'm told at z=±400.2 cm). A similar feature was seen on the opposite side in Run 21 dAu200 data during a period when the beams were given a crossing angle at STAR (see this post). Here, the feature is likely to be explained as blue beam-associated particles (e.g. halo) colliding with this flange, also while operating with a crossing angle.
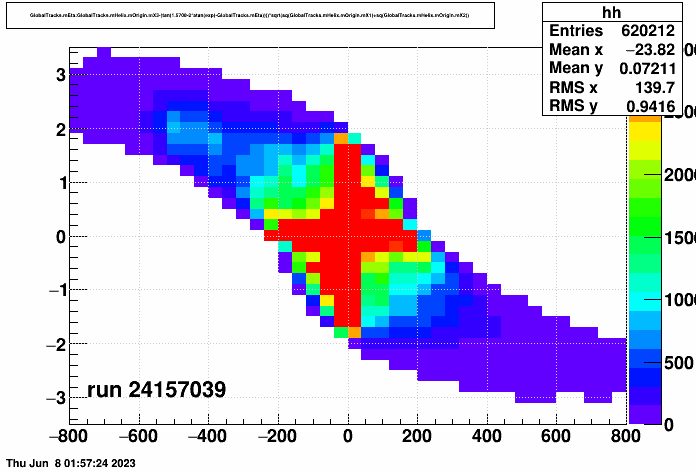
Here is the same plot for a special run taken with triggering shifted to catch earlier hits:
These plots clearly demonstrate that a background is seen in the tracks reconstructed in the STAR TPC.
______________
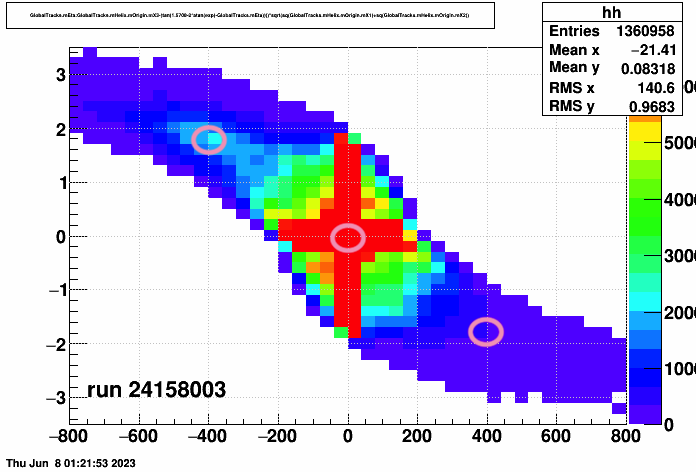
To see whether there are clear correlations of this background with counts in STAR's RICH scalers, I attempted to quantify the presence of this background by counting a couple histogram bin contents at the three locations shown in pink circles on the plot above for run 24158003. The upper left circle I will denote as counteast, the middle as countcenter, and the lower right as countwest. The below two plots now show some normalized measures of the background tracks and background rate scalers with the following colored data points:
The left plot use the BBC for the coincidences, and the right plot uses the ZDC for the coincidences. Only runs for days 153-158 are used in these plots because (1) some runs prior to this had some missing scalers, and (2) there seems to have been different behavior patterns for earlier runs and it is unknown to me what exactly may have changed.
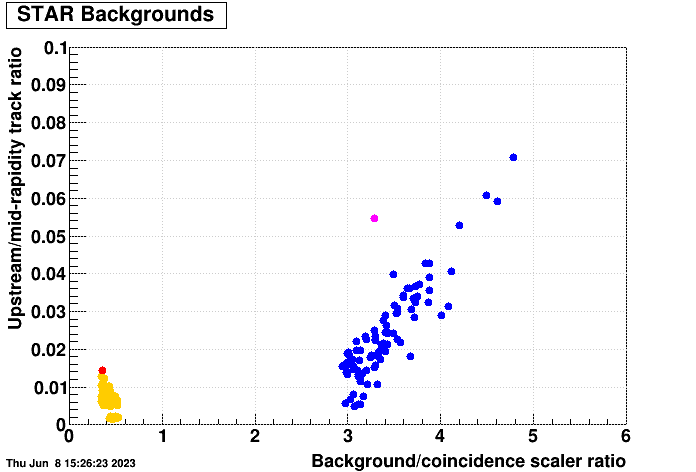
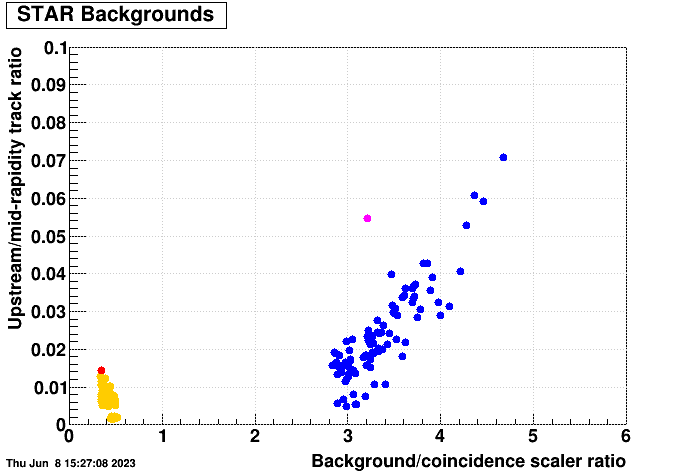
These plots demonstrate that the degree of tracks coming from the east-side beampipe flange is generally captured, apart from an offset from zero, by the BBC blue beam background rate scaler. The plots also obviate that the west-side flange is not producing many tracks, and that lack of contribution is also reflected in seeing very little in the yellow beam background rate scaler.
Further, run 24157039 is clearly an outlier, showing much more background from the blue beam at the flange for the same rate scaler ratio as other runs. It also has the highest yellow beam background, but only barely so.
-Gene
zprojection = zfirst point - radiusfirst point * (pZ/pT)
...I get the following as example plots using 1000 events each (from FastOffline) for a couple recent runs of pseudorapidity (η) vs. zprojection [cm]. The acceptance of the STAR TPC carves out the backwards "s" shape, and the prominent red "+" in the middle is the result of AuAu beam-beam collision tracks, from triggered as well as pile-up events, along with the fact that I set the displayed histogram maximum at 20% of its actual maximum to bring into view less prominent features. Those pile-up AuAu events get spread along the z axis (the horizontal bar of the "+"), and also double up for a window of a couple bins around z=0 (the vertical bar of the "+") because we retain post-crossing tracks (i.e. we record the TPC past its full drift time).
In addition to those features from AuAu collisions, some runs show a notable feature at η near +2 and z near -400 cm. This is likely to be the location of the flange where the beampipe narrows from 5" diameter down to 3" diameter (I'm told at z=±400.2 cm). A similar feature was seen on the opposite side in Run 21 dAu200 data during a period when the beams were given a crossing angle at STAR (see this post). Here, the feature is likely to be explained as blue beam-associated particles (e.g. halo) colliding with this flange, also while operating with a crossing angle.
Here is the same plot for a special run taken with triggering shifted to catch earlier hits:
These plots clearly demonstrate that a background is seen in the tracks reconstructed in the STAR TPC.
______________
To see whether there are clear correlations of this background with counts in STAR's RICH scalers, I attempted to quantify the presence of this background by counting a couple histogram bin contents at the three locations shown in pink circles on the plot above for run 24158003. The upper left circle I will denote as counteast, the middle as countcenter, and the lower right as countwest. The below two plots now show some normalized measures of the background tracks and background rate scalers with the following colored data points:
- Blue: (counteast / countcenter) vs. (rateblue beam background / ratecoincidence)
- Yellow: (countwest / countcenter) vs. (rateyellow beam background / ratecoincidence)
- Magenta: same as blue, run 24157039
- Red: same as yellow, run 23157039
The left plot use the BBC for the coincidences, and the right plot uses the ZDC for the coincidences. Only runs for days 153-158 are used in these plots because (1) some runs prior to this had some missing scalers, and (2) there seems to have been different behavior patterns for earlier runs and it is unknown to me what exactly may have changed.
These plots demonstrate that the degree of tracks coming from the east-side beampipe flange is generally captured, apart from an offset from zero, by the BBC blue beam background rate scaler. The plots also obviate that the west-side flange is not producing many tracks, and that lack of contribution is also reflected in seeing very little in the yellow beam background rate scaler.
Further, run 24157039 is clearly an outlier, showing much more background from the blue beam at the flange for the same rate scaler ratio as other runs. It also has the highest yellow beam background, but only barely so.
-Gene
»
- genevb's blog
- Login or register to post comments