Track breaking at TPC CM in FXT
Updated on Tue, 2024-05-28 21:43. Originally created by genevb on 2024-05-28 20:43.
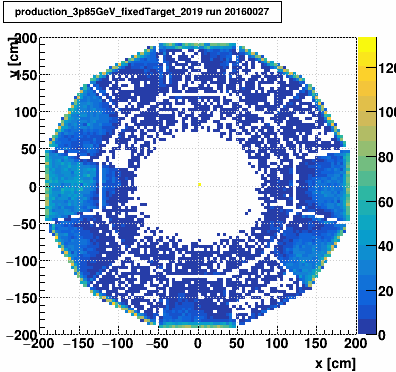
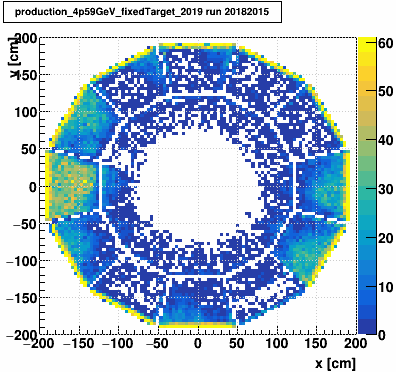
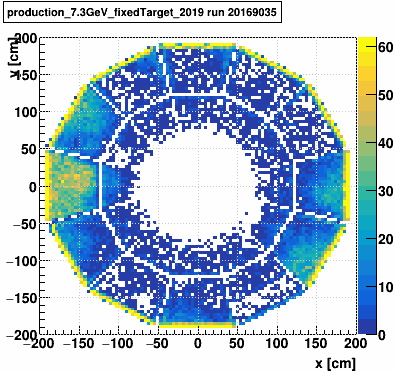
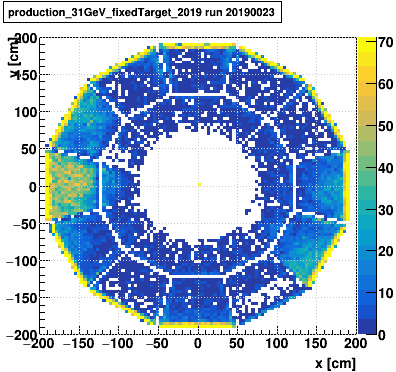
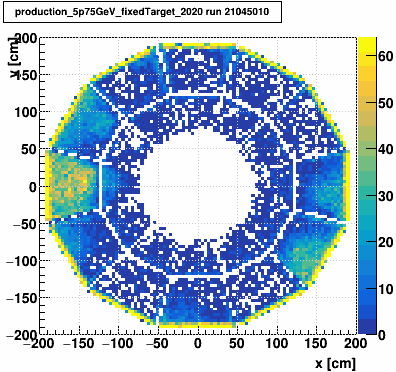
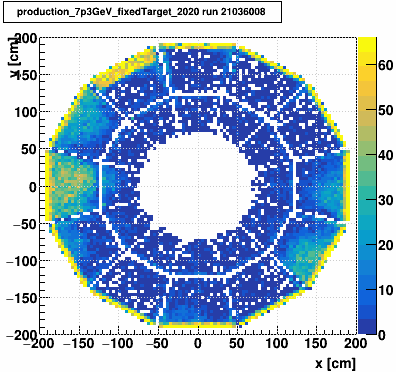
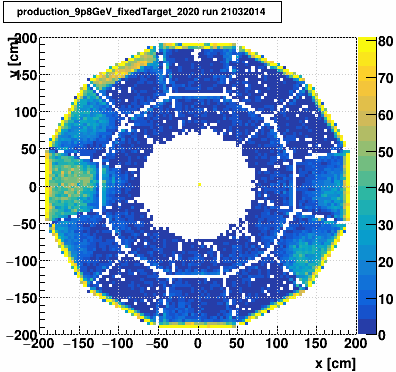
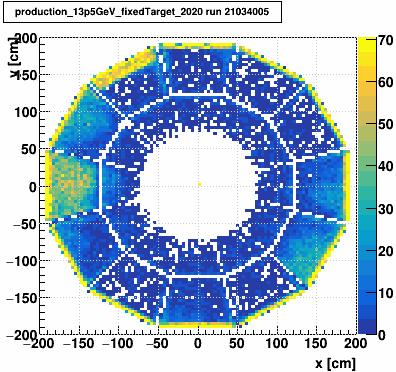
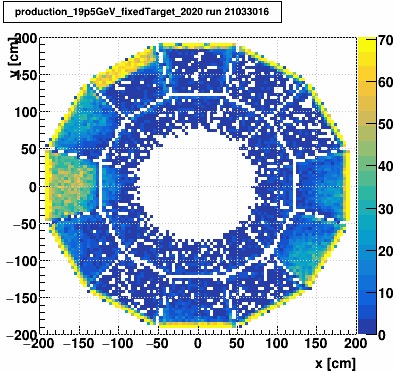
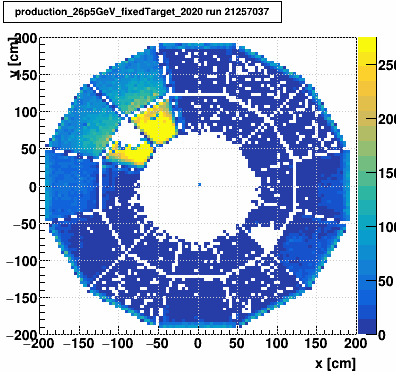
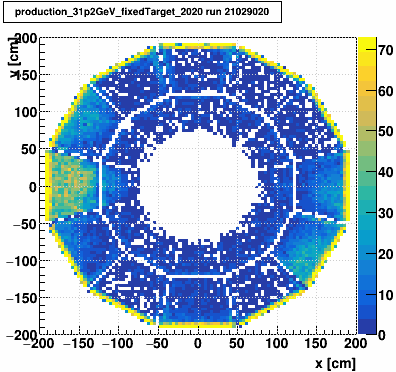
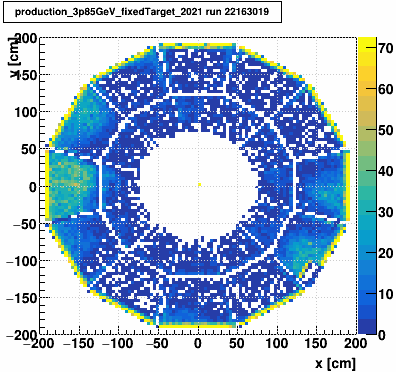
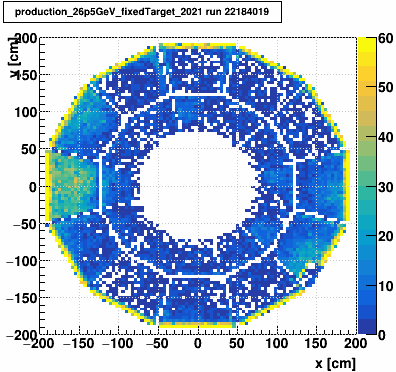
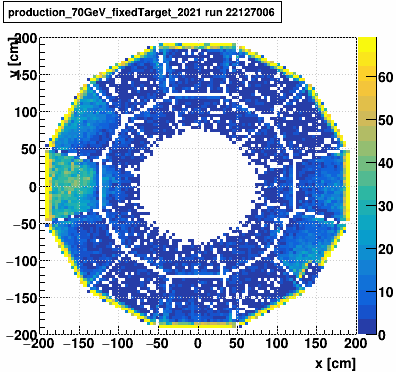
Following the presentation from Mathias at last week's TPC meeting (see slide 10 here), I made some very simple plots from a pair of random runs from each of the 2019-2021 FXT datasets (32 runs from 16 datasets) of last point y vs. x of primary tracks when that point is close to the central membrane west side, z = [-1,+7] cm, using just 20k-30k events from MuDsts:
Clearly what Mathias has shown is indeed a repeatable pattern throughout all of these FXT datasets, hinting at something static in the TPC such as alignment.
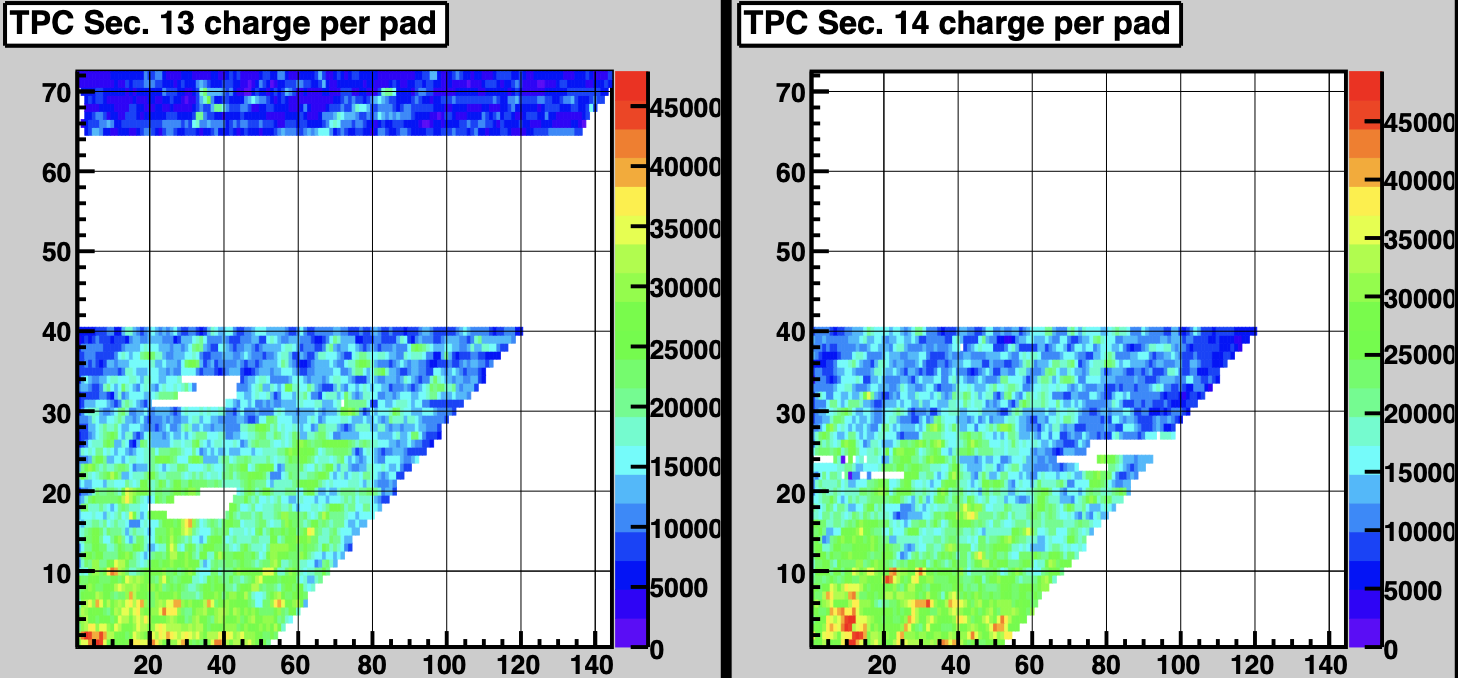
Note that the 26p5 GeV dataset from 2020 suffered from outages of nearly all of the outer RDOs on sectors 13 and 14 (see plots below), causing a very large number of tracks to terminate in the inner sectors at 10 o'clock and 11 o'clock in phi, but the general behavior that is seen in other sectors can still be seen lurking underneath that artifact.
-Gene
MuDst.Draw("PrimaryTracks.mLastPoint.mX2:PrimaryTracks.mLastPoint.mX1>>hh(100,-200,200,100,-200,200)",
  "abs(PrimaryTracks.mLastPoint.mX3-3)<4","zcol");
Here are the results, where I have also reduced the histogram maximum by half to suppress the domination of tracks that end at the outer perimeter of the TPC:| dataset | random run A | random run B |
|---|---|---|
| production_3p85GeV_fixedTarget_2019 | 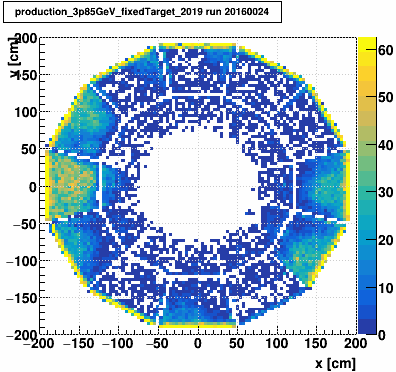 |
 |
| production_4p59GeV_fixedTarget_2019 | 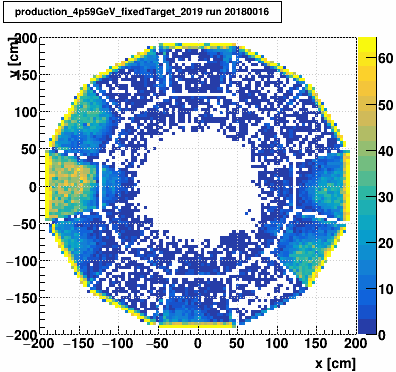 |
 |
| production_7.3GeV_fixedTarget_2019 | 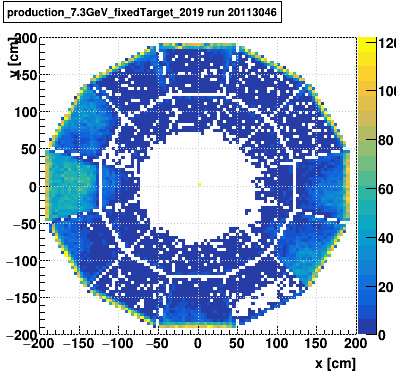 |
 |
| production_31GeV_fixedTarget_2019 | 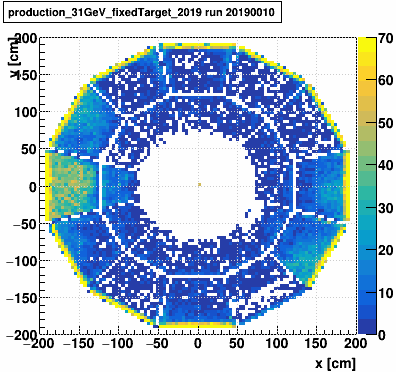 |
 |
| production_5p75GeV_fixedTarget_2020 | 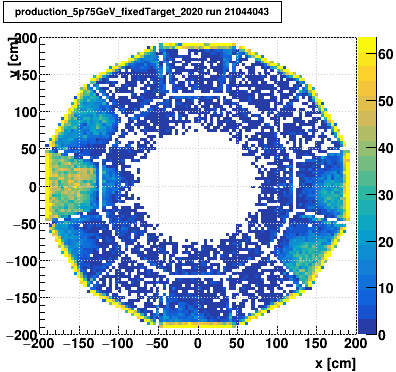 |
 |
| production_7p3GeV_fixedTarget_2020 | 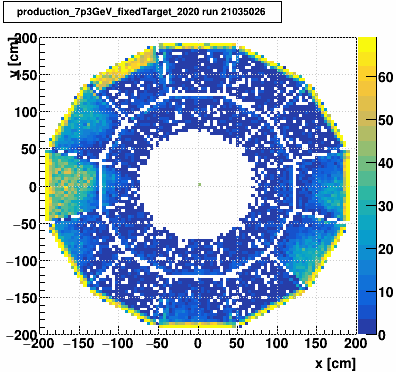 |
 |
| production_9p8GeV_fixedTarget_2020 | 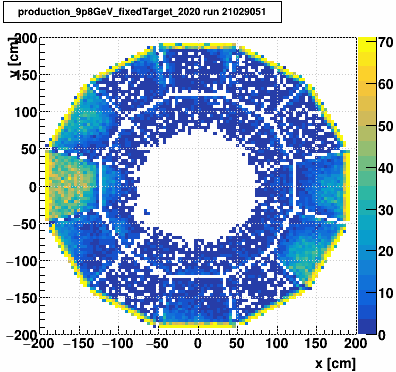 |
 |
| production_13p5GeV_fixedTarget_2020 | 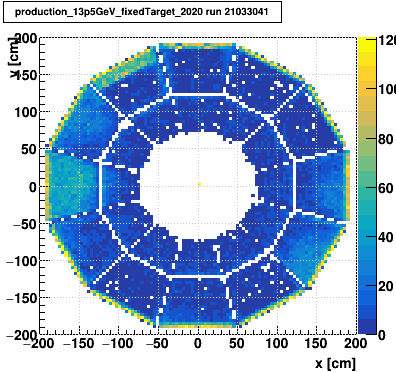 |
 |
| production_19p5GeV_fixedTarget_2020 | 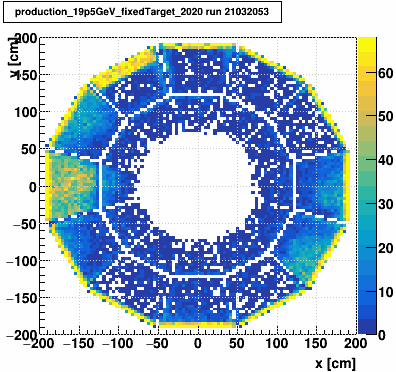 |
 |
| production_26p5GeV_fixedTarget_2020 | 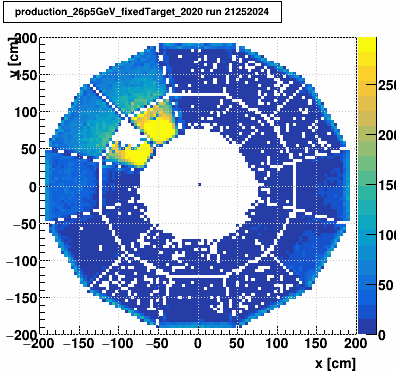 |
 |
| production_31p2GeV_fixedTarget_2020 | 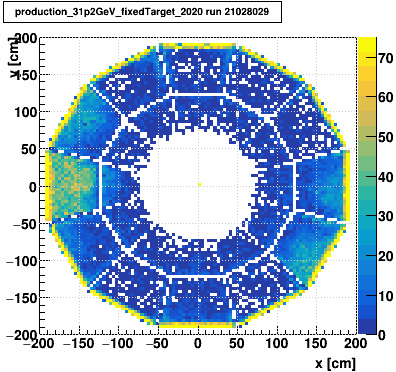 |
 |
| production_3p85GeV_fixedTarget_2021 | 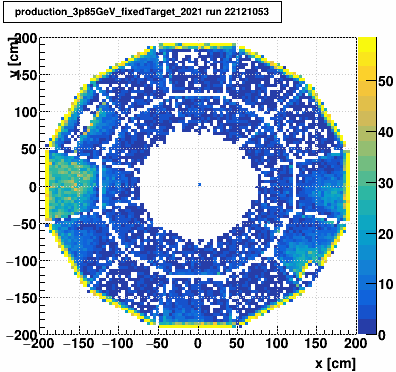 |
 |
| production_26p5GeV_fixedTarget_2021 | 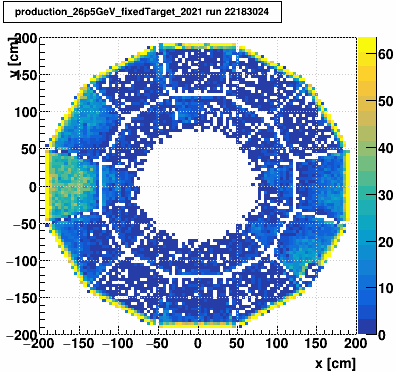 |
 |
| production_44p5GeV_fixedTarget_2021 | 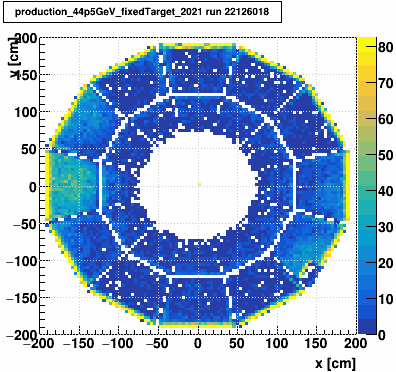 |
 |
| production_70GeV_fixedTarget_2021 | 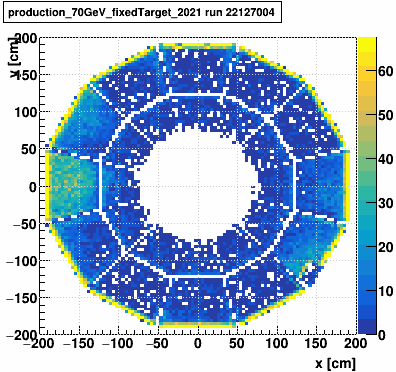 |
 |
| production_100GeV_fixedTarget_2021 | 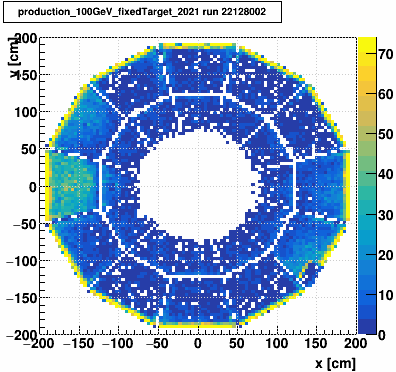 |
 |
Clearly what Mathias has shown is indeed a repeatable pattern throughout all of these FXT datasets, hinting at something static in the TPC such as alignment.
Note that the 26p5 GeV dataset from 2020 suffered from outages of nearly all of the outer RDOs on sectors 13 and 14 (see plots below), causing a very large number of tracks to terminate in the inner sectors at 10 o'clock and 11 o'clock in phi, but the general behavior that is seen in other sectors can still be seen lurking underneath that artifact.
-Gene
»
- genevb's blog
- Login or register to post comments