- genevb's home page
- Posts
- 2025
- 2024
- 2023
- 2022
- September (1)
- 2021
- 2020
- 2019
- 2018
- 2017
- December (1)
- October (3)
- September (1)
- August (1)
- July (2)
- June (2)
- April (2)
- March (2)
- February (1)
- 2016
- November (2)
- September (1)
- August (2)
- July (1)
- June (2)
- May (2)
- April (1)
- March (5)
- February (2)
- January (1)
- 2015
- December (1)
- October (1)
- September (2)
- June (1)
- May (2)
- April (2)
- March (3)
- February (1)
- January (3)
- 2014
- 2013
- 2012
- 2011
- January (3)
- 2010
- February (4)
- 2009
- 2008
- 2005
- October (1)
- My blog
- Post new blog entry
- All blogs
Effects of removing hitless TPC StiKalmanTrackNodes
Updated on Sat, 2019-04-13 23:37. Originally created by genevb on 2019-04-12 13:08.
As a solution to RT#3388, we have considered removing the code in StKalmanTrack::initialize0() which adds StiKalmanTrackNodes to the track for detector layers between the StiHits on the track seed passed from CA. In addition to resolving that issue, this has the consequence of removing nodes for hitless TPC layers in all years' data, which has some impact on the tracking propagation through the TPC as the track momentum is not updated for energy loss at intermediate nodes between hits. This opens the question of whether this impact is negligible or not.
Focusing on data other than Run 18, here I show two studies. The first is a track-by-track comparison of global track characteristics with and without the patch. The second is an event-by-event comparison of track counts and vertex positions with and without the patch.
-Gene
________________________
I looked at 1000 events from Run 2017 AuAu54, with about 267k global tracks, of which ~100 tracks are reconstructed with the patch that aren't without the patch, and similarly the other way as well. While many of these have few hits, they extend up to 40 hit tracks.
Curiously, 4 tracks which have 45 hits in both passes (and therefore should be unaffected by the patch) have a differences that should up in their reconstructed pT, but only at the level of ~0.02%, which is almost certainly negligible in that it's far, far below our momentum resolution.
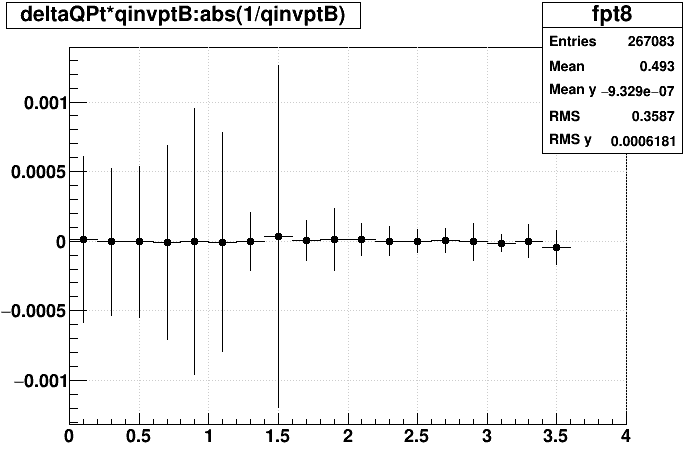
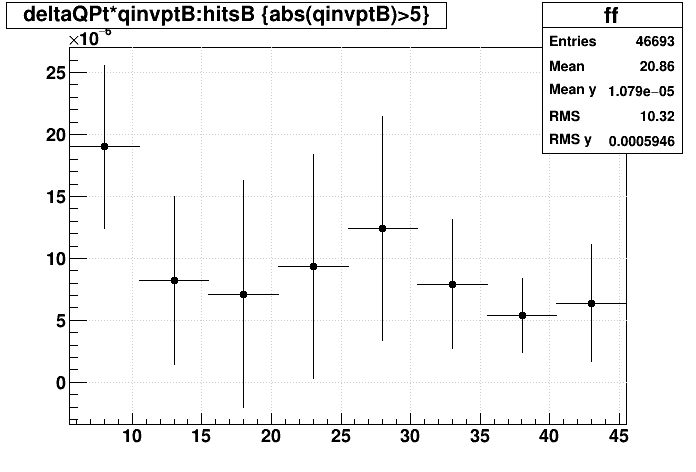
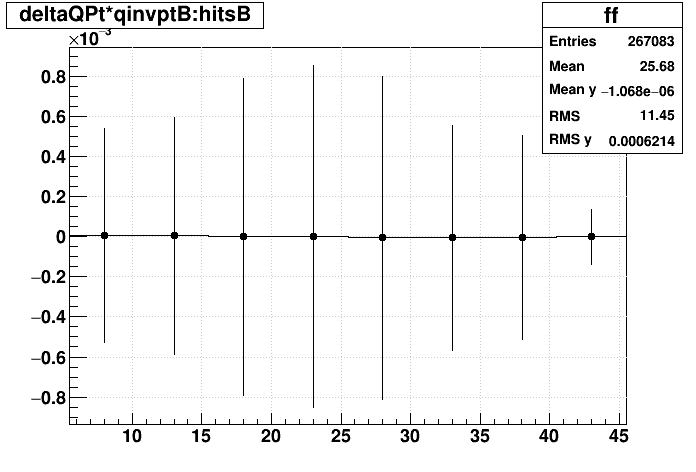
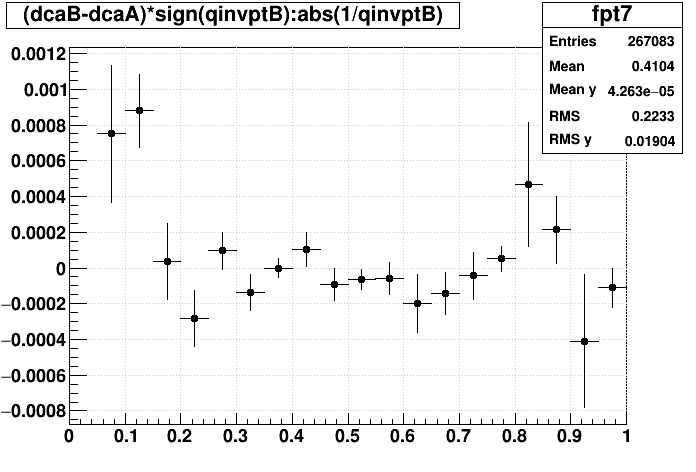
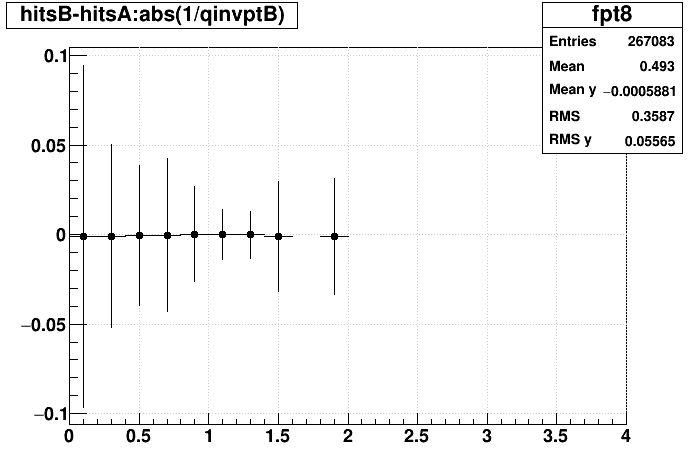
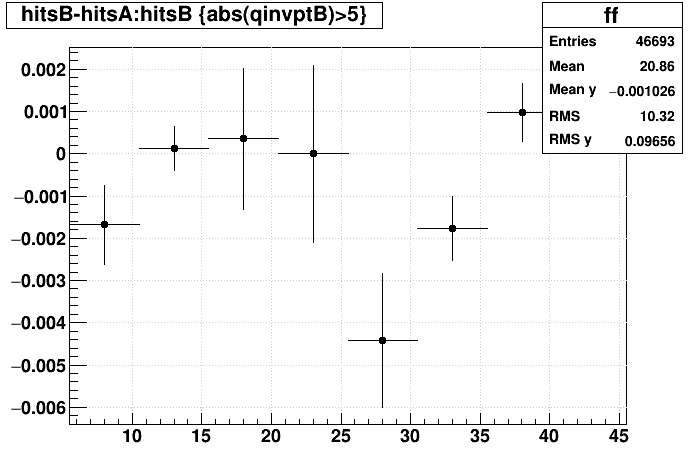
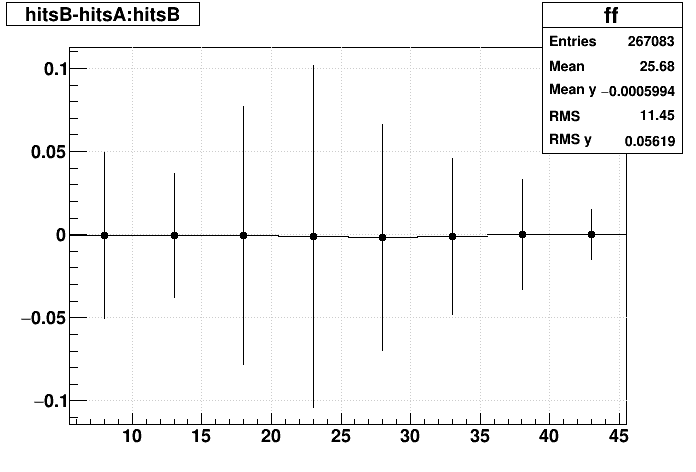
Below are plots of track differences for a few quantities, and here are some summarizing statements:
There appears to be some low pT biases, but they are small, at the level of ~2 x 10⁻⁵ for Δ(pT)/pT, ~8 μm for DCA, and ~0.001 for NHits.
The standard deviations of the differences appear to be on the order of ~6 x 10⁻⁴ for Δ(pT)/pT, ~200 μm for DCA, and ~0.05 for NHits.
_____________________________________
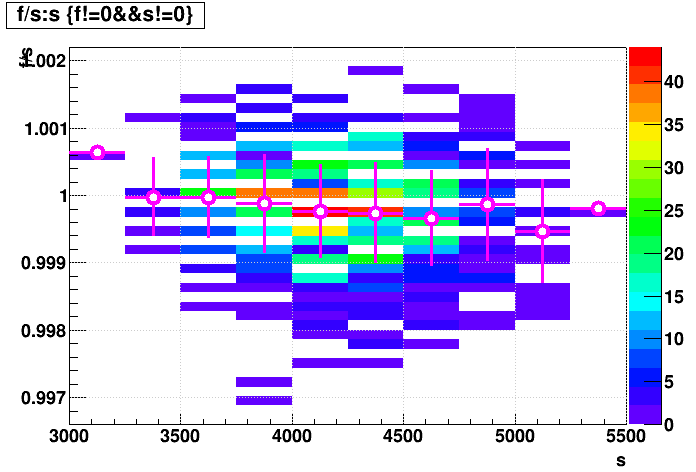
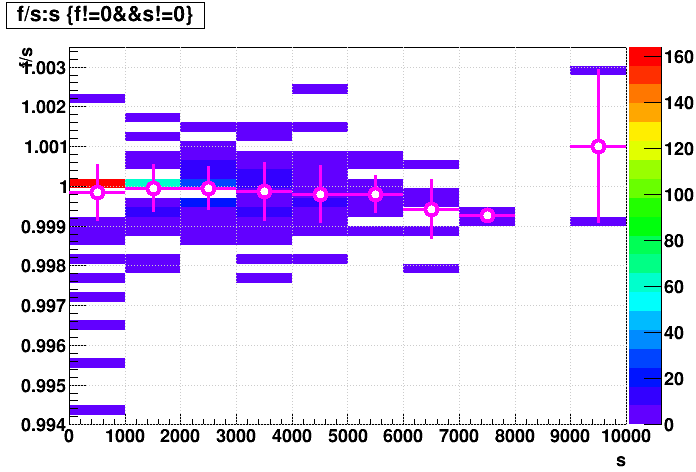
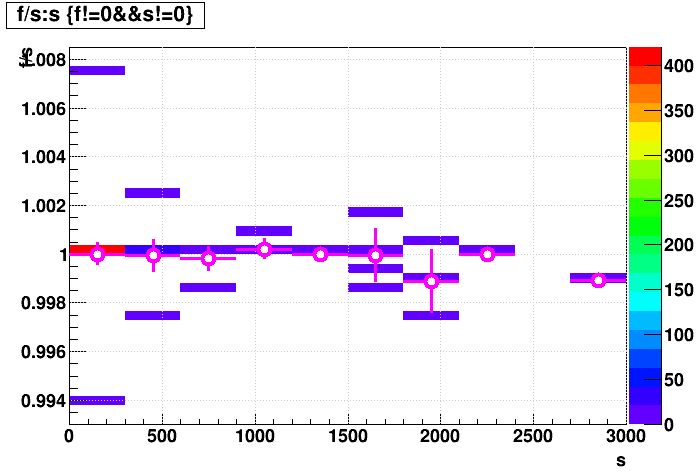
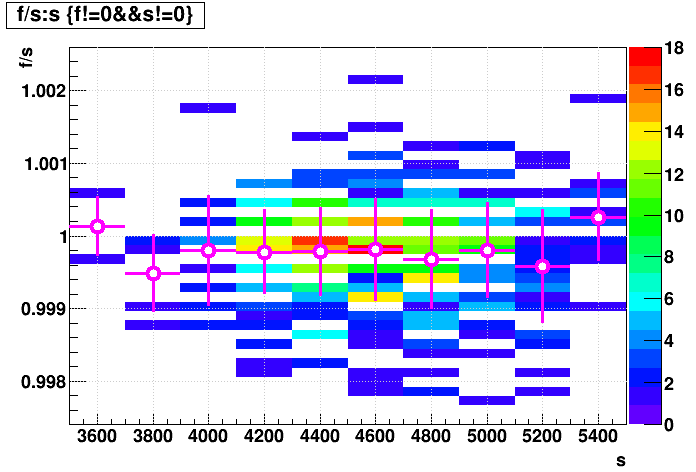
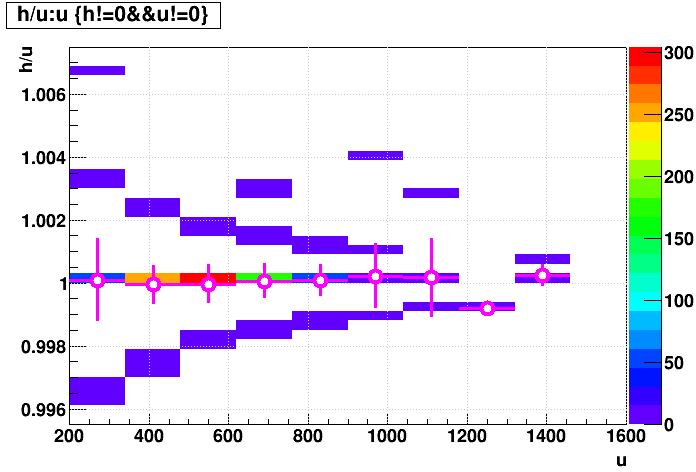
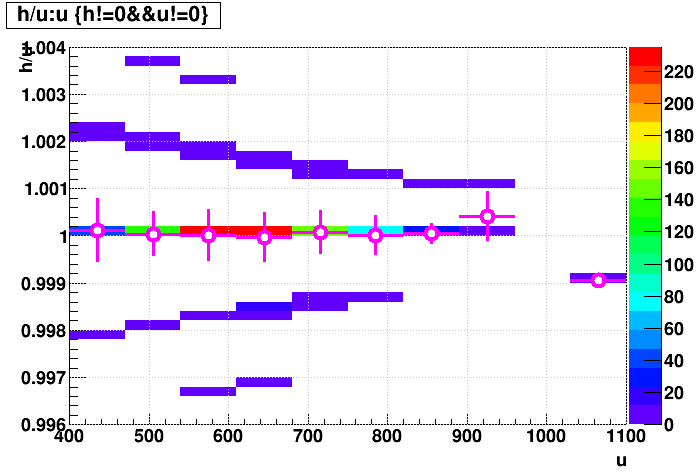
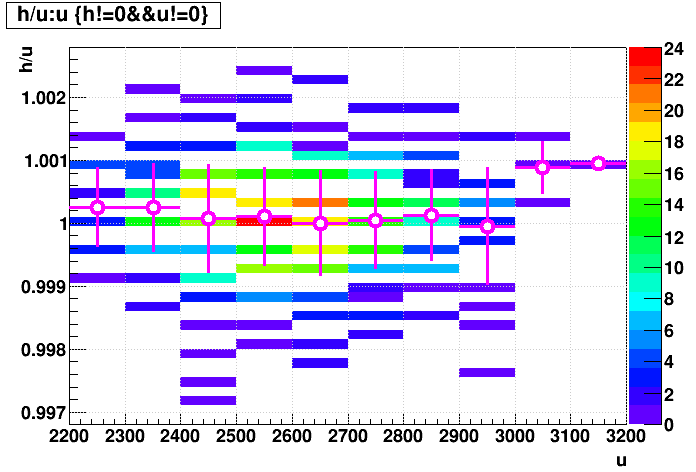
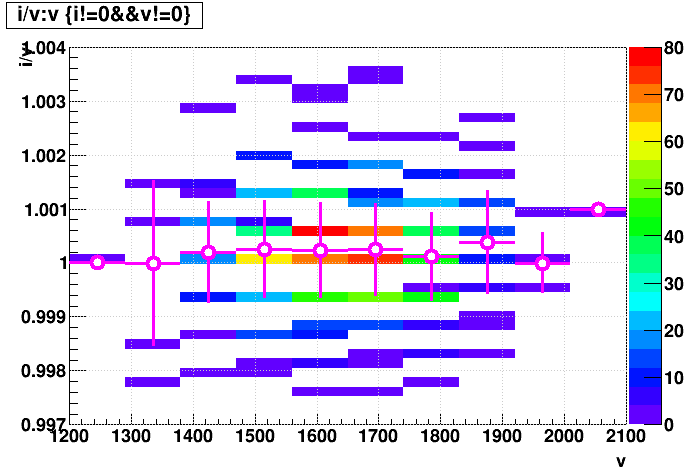
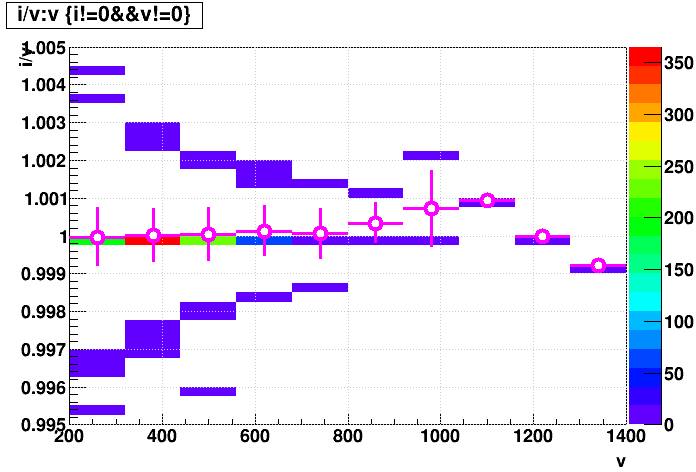
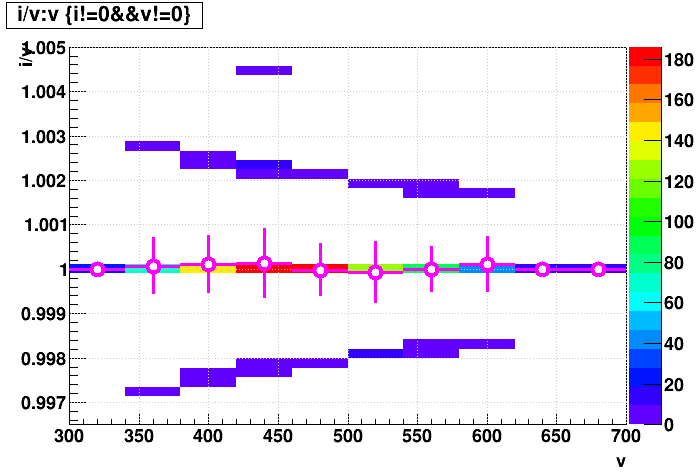
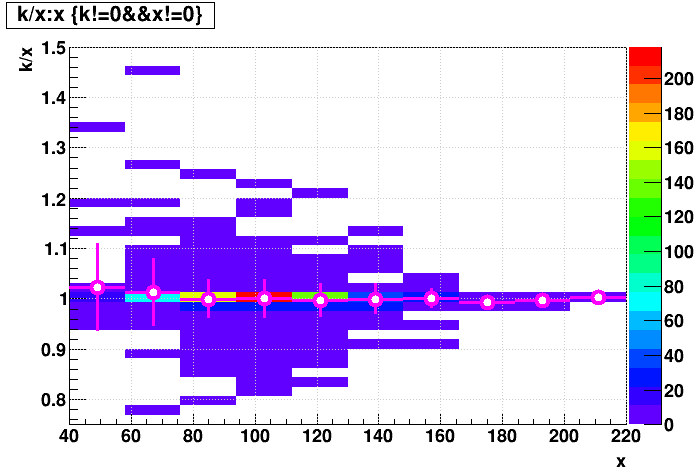
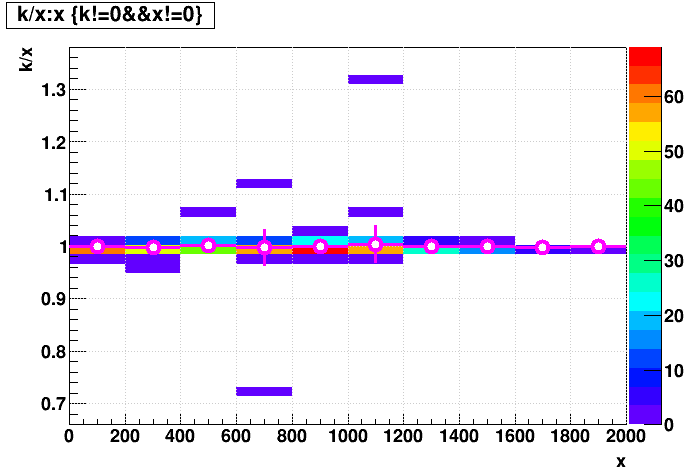
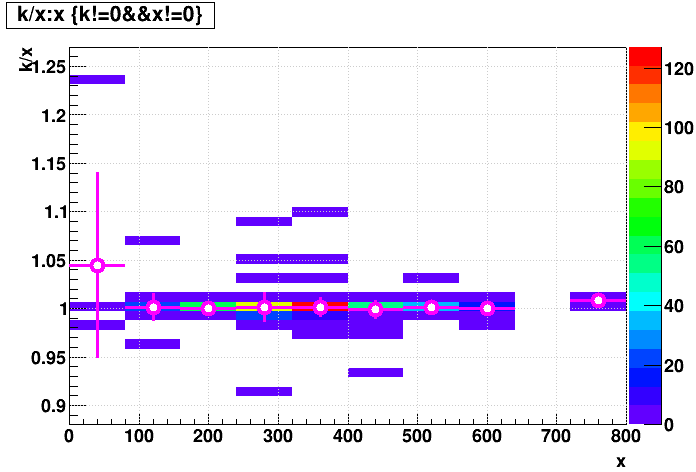
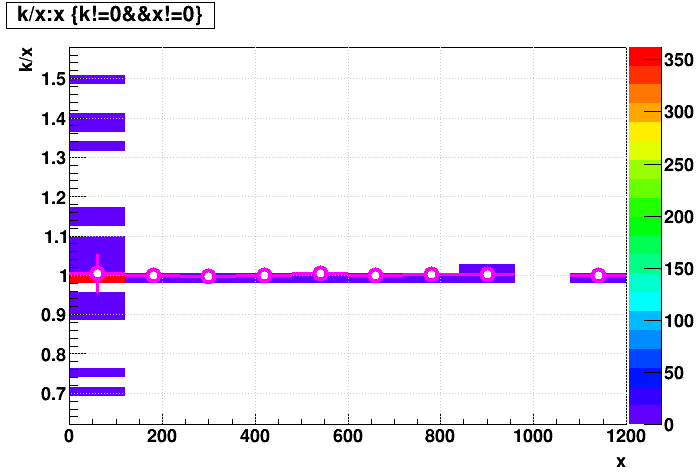
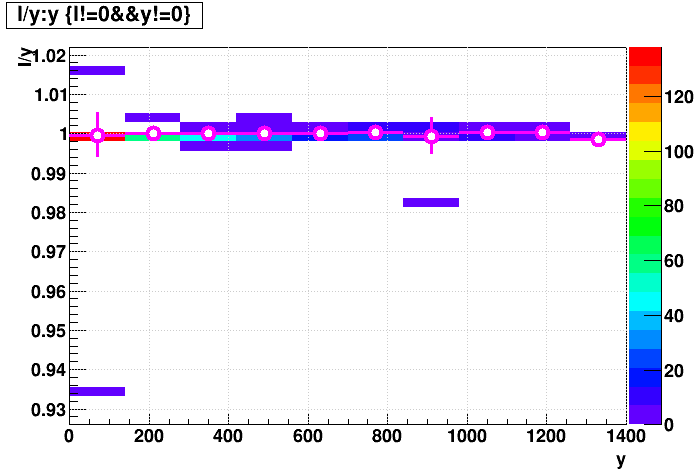
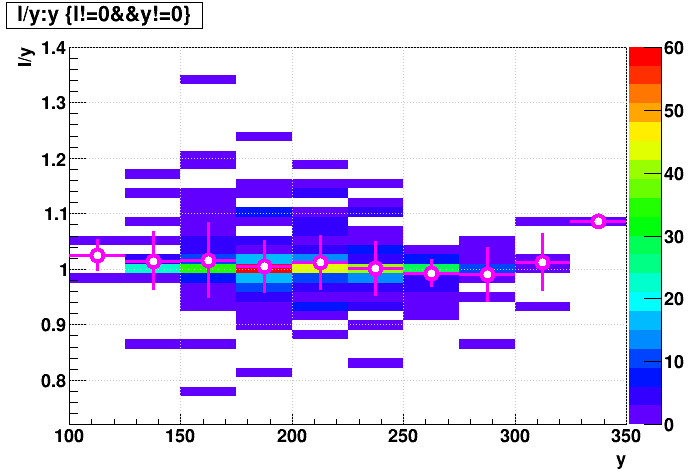
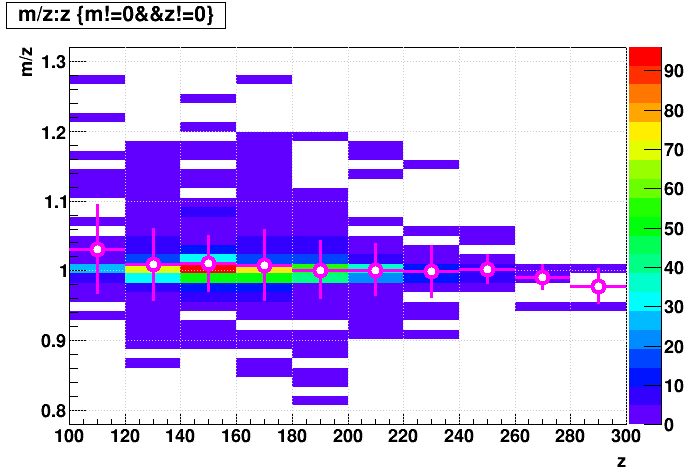
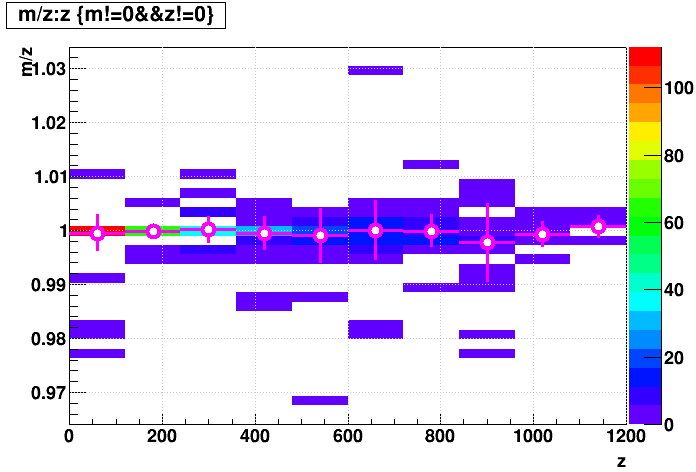
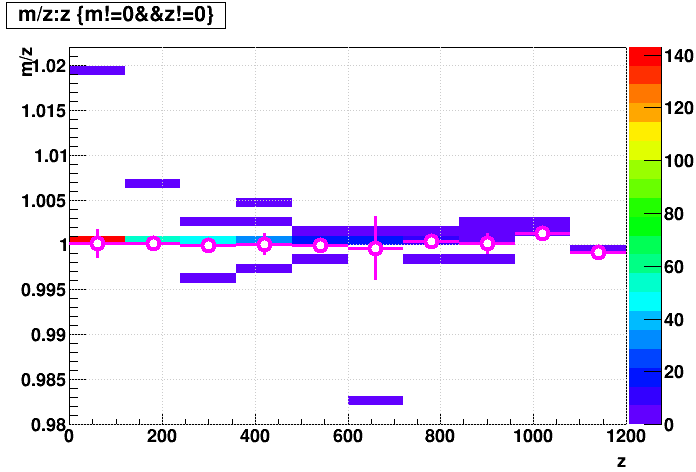
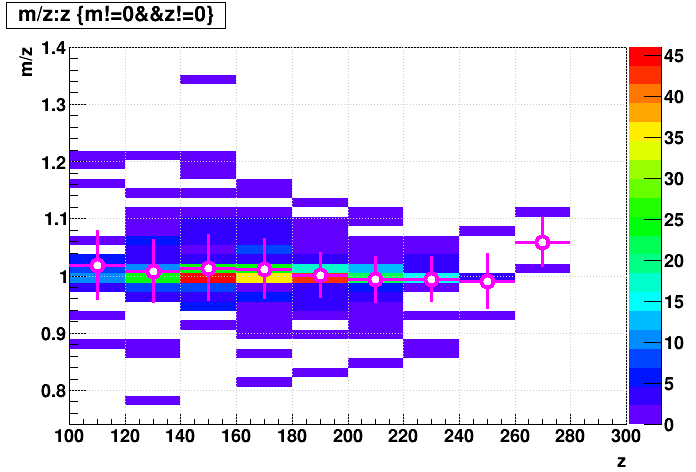
I ran the complete StiCA nightly tests (9 of them) for data from Runs 13-17, and parsed the logs for numbers regarding how many tracks were found. Here are some plots that show some of the differences. I plot the quantities as their difference divided by their magnitude in a zcol plot, with a profs plot overlaid in magenta to characterize the mean and deviation of the data. It's a bit much to digest, so I will state clearly what I see in summary:
Global tracks have no clear biases, with mean differences on the order of ~0.01%, and standard deviations on the order of ~0.1%.
Primary tracks have no clear biases, with mean differences on the order of ~0.1%, and standard deviations on the order of ~1% for AA and pA data, and ~5% for pp data.
I have further looked at the difference in primary vertex positions...
In pp data, we use a beamline constraint, so the vertices don't shift much in x,y for a shift in z (only whatever the slope of the beamline dictates, and that is always a few orders of magnitude less than 1). Here are the means and RMS of the vertex z position shifts in beamline-constrained data due to the patch, along with the percentage of events whose highest-ranked primary vertex changed to a different vertex (as defined by |Δ(Vz)| > 1 cm).
In pA and AA data, without a beamline constraint, the vertices can move in all three dimensions. Here are the z-shift mean and RMS, transverse-shift mean and RMS, and percentage of events with changed highest-ranked primary vertices.
The * denotes that 1 of the 4 pp datasets, and 4 of the 5 pA & AA datasets used HFT in tracking, but it doesn't appear to be that its inclusion has much of an impact on the numbers here with or without a beamline constraint.
Focusing on data other than Run 18, here I show two studies. The first is a track-by-track comparison of global track characteristics with and without the patch. The second is an event-by-event comparison of track counts and vertex positions with and without the patch.
-Gene
________________________
Track-by-track study (globals)
I looked at 1000 events from Run 2017 AuAu54, with about 267k global tracks, of which ~100 tracks are reconstructed with the patch that aren't without the patch, and similarly the other way as well. While many of these have few hits, they extend up to 40 hit tracks.
Curiously, 4 tracks which have 45 hits in both passes (and therefore should be unaffected by the patch) have a differences that should up in their reconstructed pT, but only at the level of ~0.02%, which is almost certainly negligible in that it's far, far below our momentum resolution.
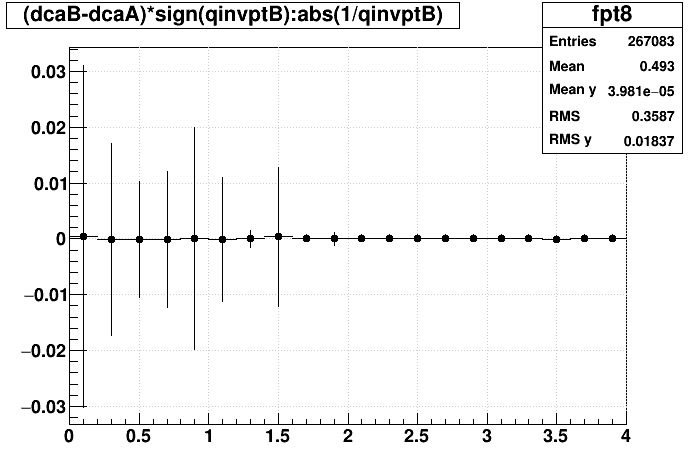
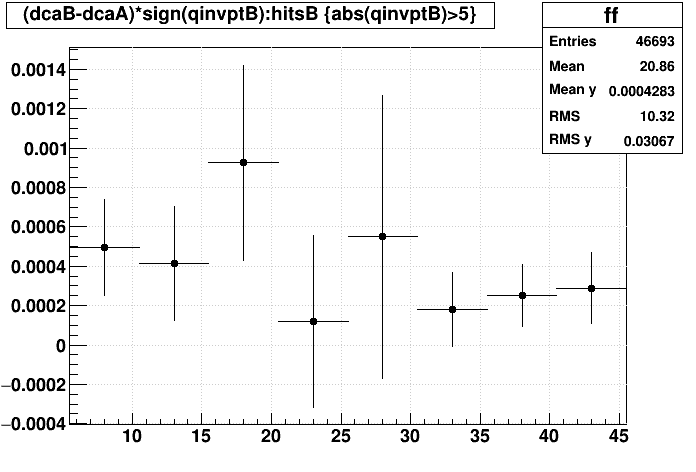
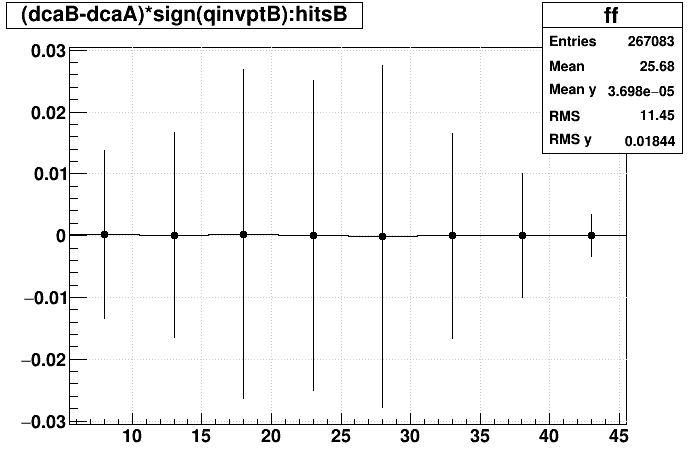
Below are plots of track differences for a few quantities, and here are some summarizing statements:
There appears to be some low pT biases, but they are small, at the level of ~2 x 10⁻⁵ for Δ(pT)/pT, ~8 μm for DCA, and ~0.001 for NHits.
The standard deviations of the differences appear to be on the order of ~6 x 10⁻⁴ for Δ(pT)/pT, ~200 μm for DCA, and ~0.05 for NHits.
| Quantity | vs. pT [low pT] | vs. pT [profs] | vs. Nhits [pT < 200 MeV/c] | vs. Nhits [profs] |
|---|---|---|---|---|
/ pT |
 |
 |
 |
 |
 |
 |
 |
 |
|
| Δ(NHits) | 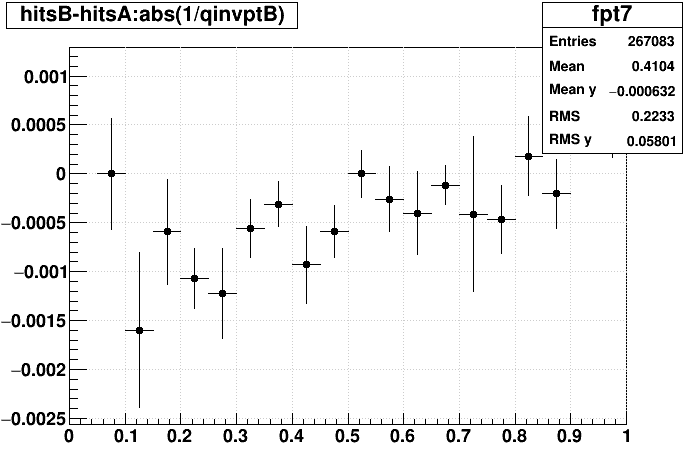 |
 |
 |
 |
_____________________________________
Event-by-event study
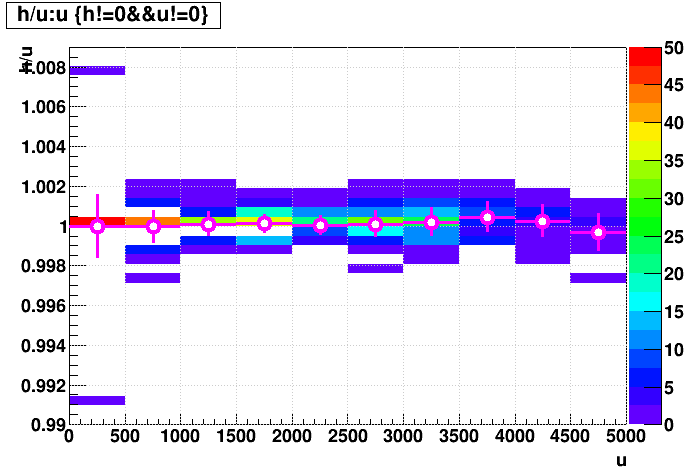
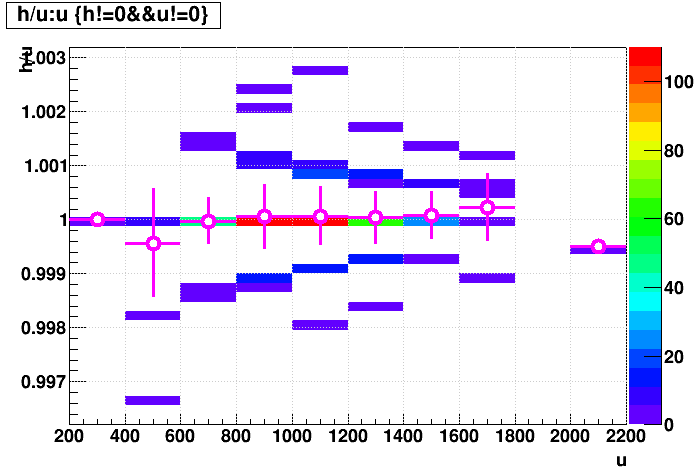
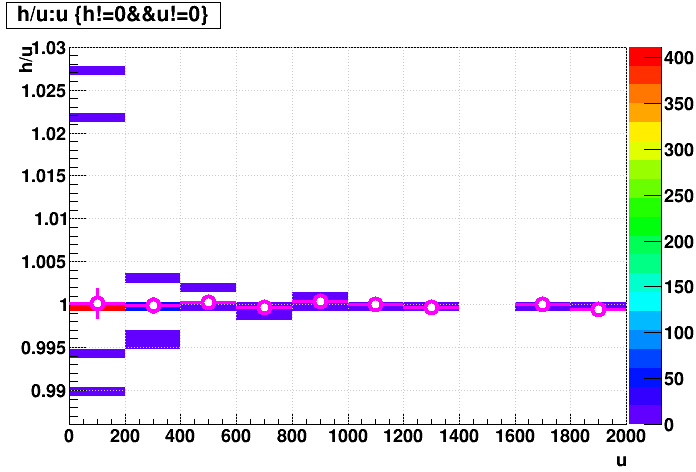
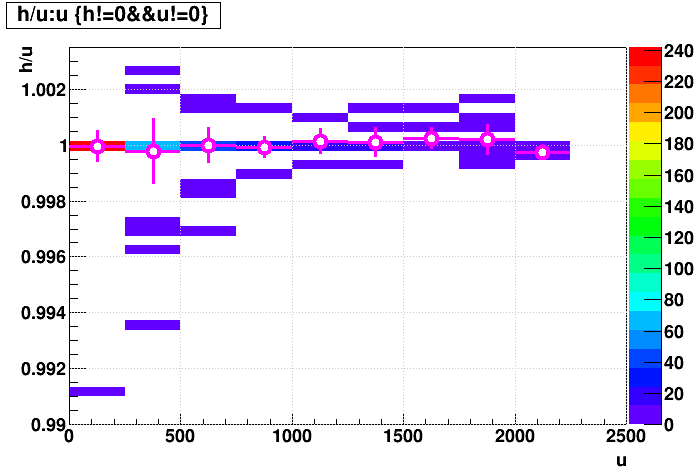
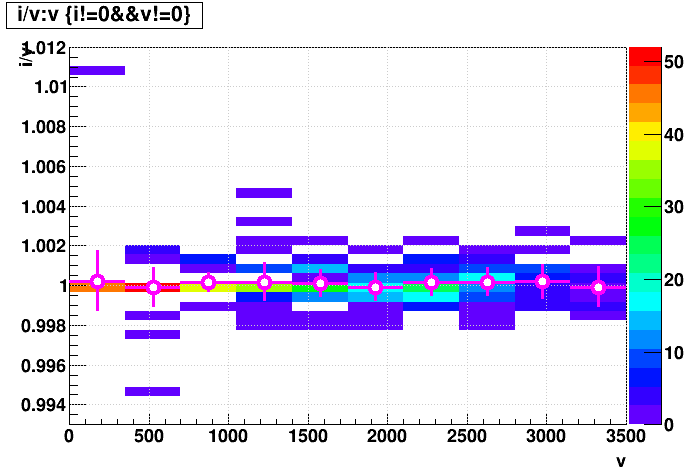
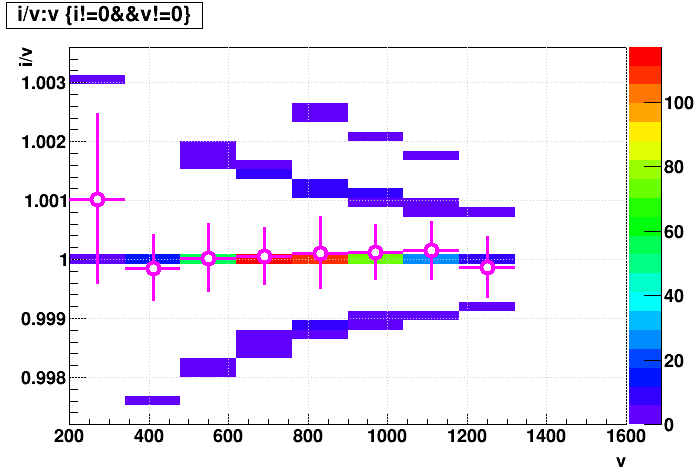
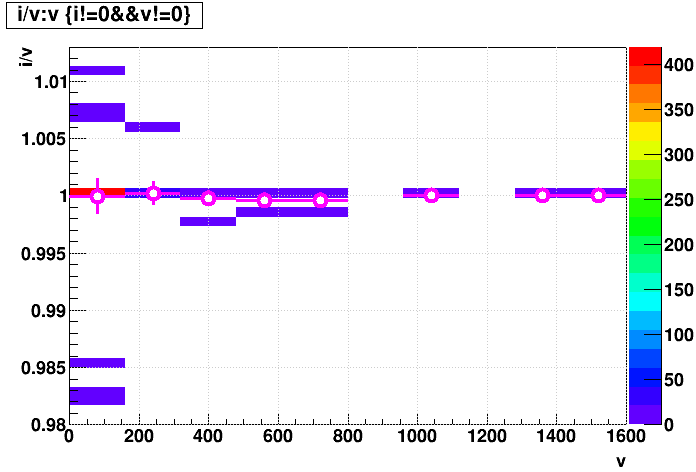
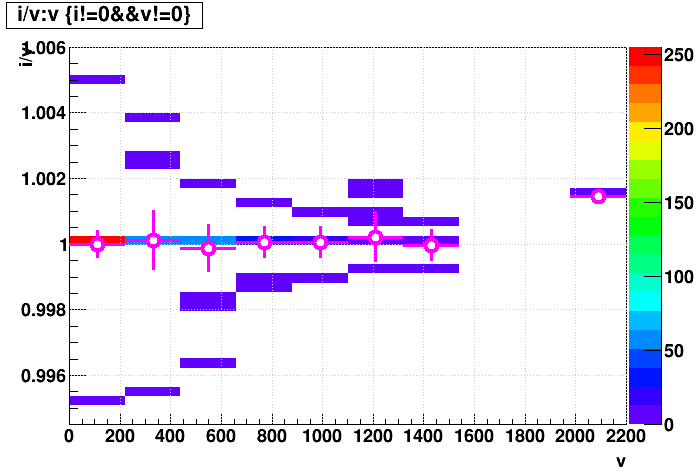
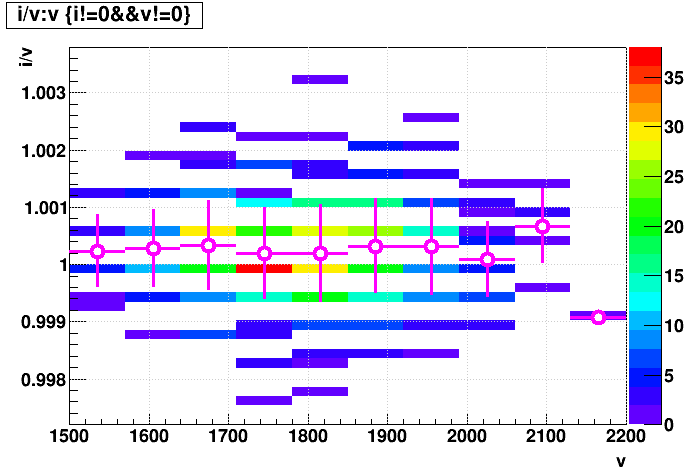
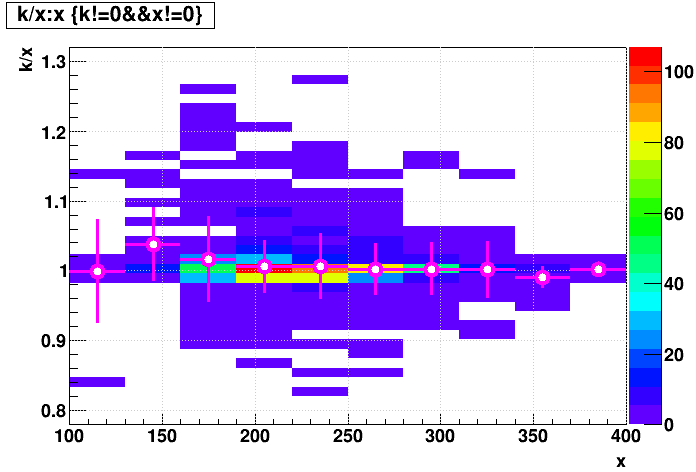
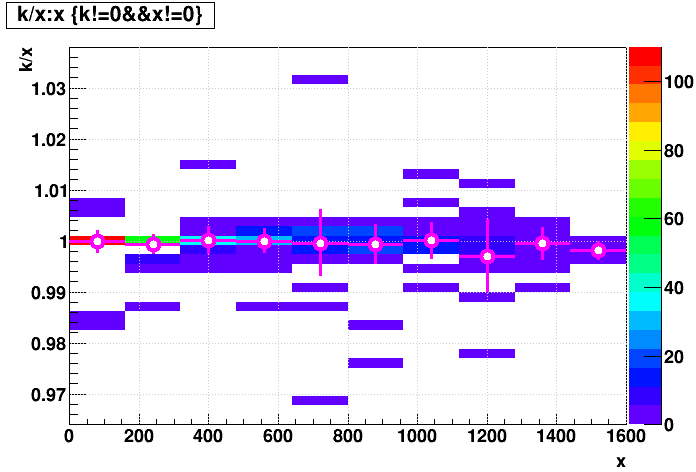
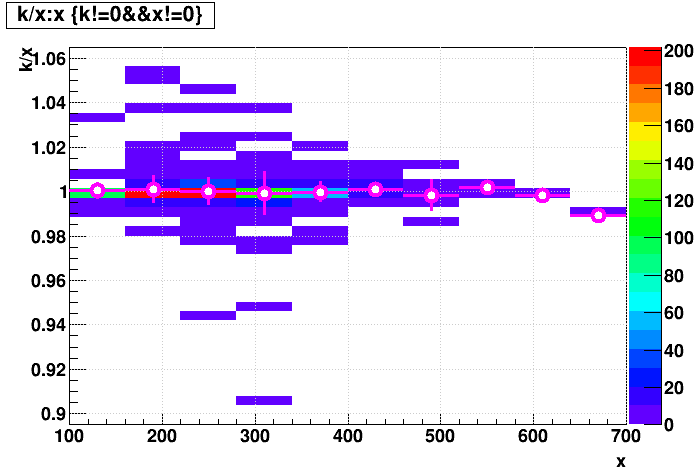
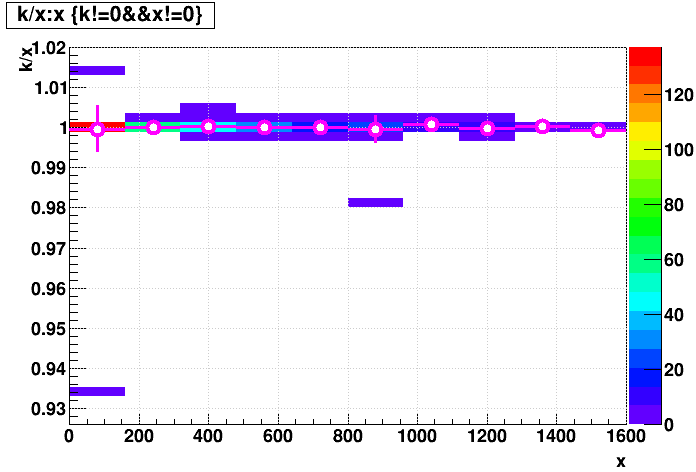
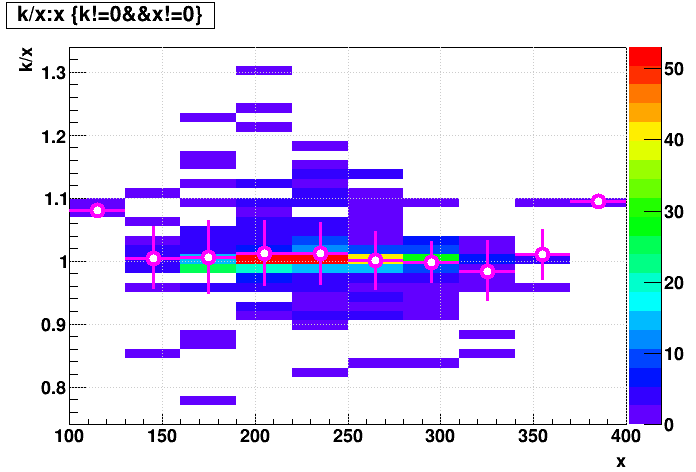
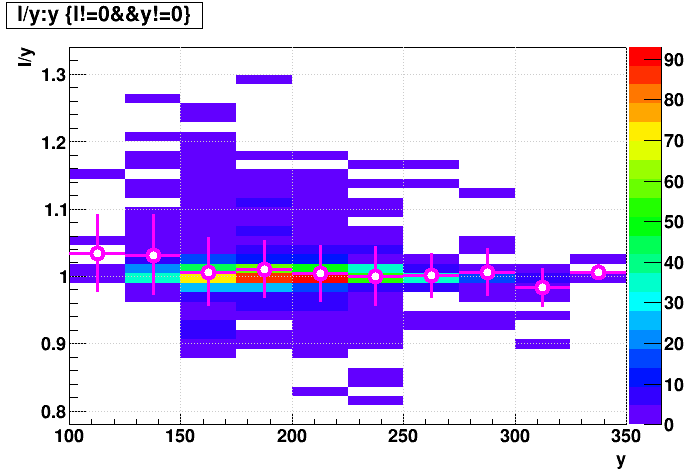
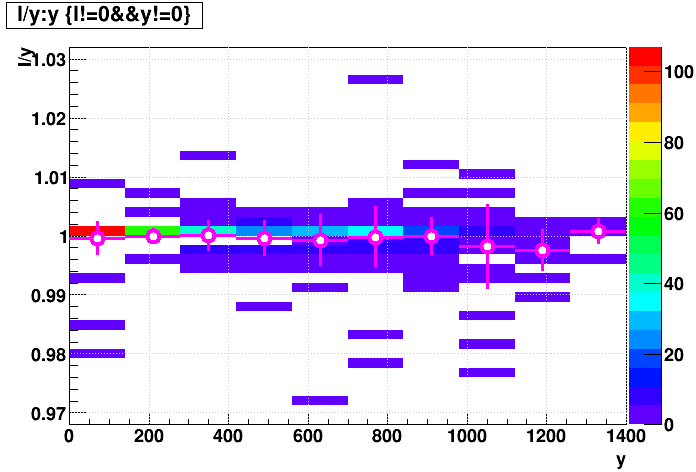
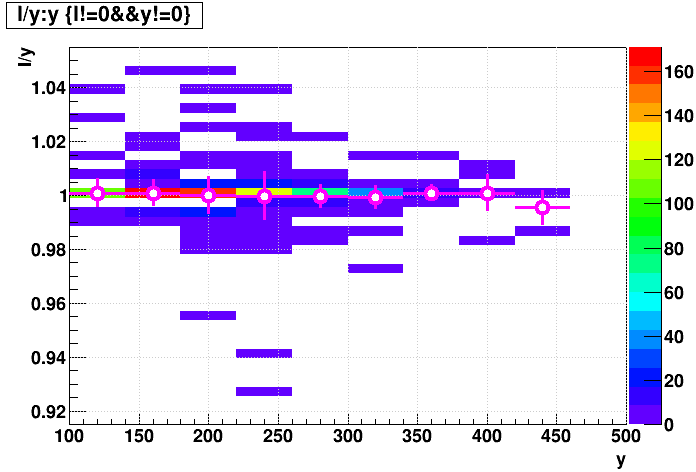
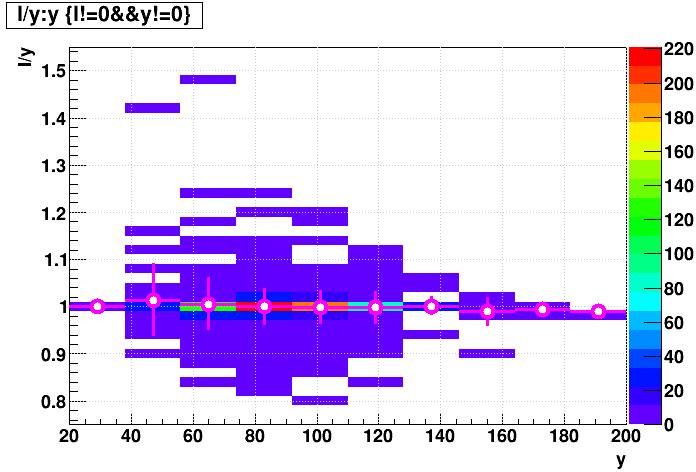
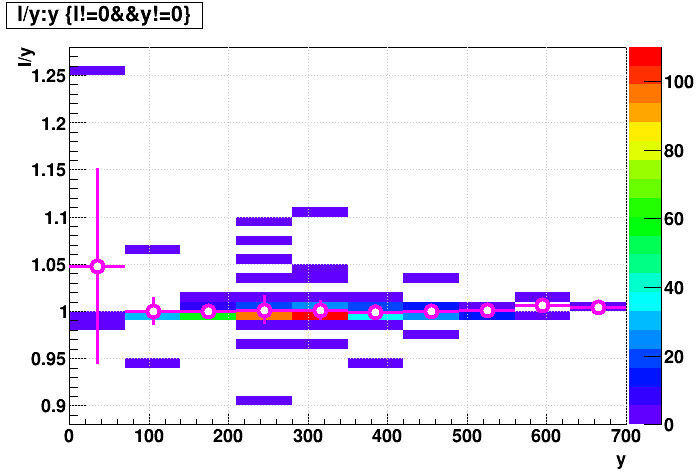
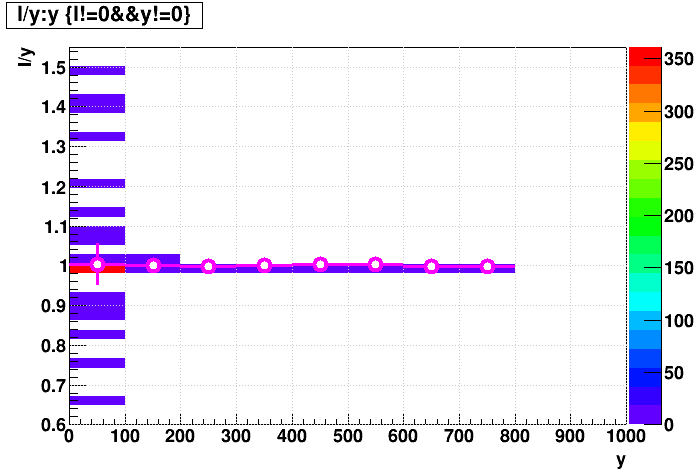
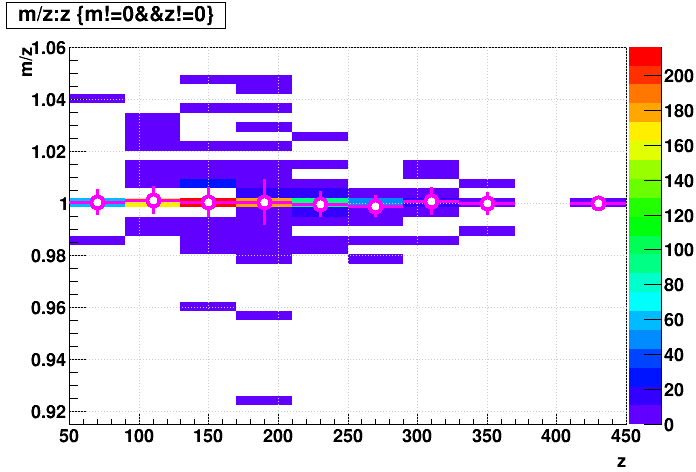
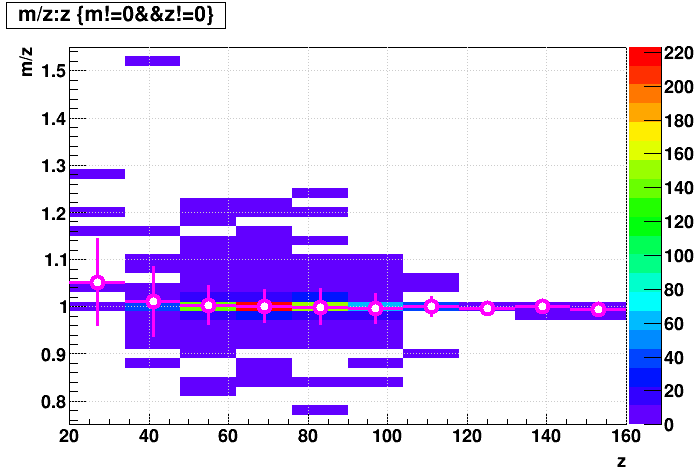
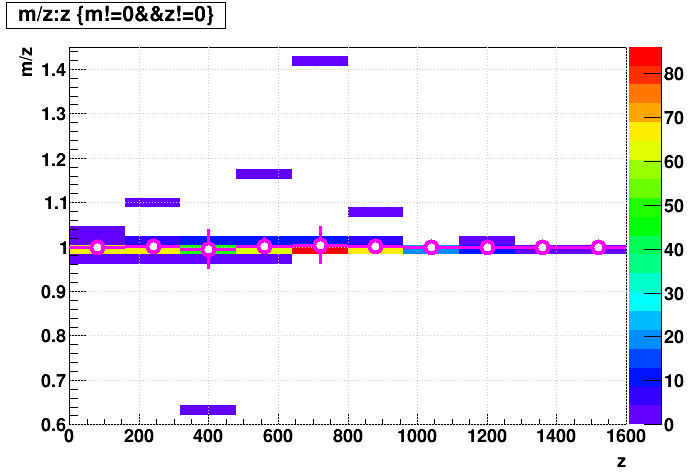
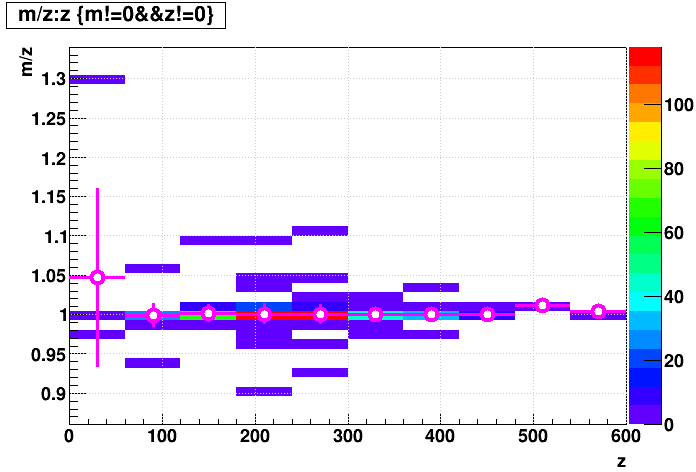
I ran the complete StiCA nightly tests (9 of them) for data from Runs 13-17, and parsed the logs for numbers regarding how many tracks were found. Here are some plots that show some of the differences. I plot the quantities as their difference divided by their magnitude in a zcol plot, with a profs plot overlaid in magenta to characterize the mean and deviation of the data. It's a bit much to digest, so I will state clearly what I see in summary:
Global tracks have no clear biases, with mean differences on the order of ~0.01%, and standard deviations on the order of ~0.1%.
Primary tracks have no clear biases, with mean differences on the order of ~0.1%, and standard deviations on the order of ~1% for AA and pA data, and ~5% for pp data.
| Quantity | 2013 pp510 | 2014 AuAu200 | 2015 pAu200 | 2015 pp200 | 2016 AuAu200 | 2016 dAu200 | 2017 AuAu54 UPC | 2017 AuAu54 | 2017 pp510 |
|---|---|---|---|---|---|---|---|---|---|
| Δ(Globals) / Globals |
 |
 |
 |
 |
 |
 |
 |
 |
 |
/ Globals flag> 0 |
 |
 |
 |
 |
 |
 |
 |
 |
 |
/ Globals NHits>15 |
 |
 |
 |
 |
 |
 |
 |
 |
 |
/ Primaries |
 |
 |
 |
 |
 |
 |
 |
 |
 |
/ Primaries flag> 0 |
 |
 |
 |
 |
 |
 |
 |
 |
 |
/ Primaries NHits>15 |
 |
 |
 |
 |
 |
 |
 |
 |
 |
I have further looked at the difference in primary vertex positions...
In pp data, we use a beamline constraint, so the vertices don't shift much in x,y for a shift in z (only whatever the slope of the beamline dictates, and that is always a few orders of magnitude less than 1). Here are the means and RMS of the vertex z position shifts in beamline-constrained data due to the patch, along with the percentage of events whose highest-ranked primary vertex changed to a different vertex (as defined by |Δ(Vz)| > 1 cm).
| dataset | z-shift mean [μm] | z-shift RMS [μm] | different 1st vertex |
|---|---|---|---|
| 2013 pp510 | 0 | 750 | ~3.5% |
| 2015 pp200* | -20 | 575 | ~1.0% |
| 2017 AuAu54 UPC | 50 | 725 | ~2.0% |
| 2017 pp510 | -15 | 1125 | ~3.0% |
In pA and AA data, without a beamline constraint, the vertices can move in all three dimensions. Here are the z-shift mean and RMS, transverse-shift mean and RMS, and percentage of events with changed highest-ranked primary vertices.
| dataset | z-shift mean [μm] | z-shift RMS [μm] | xy-shift mean [μm] | xy-shift RMS [μm] | different 1st vertex |
|---|---|---|---|---|---|
| 2014 AuAu200* | 0 | 5 | 0 | 10 | ~0% |
| 2015 pAu200* | 0 | 25 | 5 | 50 | ~0.5% |
| 2016 AuAu200 | 0 | 15 | 0 | 30 | ~1.5% |
| 2016 dAu200* | 0 | 20 | 0 | 30 | ~0.5% |
| 2017 AuAu54 | 0 | 15 | 0 | 20 | ~0% |
The * denotes that 1 of the 4 pp datasets, and 4 of the 5 pA & AA datasets used HFT in tracking, but it doesn't appear to be that its inclusion has much of an impact on the numbers here with or without a beamline constraint.
»
- genevb's blog
- Login or register to post comments