- genevb's home page
- Posts
- 2025
- 2024
- 2023
- 2022
- September (1)
- 2021
- 2020
- 2019
- 2018
- 2017
- December (1)
- October (3)
- September (1)
- August (1)
- July (2)
- June (2)
- April (2)
- March (2)
- February (1)
- 2016
- November (2)
- September (1)
- August (2)
- July (1)
- June (2)
- May (2)
- April (1)
- March (5)
- February (2)
- January (1)
- 2015
- December (1)
- October (1)
- September (2)
- June (1)
- May (2)
- April (2)
- March (3)
- February (1)
- January (3)
- 2014
- 2013
- 2012
- 2011
- January (3)
- 2010
- February (4)
- 2009
- 2008
- 2005
- October (1)
- My blog
- Post new blog entry
- All blogs
Efficiency loss from PPV cuts in Run 12 pp510
Updated on Thu, 2016-03-24 10:38. Originally created by genevb on 2016-03-22 11:19.
Zilong Chang has demonstrated that the default vertex finder cuts resulted in efficiency loss in Run 12 pp510 reconstruction with respect to using other cut sets (see You do not have access to view this node, or slide 9 of this presentation). I will attempt to quantify here approximately the total efficiency loss of reconstructable events.
(Note: plots on this page are bigger than presented on the page, so you can open the image in a new browser window/tab and see it at higher resolution.)
Step 1. Determine the relative efficiency loss due to using the wrong cuts:
I divided Zilong's "Good Primary Vertex" efficiency numbers from "default PPV" by "Modified PPV 2":
95.3/96.6 = 0.9865
90.4/91.1 = 0.9923
52.2/77.0 = 0.6779
Step 2. Model this efficiency loss as a function of luminosity:
I plotted the above numbers vs. ZDC coincidence rate and then found a function that to first order describes the loss. I show this in the first plot using the function: 1.0-2.2e-6*x*x (where x here is the ZDC coincidence rate in kHz):

Step 3. Plot this efficiency vs. time:
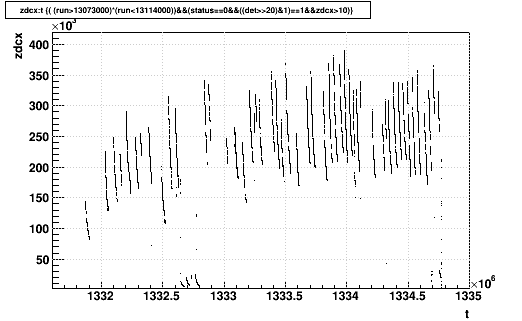
Using an Ntuple of ZDC coincidence rates from Run 12 pp510, I selected runs with good status, TPC in the data stream, and ZDC coincidence rate greater than 10 Hz. I plotted the ZDC coincidence rate (zdcx) vs. (unix) time, and this efficiency loss function versus time in the following two plots:


Step 4. Determine the time-weighted efficiency loss:
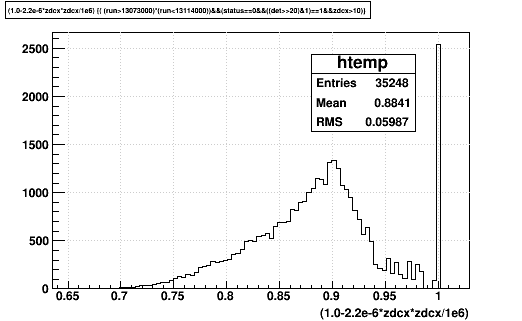
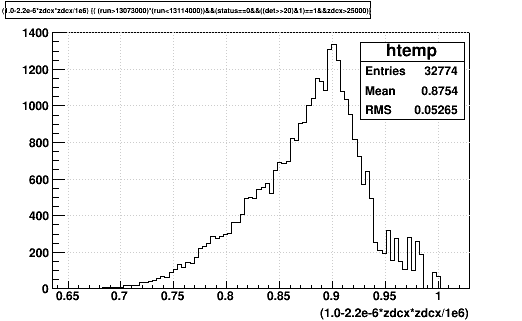
The next plots just show the distribution of the efficiency loss function (i.e. the projection of the above efficiency loss plot), which show that the mean (weighted by time) is 88%. I made the plots using cuts on zdcx of 10 Hz (first plot) and 25 kHz (second plot) to get rid of the spike at ~1.0 due to low luminosity data samples, and this dropped the mean of the plot from 0.8841 to 0.8754. That difference is below other uncertainties in my model, so it isn't worth arguing about.


In other words, the default vertex finder cuts cost us roughly ~12% of the events that we could have reconstructed. It is expected (and demonstrated already by Zilong) that embedding will replicate these efficiency losses, so it will not introduce a significant additional uncertainty into physics analyses.
-Gene
(Note: plots on this page are bigger than presented on the page, so you can open the image in a new browser window/tab and see it at higher resolution.)
Step 1. Determine the relative efficiency loss due to using the wrong cuts:
I divided Zilong's "Good Primary Vertex" efficiency numbers from "default PPV" by "Modified PPV 2":
95.3/96.6 = 0.9865
90.4/91.1 = 0.9923
52.2/77.0 = 0.6779
Step 2. Model this efficiency loss as a function of luminosity:
I plotted the above numbers vs. ZDC coincidence rate and then found a function that to first order describes the loss. I show this in the first plot using the function: 1.0-2.2e-6*x*x (where x here is the ZDC coincidence rate in kHz):

Step 3. Plot this efficiency vs. time:
Using an Ntuple of ZDC coincidence rates from Run 12 pp510, I selected runs with good status, TPC in the data stream, and ZDC coincidence rate greater than 10 Hz. I plotted the ZDC coincidence rate (zdcx) vs. (unix) time, and this efficiency loss function versus time in the following two plots:


Step 4. Determine the time-weighted efficiency loss:
The next plots just show the distribution of the efficiency loss function (i.e. the projection of the above efficiency loss plot), which show that the mean (weighted by time) is 88%. I made the plots using cuts on zdcx of 10 Hz (first plot) and 25 kHz (second plot) to get rid of the spike at ~1.0 due to low luminosity data samples, and this dropped the mean of the plot from 0.8841 to 0.8754. That difference is below other uncertainties in my model, so it isn't worth arguing about.


In other words, the default vertex finder cuts cost us roughly ~12% of the events that we could have reconstructed. It is expected (and demonstrated already by Zilong) that embedding will replicate these efficiency losses, so it will not introduce a significant additional uncertainty into physics analyses.
-Gene
»
- genevb's blog
- Login or register to post comments
