- genevb's home page
- Posts
- 2025
- 2024
- 2023
- 2022
- September (1)
- 2021
- 2020
- 2019
- 2018
- 2017
- December (1)
- October (3)
- September (1)
- August (1)
- July (2)
- June (2)
- April (2)
- March (2)
- February (1)
- 2016
- November (2)
- September (1)
- August (2)
- July (1)
- June (2)
- May (2)
- April (1)
- March (5)
- February (2)
- January (1)
- 2015
- December (1)
- October (1)
- September (2)
- June (1)
- May (2)
- April (2)
- March (3)
- February (1)
- January (3)
- 2014
- 2013
- 2012
- 2011
- January (3)
- 2010
- February (4)
- 2009
- 2008
- 2005
- October (1)
- My blog
- Post new blog entry
- All blogs
FastOffline event spread in runs
Updated on Thu, 2016-02-25 15:45. Originally created by genevb on 2016-02-25 15:45.
The following question was posed:
"Given that FastOffline (1) only processes a limited number of files from each run, and (2) only processes up to the first 1000 events in each file, how evenly does FastOffline sample the events over the duration of a run?"
To get a quick answer on this, I did the following:
- Obtain a list of st_physics(_adc) files processed by FastOffline over a 4 day period (1286 files)
- For each of those files, obtain from the database:
- the run number
- the total number of events in its run
- the maximum event ID in its run
- the first event ID in the file
- the last event ID in the file
- the number of events in the file
One side point I learned: the number of events in any given run (b) is typically a smaller number than the maximum event ID among its files (c). Perhaps this is because some events are aborted after they are allocated an event ID. I thus found the maximum event ID (c) more useful for my purpose than the total number of events in a run (b).
I then created three fractional quantities for each file with respect to its run, where 0=start of run, and 1=end of run:
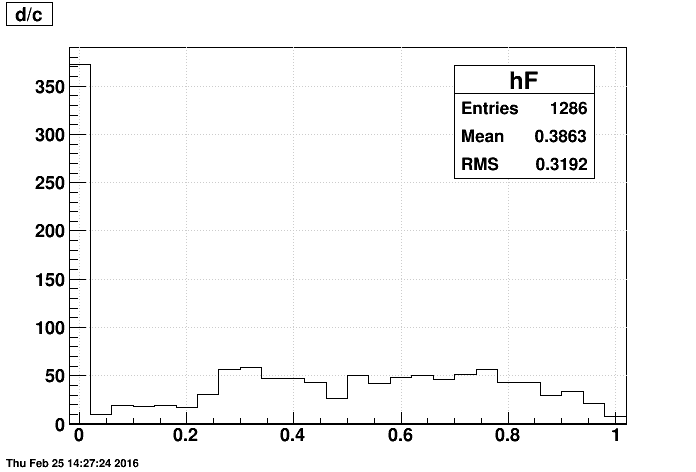
- d/c : the first event
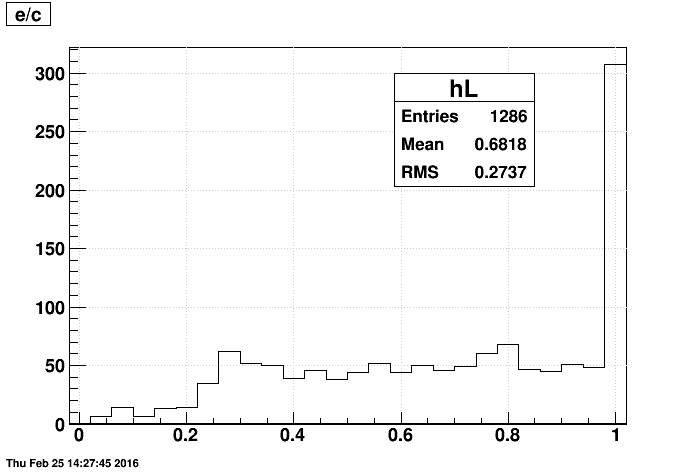
- e/c : the last event
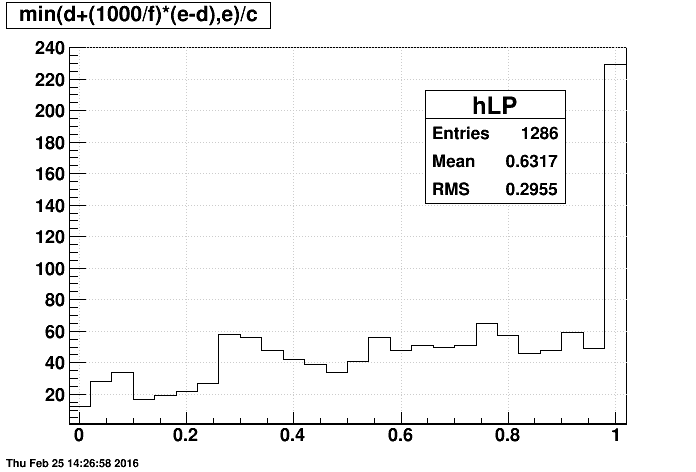
- min(d+(1000/f)*(e-d),e)/c : an estimator of the last event currently produced by FastOffline
I then made some plots of these quantities as follows:
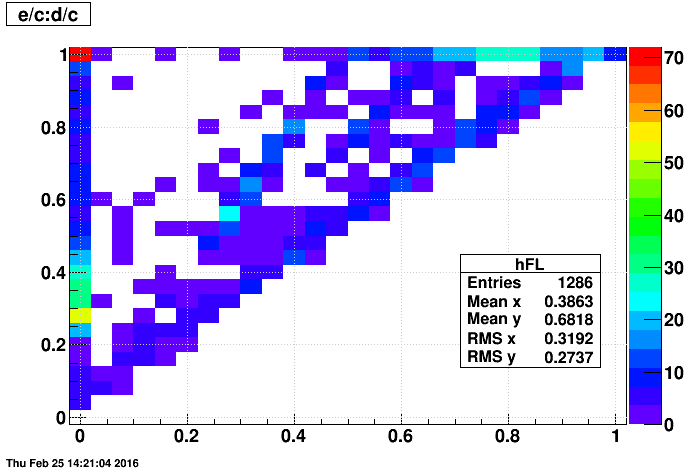
- last event produced vs. first event
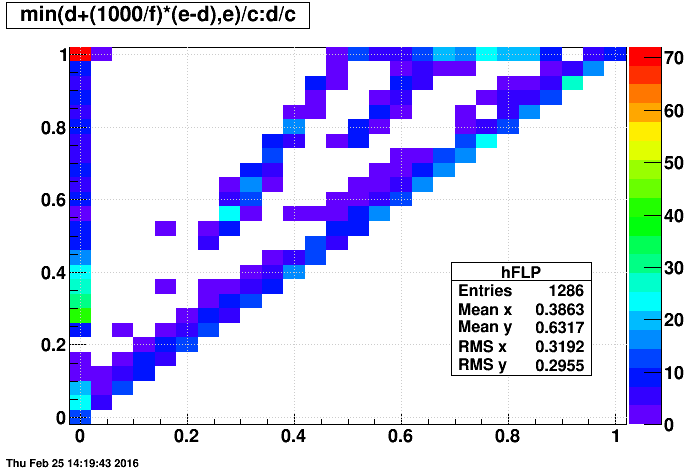
One can see that there are multiple components in the above plot. A major split is between "adc" files and "non-adc" files, as seen in the next two plots:
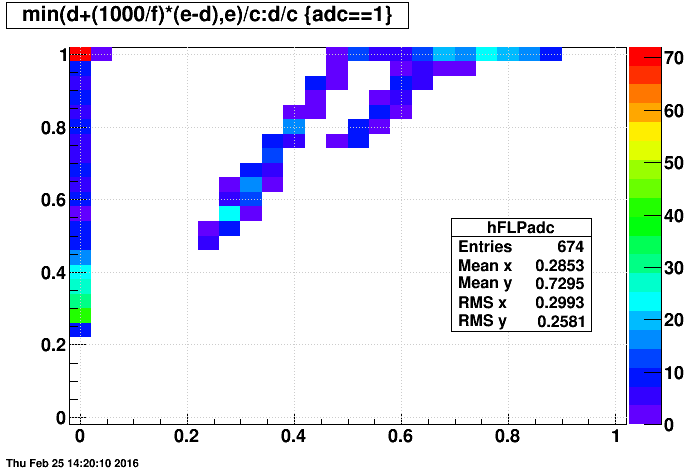
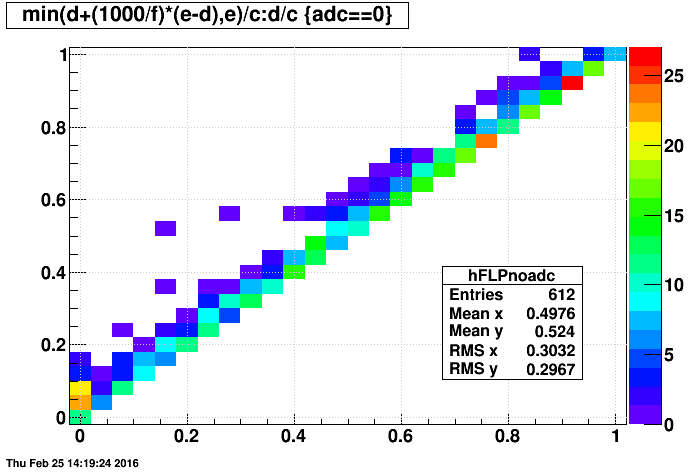
- last event vs. first event
Jerome suspected that the spread in distribution of first events would by more significant thatn the limitations caused by only sampling 1000 events, and the above 2D plots support his point as there is no grand different between using the last event in the above plots vs. my estimator of the last event produced.
It's a little tough to digest all the information contained in the above 2D plots, so I came up with a 1D metric of the sampling of events in a run: the average of the first and last events (produced). Here are these distributions (with each entry weighted by the number of events produced for that file: min(1000,f)) using last event produced, then the last event in the files:
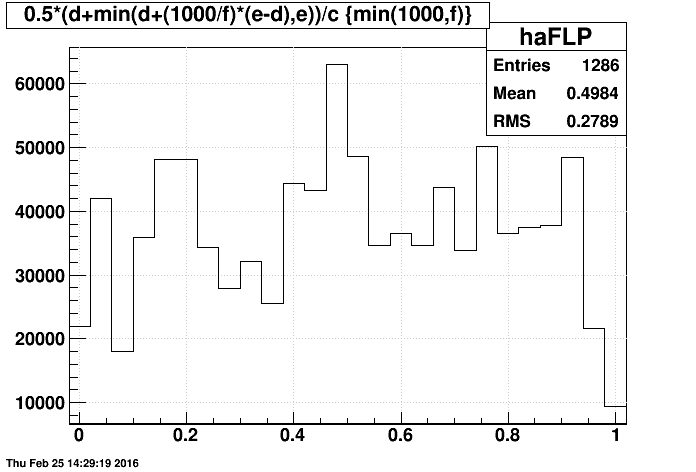
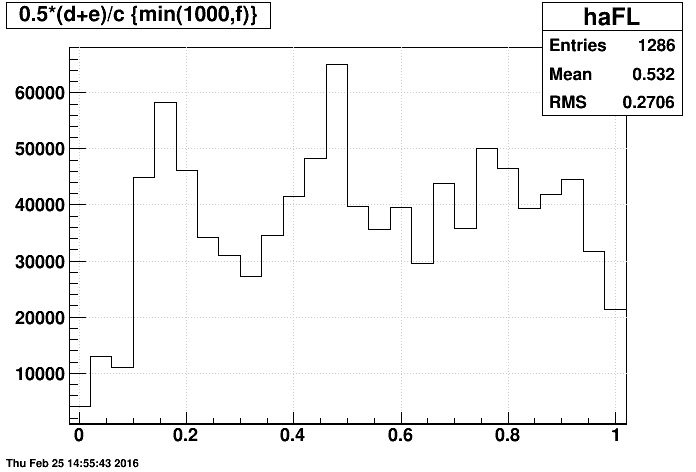
One minor finding is that many "adc" files span nearly the entire run, this contributing to small peak near 0.5. These files can be seen as a red bin in the upper-left corner of the earlier 2D plots.
My conclusions are as follows:
- Given that the mean is very close to 0, and the RMS is nearly 1/sqrt(12)=0.2887 when using the last event produced, this is strikingly close to a randomly-sampled flat distribution between 0 and 1.
- The current operational mode of FastOffline does a very good job of randomly sampling events over a run!
- Using the last event in a file shows only minor differences compared to the last event produced.
- Operating FastOffline in a mode where we evenly sample up to 1000 events from a file instead of producing the first 1000 events would provide no significant improvement in randomly sampling events over a run!
-Gene
»
- genevb's blog
- Login or register to post comments