- genevb's home page
- Posts
- 2025
- 2024
- 2023
- 2022
- September (1)
- 2021
- 2020
- 2019
- December (1)
- October (4)
- September (2)
- August (6)
- July (1)
- June (2)
- May (4)
- April (2)
- March (3)
- February (3)
- 2018
- 2017
- December (1)
- October (3)
- September (1)
- August (1)
- July (2)
- June (2)
- April (2)
- March (2)
- February (1)
- 2016
- November (2)
- September (1)
- August (2)
- July (1)
- June (2)
- May (2)
- April (1)
- March (5)
- February (2)
- January (1)
- 2015
- December (1)
- October (1)
- September (2)
- June (1)
- May (2)
- April (2)
- March (3)
- February (1)
- January (3)
- 2014
- December (2)
- October (2)
- September (2)
- August (3)
- July (2)
- June (2)
- May (2)
- April (9)
- March (2)
- February (2)
- January (1)
- 2013
- December (5)
- October (3)
- September (3)
- August (1)
- July (1)
- May (4)
- April (4)
- March (7)
- February (1)
- January (2)
- 2012
- December (2)
- November (6)
- October (2)
- September (3)
- August (7)
- July (2)
- June (1)
- May (3)
- April (1)
- March (2)
- February (1)
- 2011
- November (1)
- October (1)
- September (4)
- August (2)
- July (4)
- June (3)
- May (4)
- April (9)
- March (5)
- February (6)
- January (3)
- 2010
- December (3)
- November (6)
- October (3)
- September (1)
- August (5)
- July (1)
- June (4)
- May (1)
- April (2)
- March (2)
- February (4)
- January (2)
- 2009
- November (1)
- October (2)
- September (6)
- August (4)
- July (4)
- June (3)
- May (5)
- April (5)
- March (3)
- February (1)
- 2008
- 2005
- October (1)
- My blog
- Post new blog entry
- All blogs
Gating Grid turn on step
Updated on Wed, 2020-10-28 12:59. Originally created by genevb on 2020-10-27 13:22.
During an investigation into picking up hits in the region of the TPC where the gating grid turns on (which did not match between simulation and real data) led me to find that there is some variation in different real datasets for where the hits begin. I looked at the event.root files of nightly tests for data from 2013-2017, and I processed some DAQ data from 2018 myself as the nightly tests don't produce event.root files for those. I did NOT investigate iTPC data (2019 and later, and sector 20 in 2018, though I just simply excluded sector 20 from all my investigations to keep things consistent).
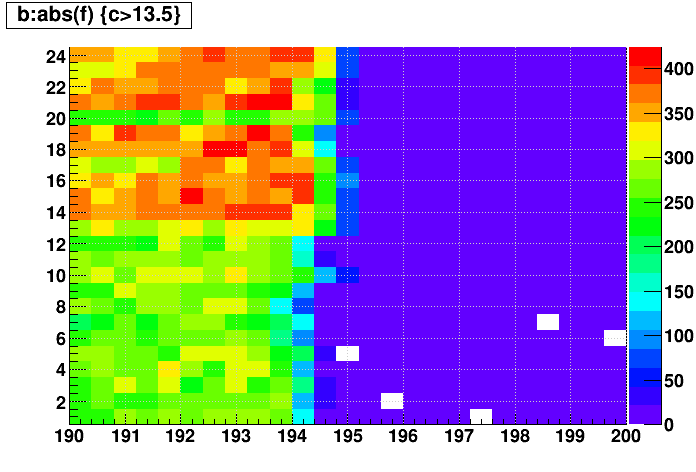
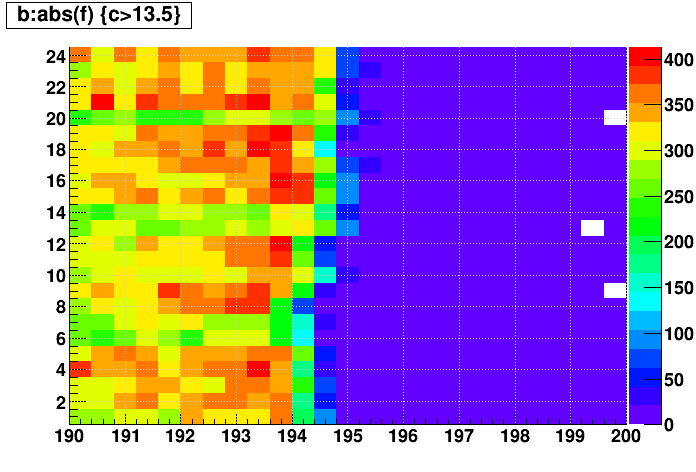
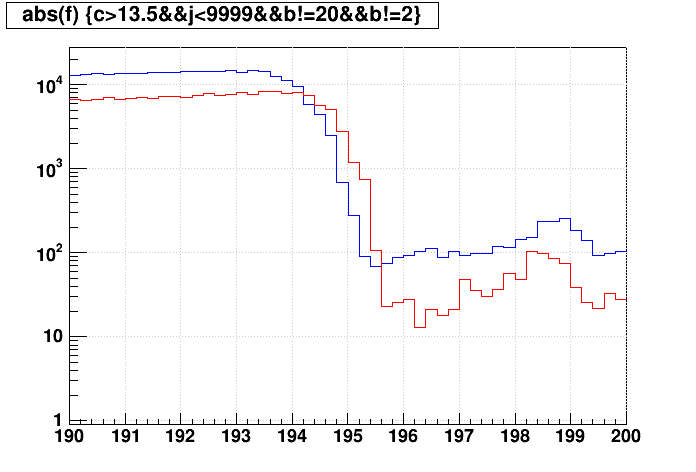
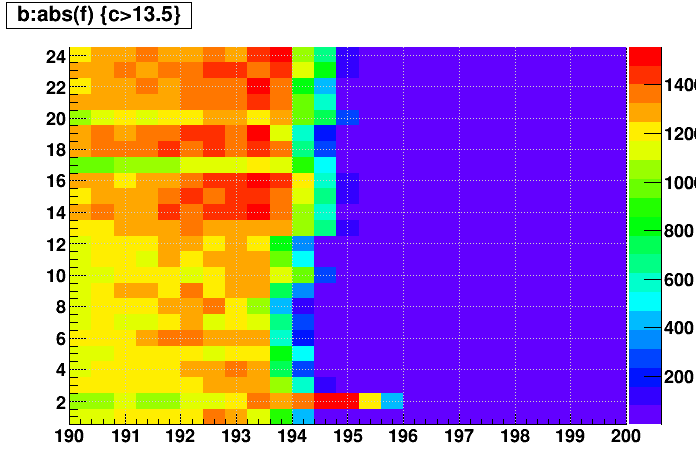
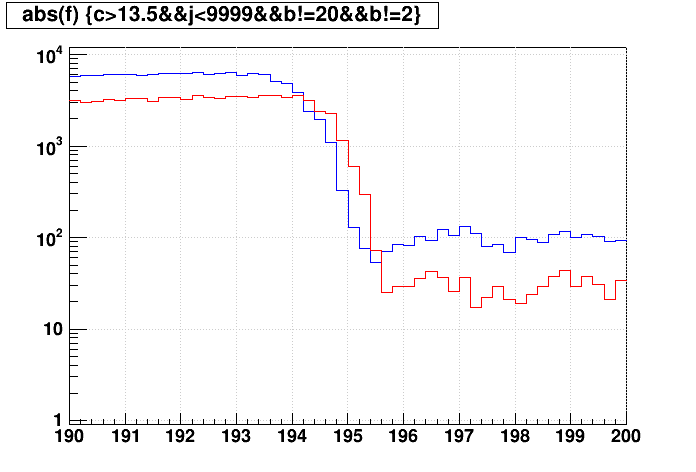
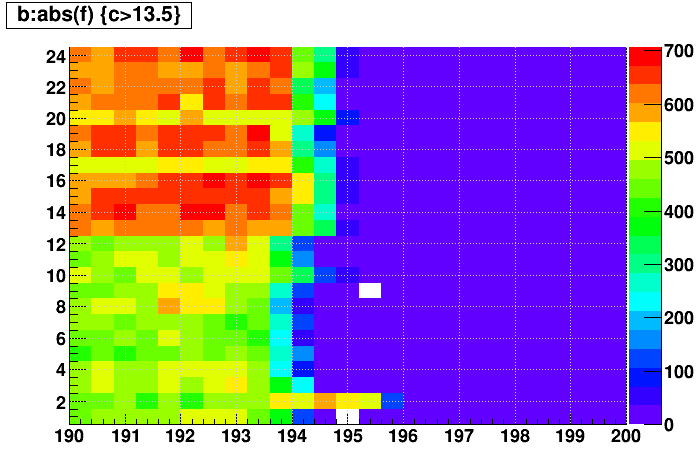
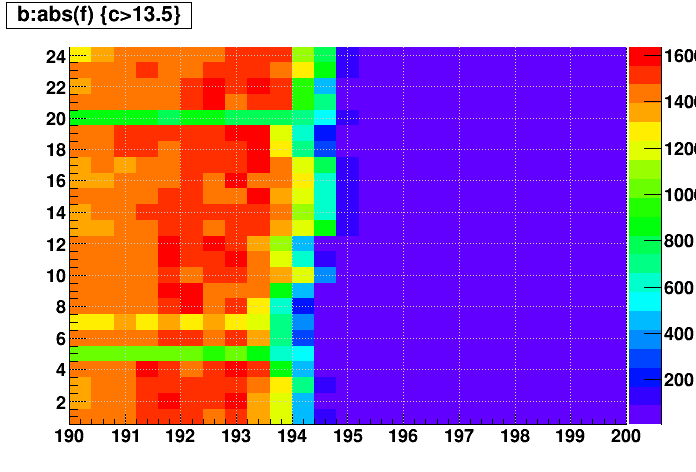
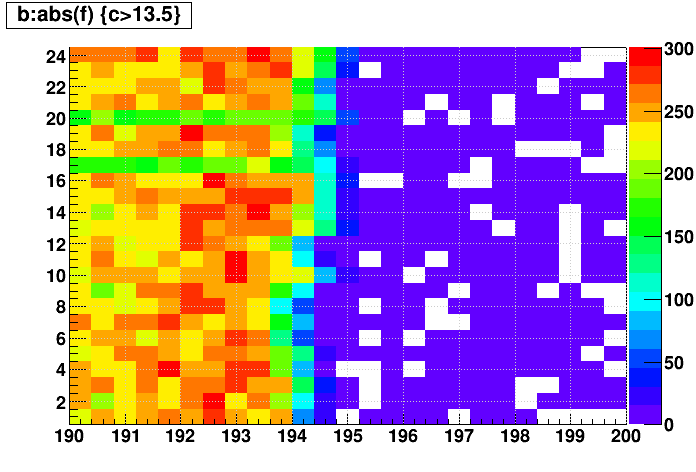
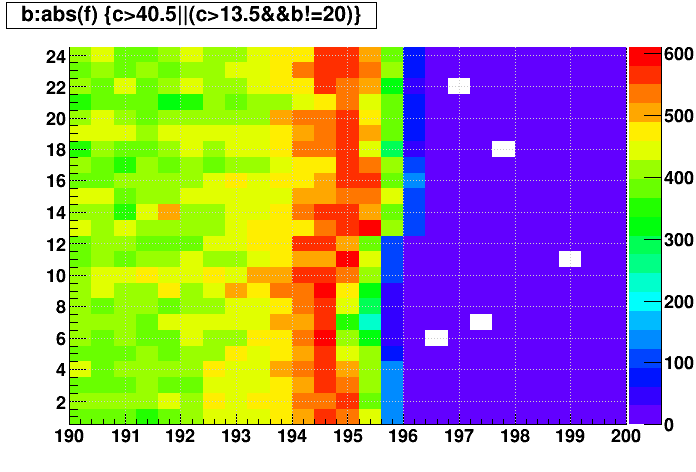
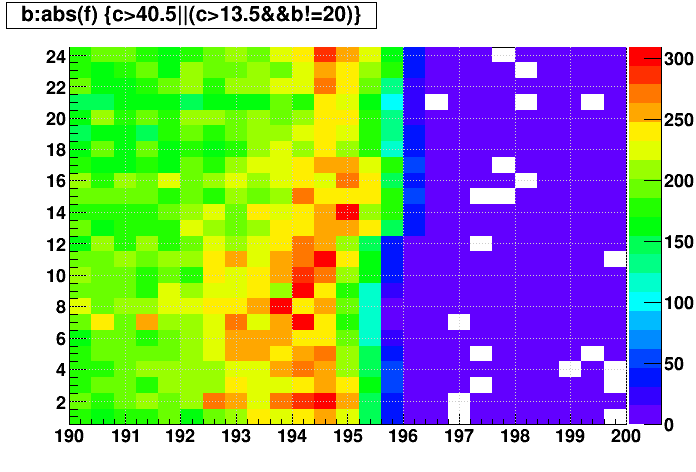
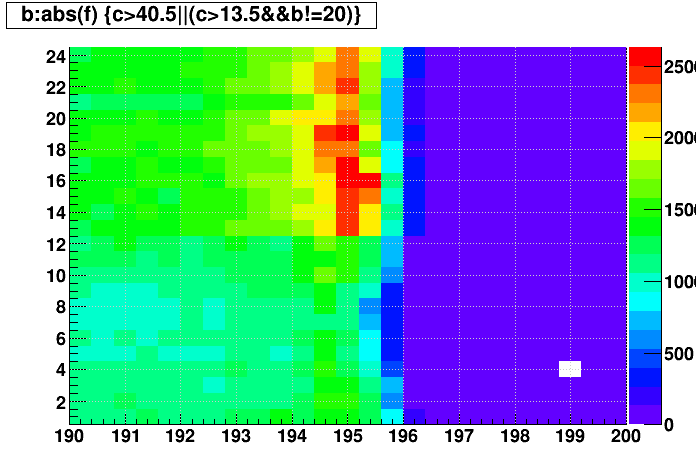
Below are plots of the |z| position of hits near the ends of the TPC where the gating grid turns on. Because the gating grid can be different for inner and outer TPC sectors, they are separated in the plots: outer (blue), inner (red) for the plots in the left column, and only the outer sectors are used for the plots in the right column. I did not make an effort to use the same number of events or hits in the plots, so any differences in the magnitude of the histograms is not of particular concern.
Most datasets appear to begin their fall-off at roughly the same place (time), although the east-side sectors (13-24) do appear to extend a little farther in z (open a litter earlier in time) than the west-side sectors (1-12). However, there are some notable differences:
There are likely even more subtleties to examine here if someone wanted to. For example, there may be some sinusoid patterns, perhaps related to the alignment of the TPC.
-Gene
Below are plots of the |z| position of hits near the ends of the TPC where the gating grid turns on. Because the gating grid can be different for inner and outer TPC sectors, they are separated in the plots: outer (blue), inner (red) for the plots in the left column, and only the outer sectors are used for the plots in the right column. I did not make an effort to use the same number of events or hits in the plots, so any differences in the magnitude of the histograms is not of particular concern.
Most datasets appear to begin their fall-off at roughly the same place (time), although the east-side sectors (13-24) do appear to extend a little farther in z (open a litter earlier in time) than the west-side sectors (1-12). However, there are some notable differences:
- The 2014 AuAu200 dataset appears to be open ~0.8 cm farther in z, or ~1.3 time bins earlier.
- All of the 2018 datasets appear to be open ~1.2 cm farther in z, or ~2.0 time bins earlier opening. Worried that the 2018 difference was due to obtaining the hits when running BFC instead of from event.root files, I did compare the two ways of getting those hits for one of the datasets and found them to be identical. So the 2018 shift is real.
There are likely even more subtleties to examine here if someone wanted to. For example, there may be some sinusoid patterns, perhaps related to the alignment of the TPC.
| Dataset | TPC hit |z| distribution [cm] inner (red) & outer (blue) sectors |
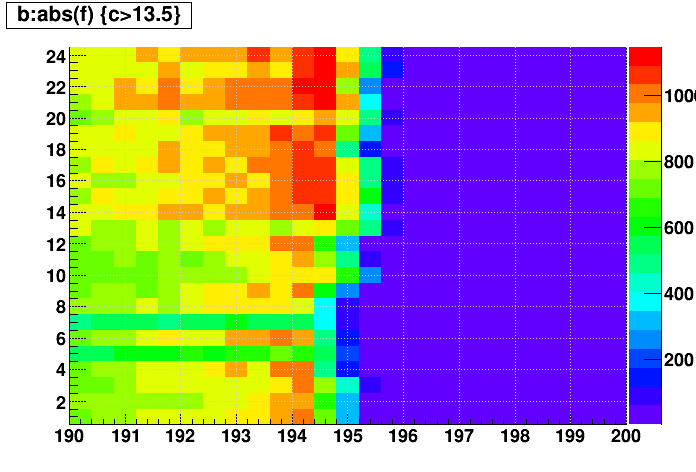
TPC hit |z| distribution [cm] vs. sector (outer sectors only) |
|---|---|---|
| 2013 pp 510 | 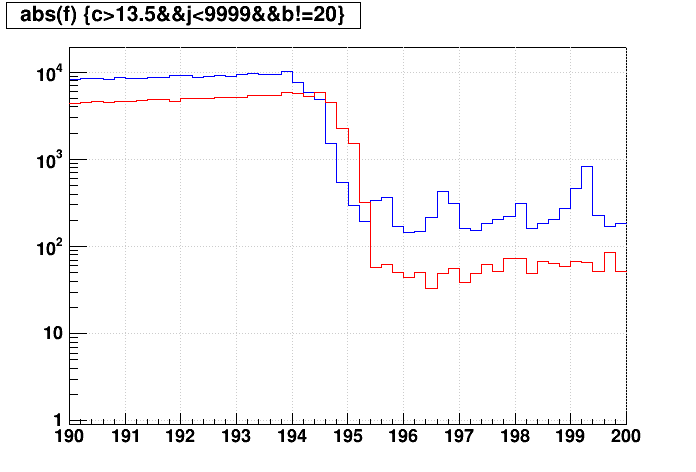 |
 |
| 2014 AuAu 200 |  |
 |
| 2015 pAu 200 |  |
 |
| 2015 pp 200 | 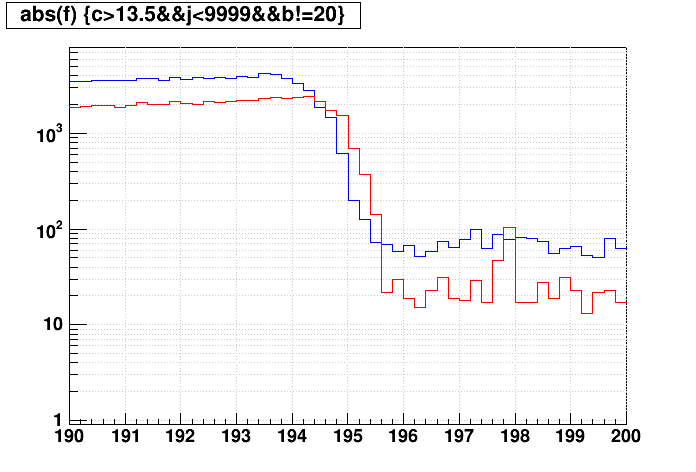 |
 |
| 2016 AuAu 200 (exclude sector 2 in first plot, as it alone used a new gating grid driver) |
 |
 |
| 2016 dAu 200 (exclude sector 2 in first plot, as it alone used a new gating grid driver) |
 |
 |
| 2017 pp 510 | 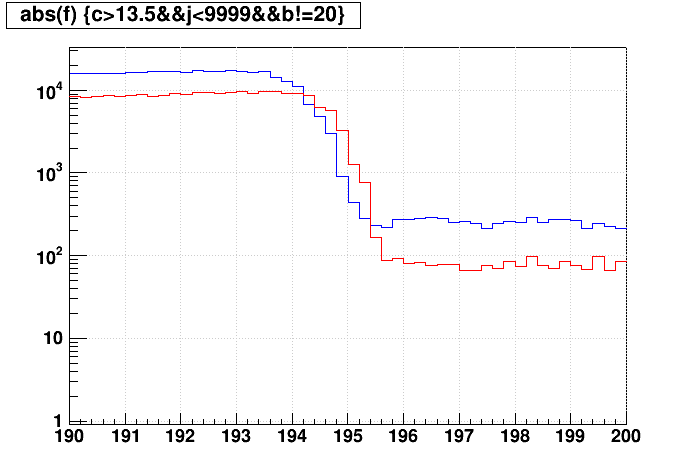 |
 |
| 2017 AuAu 54 | 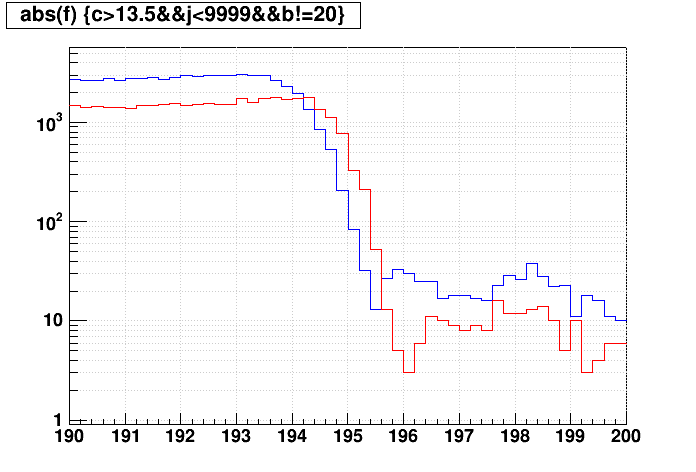 |
 |
| 2018 isobar 200 | 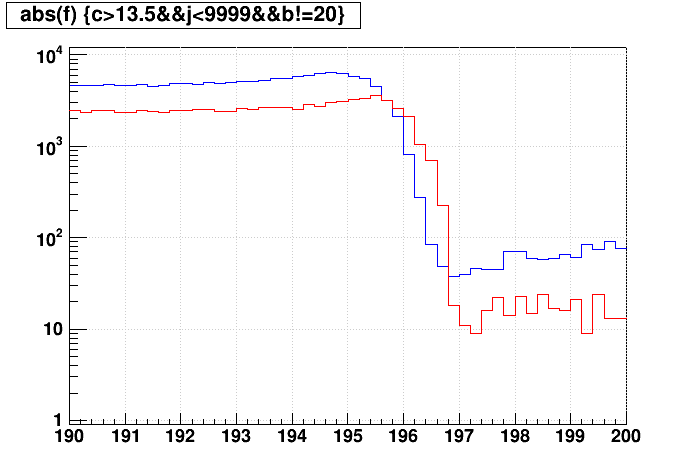 |
 |
| 2018 AuAu 27 | 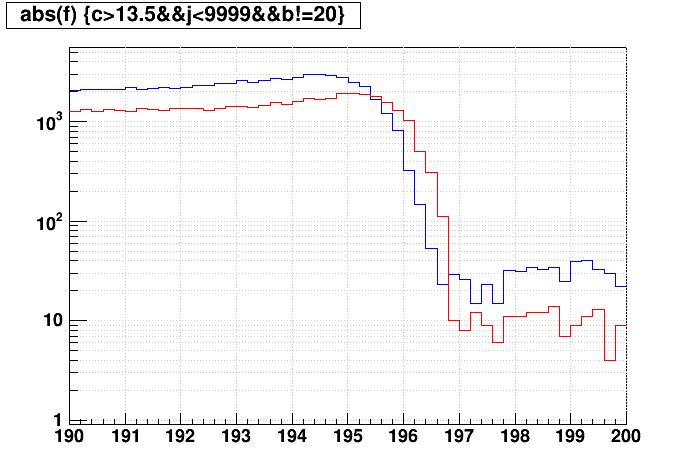 |
 |
| 2018 AuAu 3.85 (FXT) | 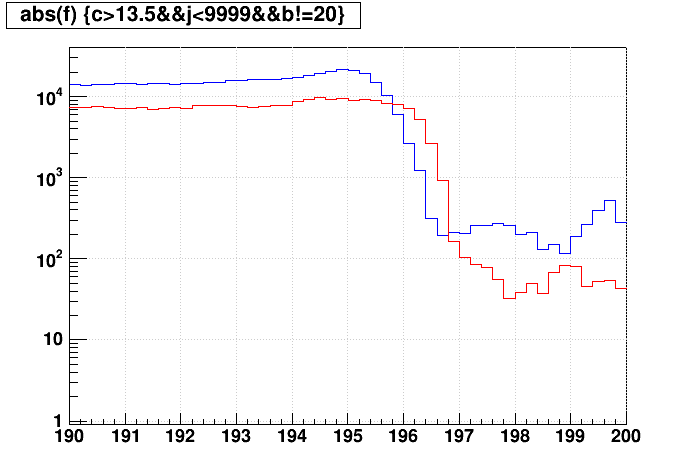 |
 |
-Gene
»
- genevb's blog
- Login or register to post comments