- genevb's home page
- Posts
- 2025
- 2024
- 2023
- 2022
- September (1)
- 2021
- 2020
- 2019
- 2018
- 2017
- December (1)
- October (3)
- September (1)
- August (1)
- July (2)
- June (2)
- April (2)
- March (2)
- February (1)
- 2016
- November (2)
- September (1)
- August (2)
- July (1)
- June (2)
- May (2)
- April (1)
- March (5)
- February (2)
- January (1)
- 2015
- December (1)
- October (1)
- September (2)
- June (1)
- May (2)
- April (2)
- March (3)
- February (1)
- January (3)
- 2014
- 2013
- 2012
- 2011
- January (3)
- 2010
- February (4)
- 2009
- 2008
- 2005
- October (1)
- My blog
- Post new blog entry
- All blogs
GridLeak Wall currents (first look)
Updated on Wed, 2019-02-20 12:01. Originally created by genevb on 2019-02-20 11:52.
(click on images on this page for higher resolution)
This is a first look at data we are recording from slow controls on the readback voltages and currents on the GridLeak walls that were installed this year. Values are recorded every 30 seconds. From what I can tell, the population of the database started in earnest at 2019-02-07 17:39:08 GMT. There were some recordings in January, but I don't think they are useful.
Voltages show no variations, with a steady 115.0 V for the tip ("inner") voltages and 450.0 V for the side ("outer") when they are not zero. Prashanth has confirmed that the true voltages are negative, not positive as reported in this database. These voltages are so stable at these values that I have not bothered to plot them here.
Currents, plotted below, have some mysteries for me:
(red is voltage off, blue is voltage on)
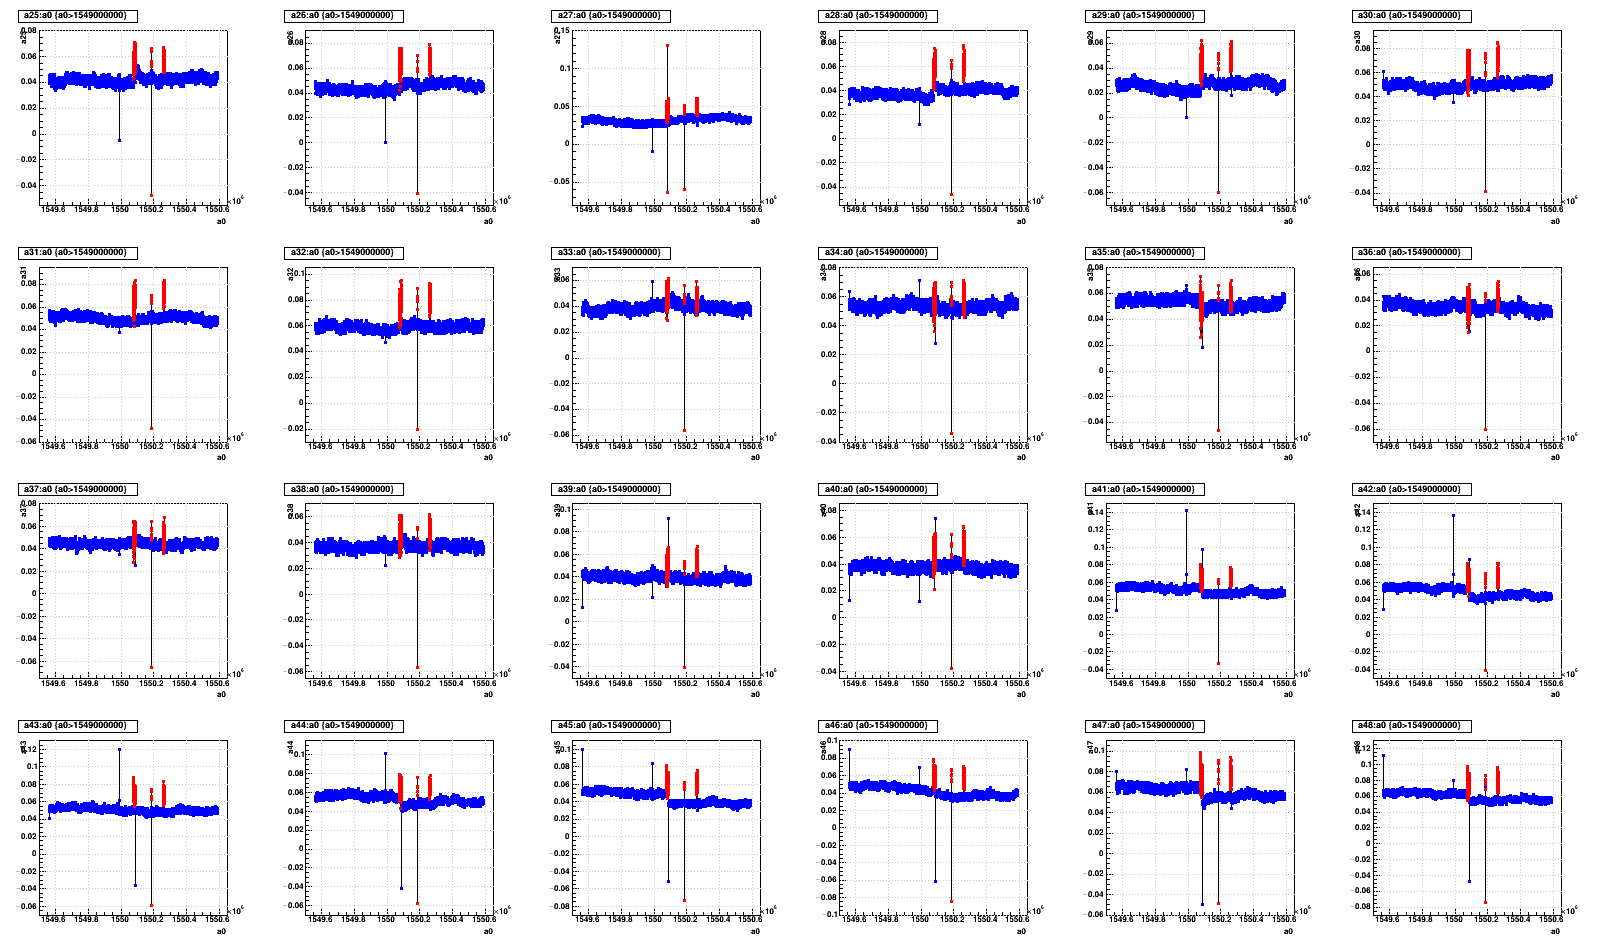
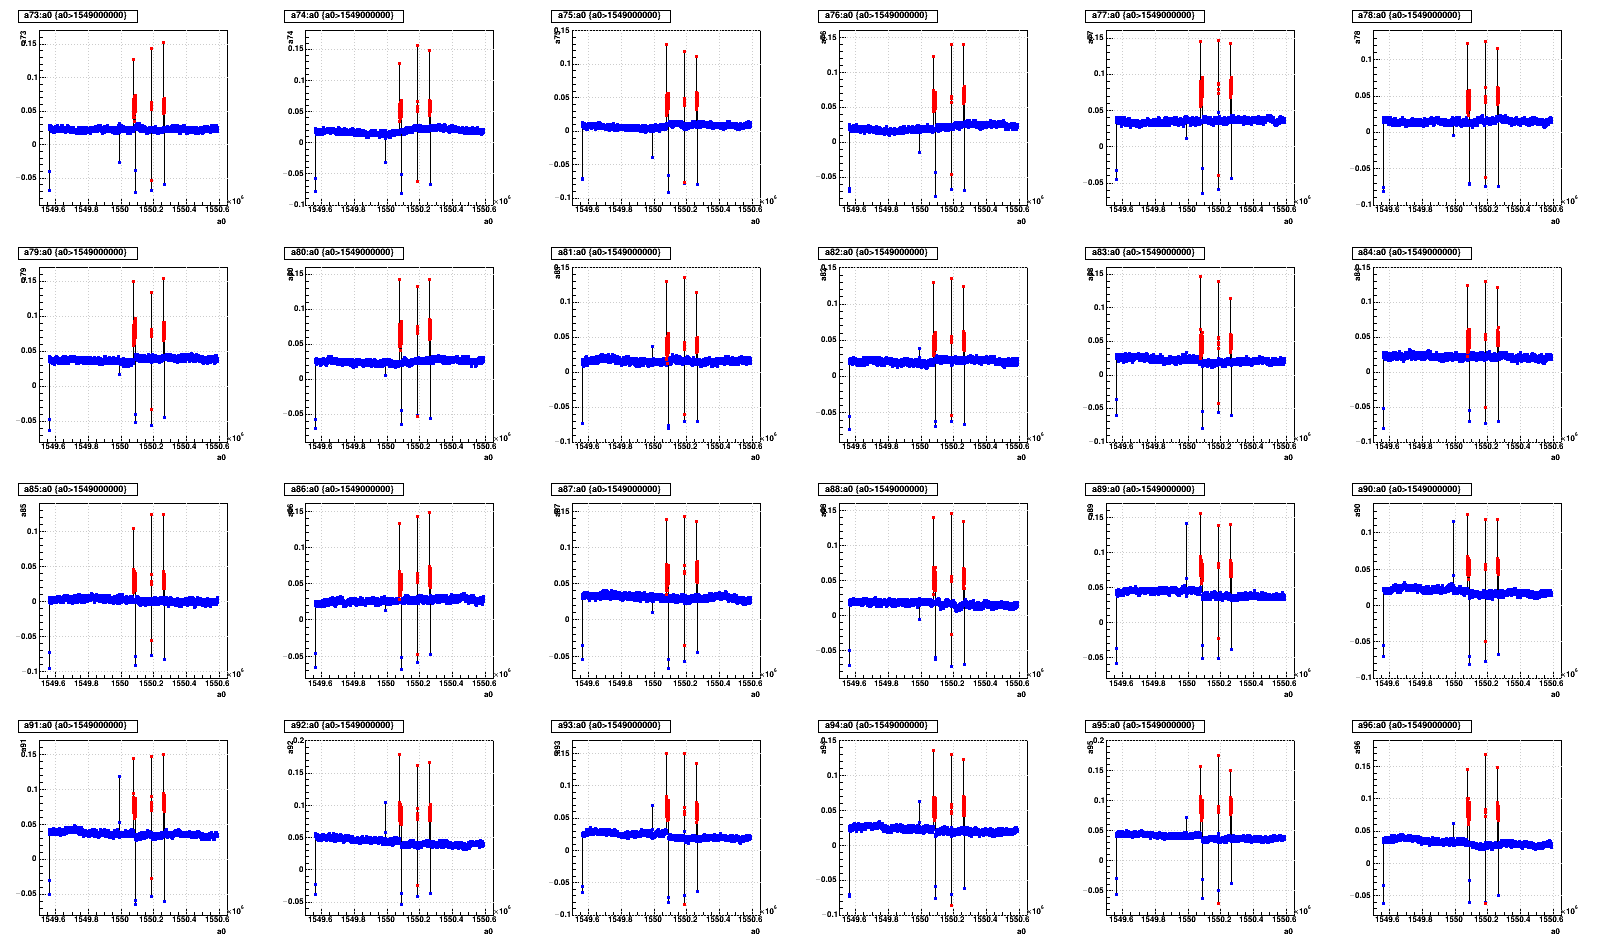
Outer (side) currents vs. unix time:
(again, red is voltage off, blue is voltage on)
I then tried to make a more summarizing plot of all 24 sectors voltage-on outer currents vs. time. Here, I've subtracted each sector's mean voltage-on outer current, and then taken a profile so that each time bin's value is an average of many recordings:
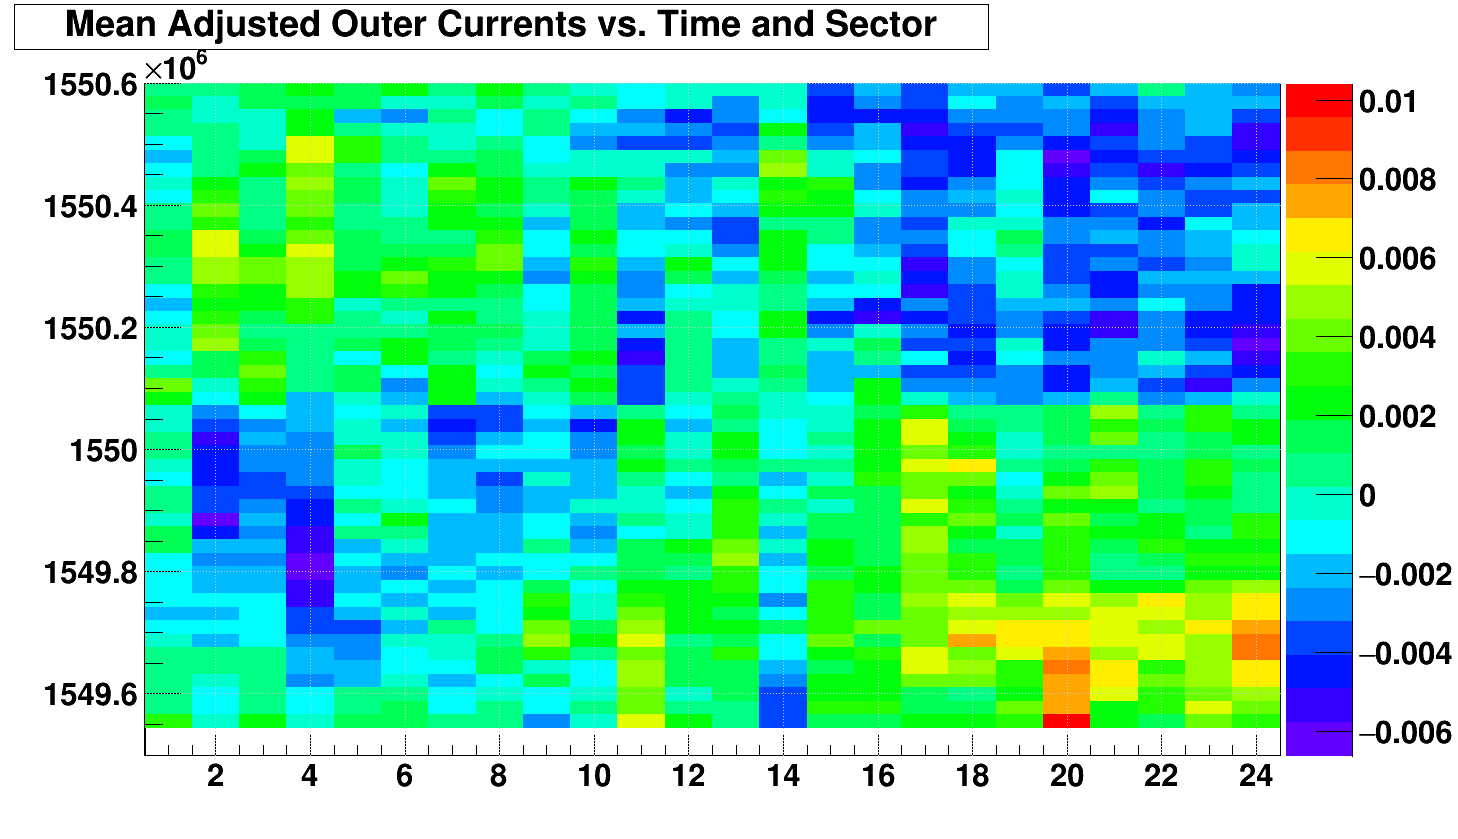
What we see is that most of the west sectors' currents increased (with respect to zero; however, the currents get closer to what I'm calling the pedestal) right around 2019-02-13 20:37:51, while most of the east sectors' currents decreased. There are some clear exceptions to that rule in sectors 11 and 14. And there are some less conclusive sectors: 1, 9, 12. I'm unaware of whether there is anything that, for example, groups sectors 11, 13, and 15-24 together.
-Gene
This is a first look at data we are recording from slow controls on the readback voltages and currents on the GridLeak walls that were installed this year. Values are recorded every 30 seconds. From what I can tell, the population of the database started in earnest at 2019-02-07 17:39:08 GMT. There were some recordings in January, but I don't think they are useful.
Voltages show no variations, with a steady 115.0 V for the tip ("inner") voltages and 450.0 V for the side ("outer") when they are not zero. Prashanth has confirmed that the true voltages are negative, not positive as reported in this database. These voltages are so stable at these values that I have not bothered to plot them here.
Currents, plotted below, have some mysteries for me:
- They appear to have a pedestal value that is above zero when the voltages are off. I don't know if this is OK.
- The value of the currents then generally decrease (but are still above zero) when the voltages are turned on. I don't know if this is a sign of the true voltages and currents being negative or not.
- If the numbering of the sectors is correct, currents on the tips AND sides of sectors 1, 2, 4, 5, 11, 17, 18, 20, 21, 23, 24 took a noticeable step at approximately 2019-02-13 20:37:51 GMT. Not all steps were equal in magnitude, nor even in the same direction!
- The currents on the side ("outer") appear to have some spikes on occasion that are there for all 24 sectors! These spikes are large enough to flip the sign of the currents in the database. If what I'm seeing is a pedestal minus a real current, then the spikes are about an order of magnitude larger than the current. Timestamps I have for the spikes (GMT) are as follows:
- 2019-02-07 17:39:08
2019-02-07 17:39:38 (NB: these are the first 2 good readings I have) - 2019-02-12 16:44:18
- 2019-02-13 20:37:21
2019-02-13 20:37:51 (see observation 5 below) - 2019-02-14 23:02:51
2019-02-14 23:03:21
- 2019-02-07 17:39:08
- One of the big spikes from observation 4 (spike c) occurs when the step in observation 3 happens. This is right at the end of run 20044038, which was a pedAsPhys_tcd_only run taken without the TPC.
- There are some general, mild trends in the currents: some are drifting a little down, some are drifting a little up, some are pretty steady (see below for some additional assessment). I don't know if this is a slow drift in pedestals because we don't record much without the voltages on.
(red is voltage off, blue is voltage on)
Outer (side) currents vs. unix time:
(again, red is voltage off, blue is voltage on)
I then tried to make a more summarizing plot of all 24 sectors voltage-on outer currents vs. time. Here, I've subtracted each sector's mean voltage-on outer current, and then taken a profile so that each time bin's value is an average of many recordings:
What we see is that most of the west sectors' currents increased (with respect to zero; however, the currents get closer to what I'm calling the pedestal) right around 2019-02-13 20:37:51, while most of the east sectors' currents decreased. There are some clear exceptions to that rule in sectors 11 and 14. And there are some less conclusive sectors: 1, 9, 12. I'm unaware of whether there is anything that, for example, groups sectors 11, 13, and 15-24 together.
-Gene
»
- genevb's blog
- Login or register to post comments