- genevb's home page
- Posts
- 2025
- 2024
- 2023
- 2022
- September (1)
- 2021
- 2020
- 2019
- 2018
- 2017
- December (1)
- October (3)
- September (1)
- August (1)
- July (2)
- June (2)
- April (2)
- March (2)
- February (1)
- 2016
- November (2)
- September (1)
- August (2)
- July (1)
- June (2)
- May (2)
- April (1)
- March (5)
- February (2)
- January (1)
- 2015
- December (1)
- October (1)
- September (2)
- June (1)
- May (2)
- April (2)
- March (3)
- February (1)
- January (3)
- 2014
- 2013
- 2012
- 2011
- January (3)
- 2010
- February (4)
- 2009
- 2008
- 2005
- October (1)
- My blog
- Post new blog entry
- All blogs
Identifying injection runs via beam intensity asymmetry
Updated on Mon, 2019-04-15 13:02. Originally created by genevb on 2019-04-15 12:46.
Here is a plot of log10(IntensityYELLOW / IntensityBLUE) vs. day so far in Run 19, restricting to production runs with good status:
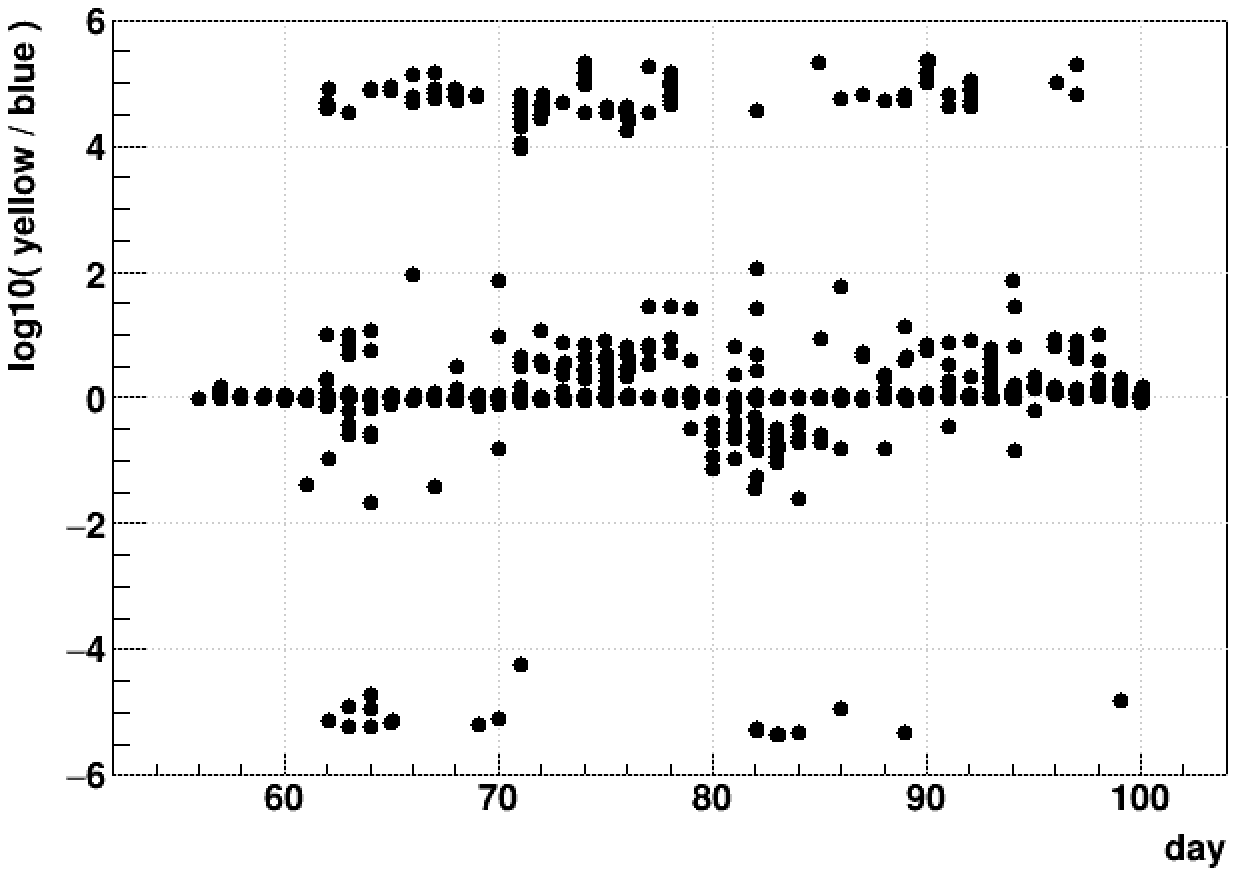
A few spot checks confirm that the runs at ~±5 are injection runs. There were some non-production runs with values at ~±3, so I have to be careful to select production runs.
Here is a recipe for finding the injection runs:
I'm keeping a somewhat up-to-date list here: ~genevb/public/Run19_InjectionRuns
-Gene
A few spot checks confirm that the runs at ~±5 are injection runs. There were some non-production runs with values at ~±3, so I have to be careful to select production runs.
Here is a recipe for finding the injection runs:
~genevb/public/getRichScalers.csh
get_file_list.pl -keys runnumber -limit 0 -cond 'runnumber>20000000,trgsetupname~roduction' >! rlist1
if (-e rlist2) rm rlist2
root -l -b -q '~genevb/public/run2scaler.C("rlist1","log10(inty/intb)","ntup.root","rlist2")' >&! log.run2scaler
if (-e rlist3) rm rlist3
root -l -b '~genevb/public/ntup.C(2,"rlist2")' << EOF
a->SetScanField(0);
a->Scan("x","abs(y)>3"); >rlist3
.q
EOF
grep 20 rlist3 | awk '{print $4}' >! Run19_InjectionRuns
I'm keeping a somewhat up-to-date list here: ~genevb/public/Run19_InjectionRuns
-Gene
»
- genevb's blog
- Login or register to post comments