- genevb's home page
- Posts
- 2025
- 2024
- 2023
- 2022
- September (1)
- 2021
- 2020
- 2019
- December (1)
- October (4)
- September (2)
- August (6)
- July (1)
- June (2)
- May (4)
- April (2)
- March (3)
- February (3)
- 2018
- 2017
- December (1)
- October (3)
- September (1)
- August (1)
- July (2)
- June (2)
- April (2)
- March (2)
- February (1)
- 2016
- November (2)
- September (1)
- August (2)
- July (1)
- June (2)
- May (2)
- April (1)
- March (5)
- February (2)
- January (1)
- 2015
- December (1)
- October (1)
- September (2)
- June (1)
- May (2)
- April (2)
- March (3)
- February (1)
- January (3)
- 2014
- December (2)
- October (2)
- September (2)
- August (3)
- July (2)
- June (2)
- May (2)
- April (9)
- March (2)
- February (2)
- January (1)
- 2013
- December (5)
- October (3)
- September (3)
- August (1)
- July (1)
- May (4)
- April (4)
- March (7)
- February (1)
- January (2)
- 2012
- December (2)
- November (6)
- October (2)
- September (3)
- August (7)
- July (2)
- June (1)
- May (3)
- April (1)
- March (2)
- February (1)
- 2011
- November (1)
- October (1)
- September (4)
- August (2)
- July (4)
- June (3)
- May (4)
- April (9)
- March (5)
- February (6)
- January (3)
- 2010
- December (3)
- November (6)
- October (3)
- September (1)
- August (5)
- July (1)
- June (4)
- May (1)
- April (2)
- March (2)
- February (4)
- January (2)
- 2009
- November (1)
- October (2)
- September (6)
- August (4)
- July (4)
- June (3)
- May (5)
- April (5)
- March (3)
- February (1)
- 2008
- 2005
- October (1)
- My blog
- Post new blog entry
- All blogs
Impact of losing an outer TPC (TPX) sector
Updated on Tue, 2020-02-11 12:08. Originally created by genevb on 2020-02-11 11:39.
This may be moot for now, as there is an effort underway to restore the outer TPC sector 12. Inner TPC (iTPC) sector 12 has already been restored, but it wasn't definite for a while that the old TPX firmware for the outer sector could be re-compiled to make it ignore a stuck trigger bit (shorted wire, most likely). Here are 5 topics to consider:
I processed ~4000 events from 21037018, before sector 12 went out, using all of sector 12 alive, just the outer sector dead, and all of it dead.
Here are plots of the eta vs. phi distribution of all tracks for all three cases (small note that I tried to correct phi from near the primary vertex out to the middle of sector 12 and forgot to wrap around ±π, so the plots go a little past those edges, but the point is clear). One thing to keep in mind is that even when sector 12 is completely absent, low pT tracks that cross through neighboring sectors can still be reconstructed in sector 12's region of phase space.
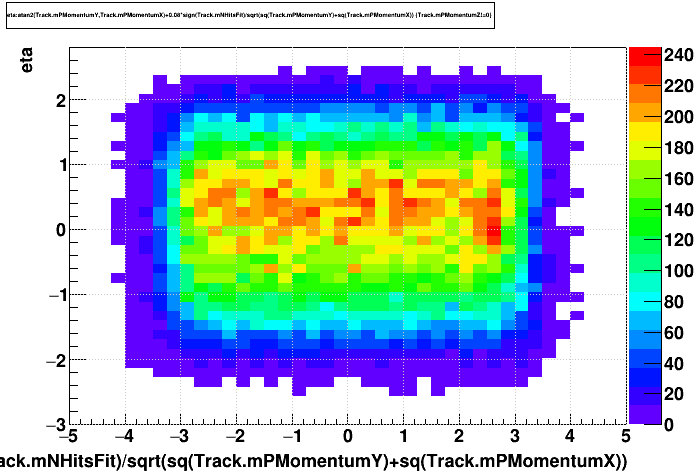
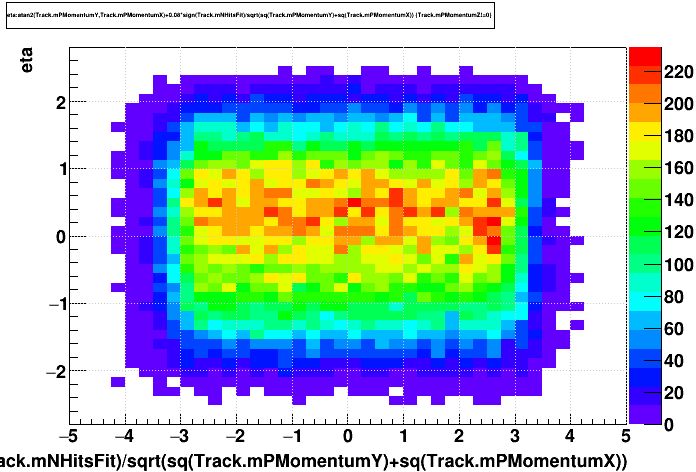
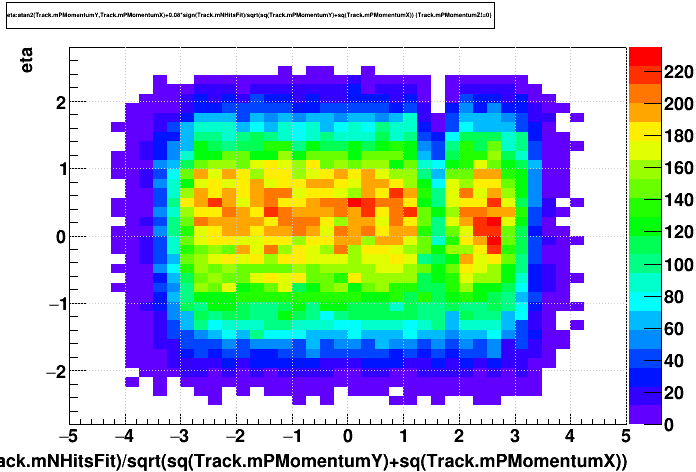
Next are the eta distributions of all primary tracks in one plot (black is all of sector 12 alive, blue is only the inner sector alive, and red is all dead), then eta of only those tracks that are within the (2π)/12 phi window of sector 12, and the last one adds a cut on vertex z > 0.
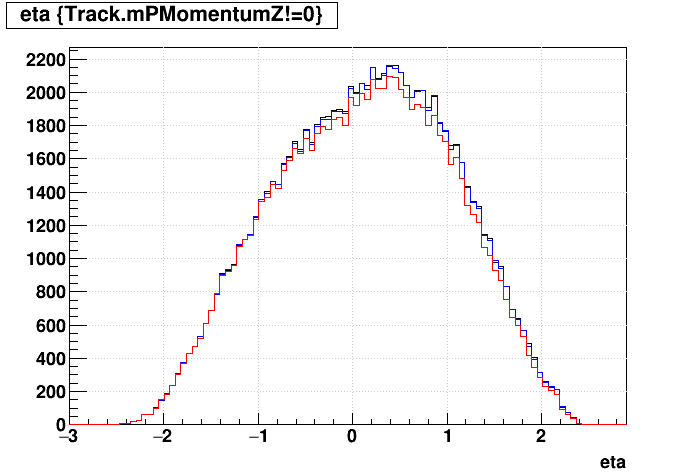
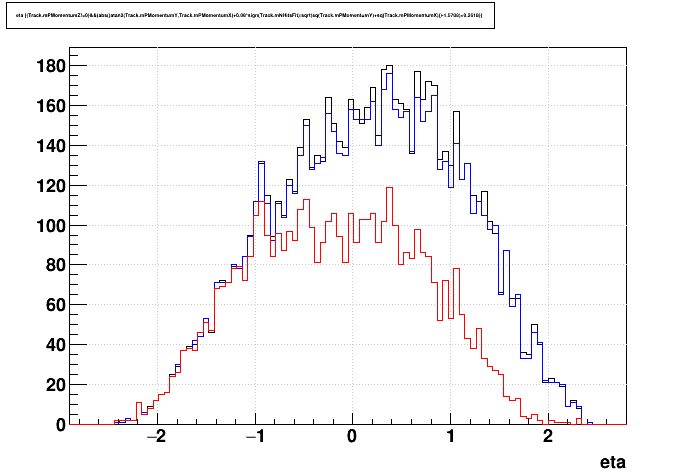
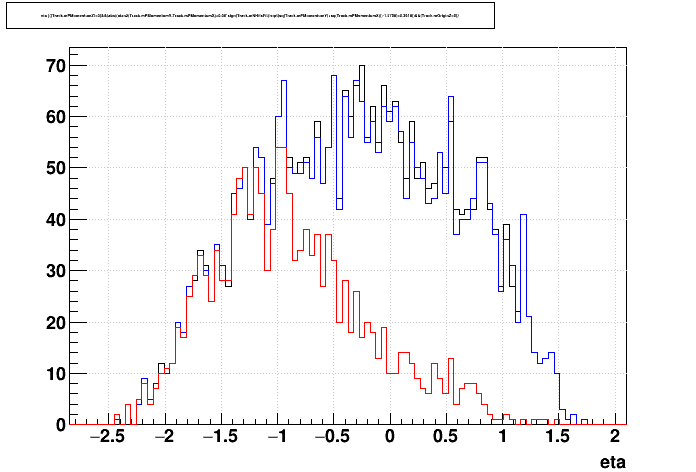
It's clear that having just the inner TPC sector still maintains most of the track reconstruction efficiency of the full sector.
____________
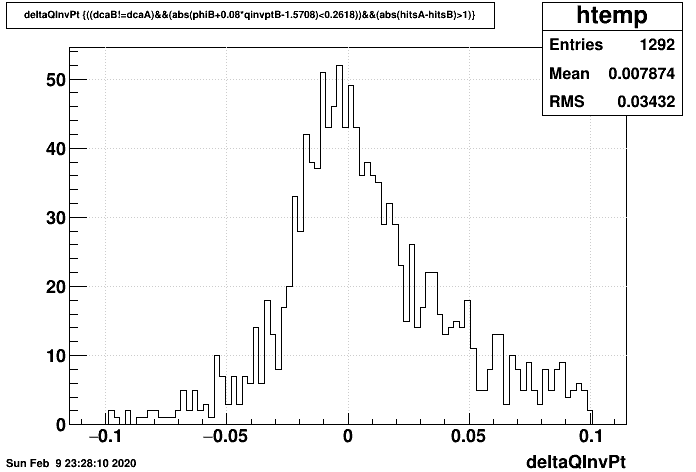
Here is the Δ(q/pT) distribution for impacted, matched global tracks between the full sector, and just the inner sector (keep in mind that global tracks may typically have about 0.02 of intrinsic resolution, and this ~0.034 would be added in quadrature to that):
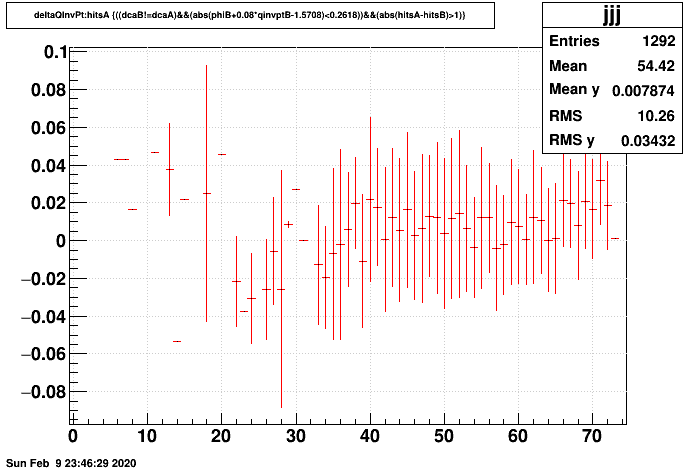
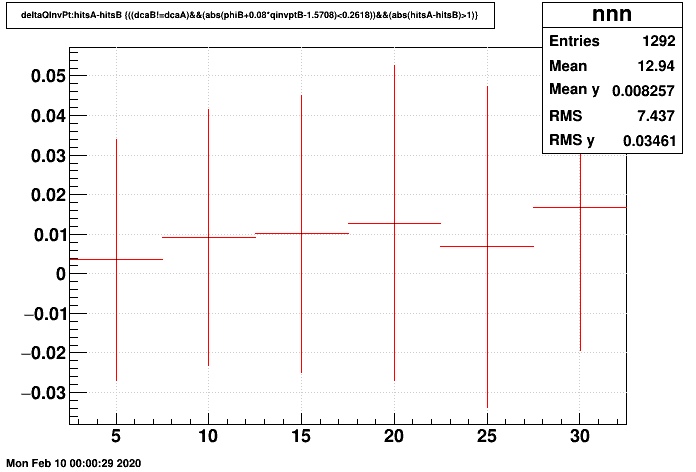
Here is the same quantity vs. Nhits on the original (full sector) track with error bars showing the spread (RMS), and then vs. Δ(Nhits), i.e. how many hits are lost (both show a mild dependence):
____________
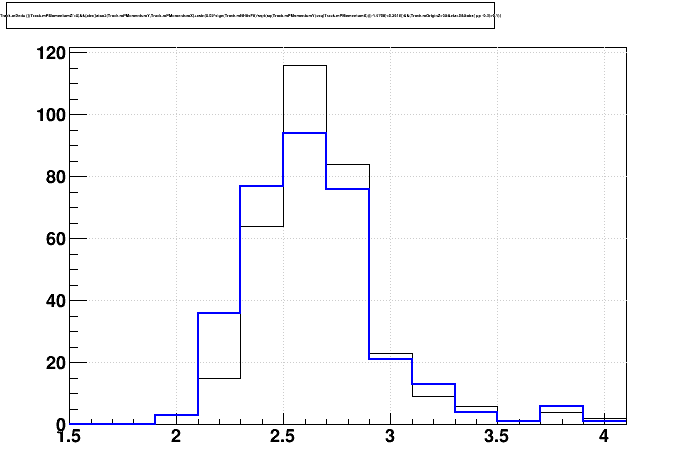
The above does seem to show some smearing. To "see" it a little better, here is the projection onto the dE/dx axis of the distribution in the momentum range [0.2,0.4] GeV/c near the pion band (which is where I had the best statistics), showing in blue that having only half the sector does broaden the distribution over having the full sector in black:
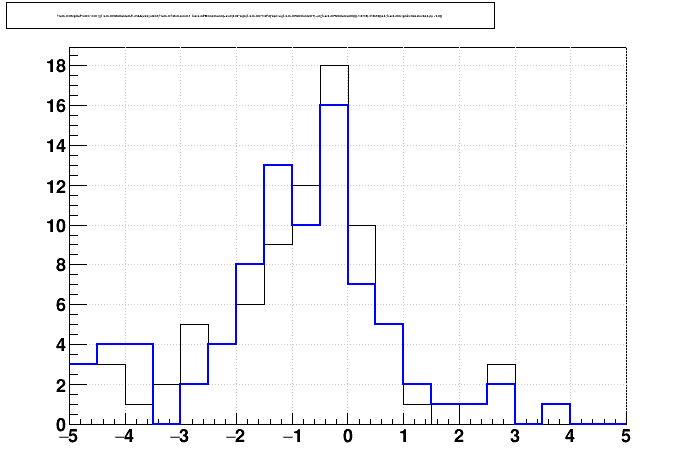
Next I plotted the nσ proton distribution for p < 0.8 GeV/c primary tracks. This doesn't look like there's much broadening, but I don't recall whether the expected width used in the nσ determination takes into account the shortness of the tracks (I would guess that it does):
____________
____________
All BTOF matches:
no sector 12 / all sector 12 = 0.958 ± 0.004
inner sector 12 / all sector 12 = 0.986 ± 0.003
BTOF matches per primary track:
no sector 12 / all sector 12 = 0.986 ± 0.004
inner sector 12 / all sector 12 = 1.001 ± 0.003
BTOF matches per BTOF hit:
no sector 12 / all sector 12 = 0.957 ± 0.004
inner sector 12 / all sector 12 = 0.984 ± 0.003
Keep in mind as a sanity check that 23/24 = 0.958.
Per primary track, having just the inner sector is indistinguishable within these statistics from having the whole sector 12. There is of course the slight reduction in the number of primary tracks I showed earlier.
____________
____________
-Gene
- Reconstruction efficiency
- Momentum resolution
- dE/dx resolution <= I'm not an expert on this; someone else should look more carefully than my clumsy examination
- DCA resolution <= I did not look at this
- BTOF matching
- BTOF timing resolution impacts <= I did not look at this
1. Reconstruction efficiency
I processed ~4000 events from 21037018, before sector 12 went out, using all of sector 12 alive, just the outer sector dead, and all of it dead.
Here are plots of the eta vs. phi distribution of all tracks for all three cases (small note that I tried to correct phi from near the primary vertex out to the middle of sector 12 and forgot to wrap around ±π, so the plots go a little past those edges, but the point is clear). One thing to keep in mind is that even when sector 12 is completely absent, low pT tracks that cross through neighboring sectors can still be reconstructed in sector 12's region of phase space.


Next are the eta distributions of all primary tracks in one plot (black is all of sector 12 alive, blue is only the inner sector alive, and red is all dead), then eta of only those tracks that are within the (2π)/12 phi window of sector 12, and the last one adds a cut on vertex z > 0.


It's clear that having just the inner TPC sector still maintains most of the track reconstruction efficiency of the full sector.
____________
2. Momentum resolution
Here is the Δ(q/pT) distribution for impacted, matched global tracks between the full sector, and just the inner sector (keep in mind that global tracks may typically have about 0.02 of intrinsic resolution, and this ~0.034 would be added in quadrature to that):

Here is the same quantity vs. Nhits on the original (full sector) track with error bars showing the spread (RMS), and then vs. Δ(Nhits), i.e. how many hits are lost (both show a mild dependence):


____________
3. dE/dx resolution
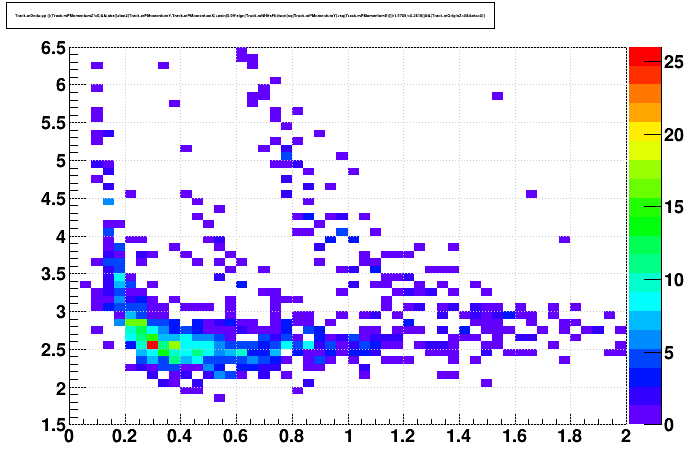
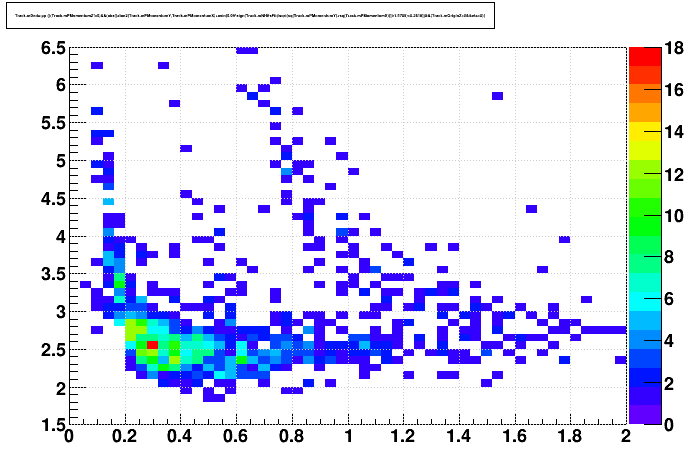
I just plotted dE/dx vs. momentum from the picoDsts for primary tracks with primary vertex z >0, eta >0, and phi in the (2π)/12 window of sector 12 when all of sector 12 is there (left), and when just the inner sector is there (right):

The above does seem to show some smearing. To "see" it a little better, here is the projection onto the dE/dx axis of the distribution in the momentum range [0.2,0.4] GeV/c near the pion band (which is where I had the best statistics), showing in blue that having only half the sector does broaden the distribution over having the full sector in black:

Next I plotted the nσ proton distribution for p < 0.8 GeV/c primary tracks. This doesn't look like there's much broadening, but I don't recall whether the expected width used in the nσ determination takes into account the shortness of the tracks (I would guess that it does):

____________
4. DCA resolution
Unexamined by me.____________
5. BTOF matching
Some quick parsing of the log files:All BTOF matches:
no sector 12 / all sector 12 = 0.958 ± 0.004
inner sector 12 / all sector 12 = 0.986 ± 0.003
BTOF matches per primary track:
no sector 12 / all sector 12 = 0.986 ± 0.004
inner sector 12 / all sector 12 = 1.001 ± 0.003
BTOF matches per BTOF hit:
no sector 12 / all sector 12 = 0.957 ± 0.004
inner sector 12 / all sector 12 = 0.984 ± 0.003
Keep in mind as a sanity check that 23/24 = 0.958.
Per primary track, having just the inner sector is indistinguishable within these statistics from having the whole sector 12. There is of course the slight reduction in the number of primary tracks I showed earlier.
____________
6. BTOF timing resolution impacts
Unexamined by me.____________
-Gene
»
- genevb's blog
- Login or register to post comments
