- genevb's home page
- Posts
- 2025
- 2024
- 2023
- 2022
- September (1)
- 2021
- 2020
- 2019
- 2018
- 2017
- December (1)
- October (3)
- September (1)
- August (1)
- July (2)
- June (2)
- April (2)
- March (2)
- February (1)
- 2016
- November (2)
- September (1)
- August (2)
- July (1)
- June (2)
- May (2)
- April (1)
- March (5)
- February (2)
- January (1)
- 2015
- December (1)
- October (1)
- September (2)
- June (1)
- May (2)
- April (2)
- March (3)
- February (1)
- January (3)
- 2014
- 2013
- 2012
- 2011
- January (3)
- 2010
- February (4)
- 2009
- 2008
- 2005
- October (1)
- My blog
- Post new blog entry
- All blogs
Overlapping root4star process memory use
Updated on Wed, 2019-07-03 14:56. Originally created by genevb on 2019-07-02 15:53.
Using the "used" field from the "free" command, I recorded the total physical memory in use during the running of multiple root4star jobs. This may or may not be the metric we really want to see, but I tried it as an example and to get whatever information we can out of it.
At first I tried starting multiple identical processes simultaneously, but I soon realized that this gets messy with this tool as the processes go through their ramp-up simultaneously and slow each other down with database accesses. With staggered job starting, I also realized that I need to do more than just a few events so that I can get a flat-top from one job before the next one starts.
To that end, I started 3 jobs, each 5 minutes (300 seconds) apart on a generally unused developer node (no other root4star or root.exe processes). I chose 300 seconds because by that time ~125 events had been processed (with ~70 seconds to process the first event [and several seconds before the first event even starts?], and about a half second per event after that) and I expected flat-top to be reached.
The total memory usage time profile for 3 processes can be seen here:
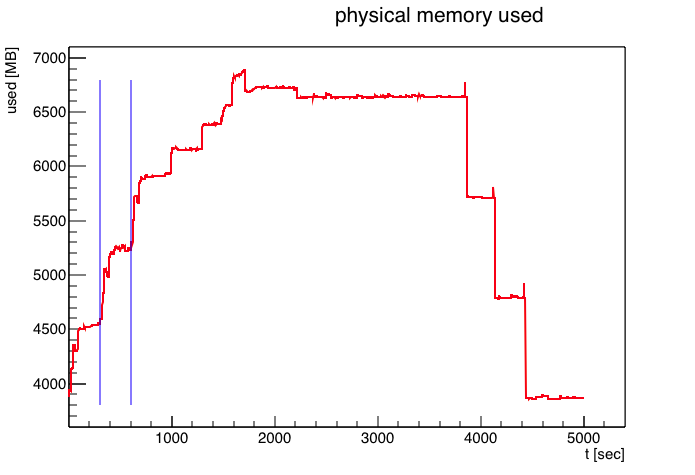
The blue lines show when the second and third jobs started at 300 and 600 seconds respectively. The additional steps at just over 1000, just over 1300, and just over 1600 are also evident. There seem to be some additional jumps in the 1500-2100 time range, which I will not focus on (most likely due to other transient processes running on the node).
I then took the first three 300-second periods (i.e. [0,300], [300,600], [600-900]), subtracted their minimum memory used, and overlaid them. Here is what we get (the blue curve labeled 1 is the first job, then green is the second job's startup, and red is the third job):
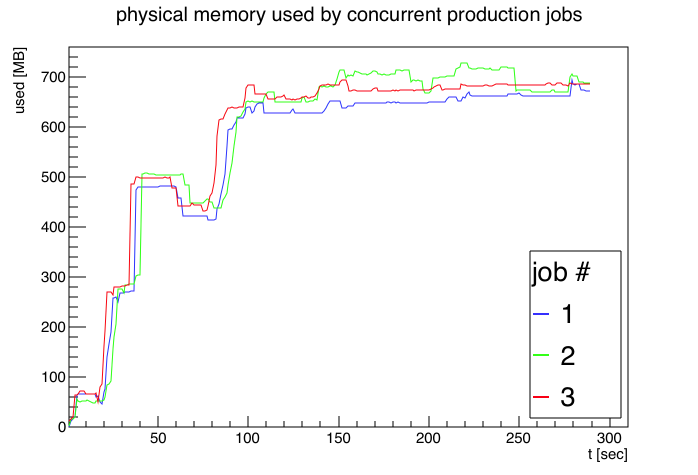
My scheme for overlaying them seemed to work pretty well, getting 3 curves which are very similar. It would seem that by this metric there is no significant memory savings from the shared memory of each root4star job.
-Gene
At first I tried starting multiple identical processes simultaneously, but I soon realized that this gets messy with this tool as the processes go through their ramp-up simultaneously and slow each other down with database accesses. With staggered job starting, I also realized that I need to do more than just a few events so that I can get a flat-top from one job before the next one starts.
To that end, I started 3 jobs, each 5 minutes (300 seconds) apart on a generally unused developer node (no other root4star or root.exe processes). I chose 300 seconds because by that time ~125 events had been processed (with ~70 seconds to process the first event [and several seconds before the first event even starts?], and about a half second per event after that) and I expected flat-top to be reached.
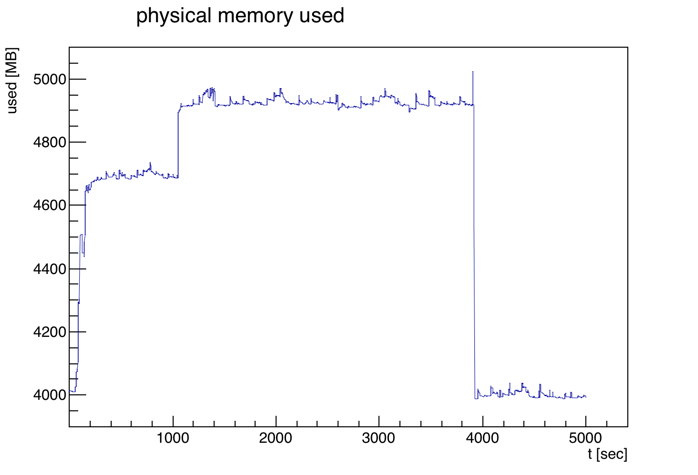
root4star -b -q -l 'bfc.C(2000,"P2019a,StiCA,PicoVtxDefault,BEmcChkStat,OSpaceZ2,OGridLeakFull,
  -OPr13,OPr40,-hitfilt,-beamline3D","/tmp/genevb/st_physics_20161026_raw_1000002.daq")'
Before showing the 3 process memory usage time profile, here it is for a single process (I had to run this a few times to get something that didn't show unusual bumps in the middle due to other jobs running as I was not using an isolated node). The process takes a little over an hour. There is an additional increase in memory used just after 1000 events, but I should be able to look at the first 300 seconds without worrying about that.
The total memory usage time profile for 3 processes can be seen here:
The blue lines show when the second and third jobs started at 300 and 600 seconds respectively. The additional steps at just over 1000, just over 1300, and just over 1600 are also evident. There seem to be some additional jumps in the 1500-2100 time range, which I will not focus on (most likely due to other transient processes running on the node).
I then took the first three 300-second periods (i.e. [0,300], [300,600], [600-900]), subtracted their minimum memory used, and overlaid them. Here is what we get (the blue curve labeled 1 is the first job, then green is the second job's startup, and red is the third job):
My scheme for overlaying them seemed to work pretty well, getting 3 curves which are very similar. It would seem that by this metric there is no significant memory savings from the shared memory of each root4star job.
-Gene
»
- genevb's blog
- Login or register to post comments