- genevb's home page
- Posts
- 2025
- 2024
- 2023
- 2022
- September (1)
- 2021
- 2020
- 2019
- 2018
- 2017
- December (1)
- October (3)
- September (1)
- August (1)
- July (2)
- June (2)
- April (2)
- March (2)
- February (1)
- 2016
- November (2)
- September (1)
- August (2)
- July (1)
- June (2)
- May (2)
- April (1)
- March (5)
- February (2)
- January (1)
- 2015
- December (1)
- October (1)
- September (2)
- June (1)
- May (2)
- April (2)
- March (3)
- February (1)
- January (3)
- 2014
- 2013
- 2012
- 2011
- January (3)
- 2010
- February (4)
- 2009
- 2008
- 2005
- October (1)
- My blog
- Post new blog entry
- All blogs
Run 12 UU h-/h+ vs. luminosity (old/new alignment)
Updated on Wed, 2014-10-29 12:57. Originally created by genevb on 2014-10-28 18:45.
(Note: these data were shown at a You do not have access to view this node, and summarized in this PDF)
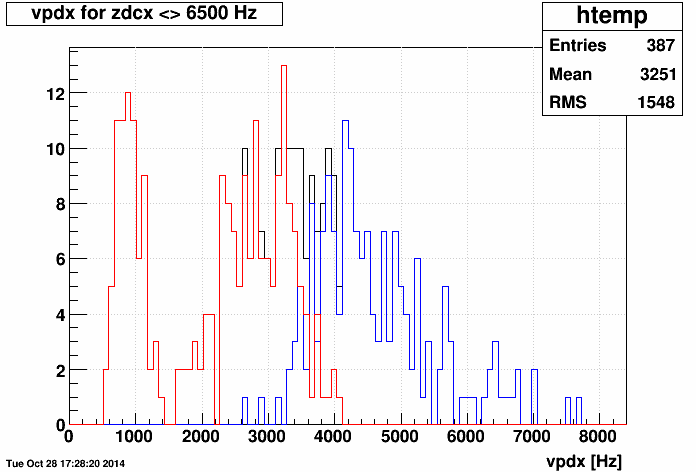
Following up on my You do not have access to view this node with Rihan's data, and particularly this analysis, Yuri suggested repeating the analysis as a function of luminosity under the hypothesis that some of the sector-by-sector variation may be due to varying SpaceCharge. I proposed to divide the UU into two samples, low and high luminosity, to see if the variations showed luminosity dependence. To that end, I split the runs into those with ZDC coincidence rates below and above 6.5 kHz (with <zdcx>low lumi = 3.9 kHz, and <zdcx>high lumi = 8.5 kHz). In case the VPD coincidence rate is the better luminosity meaure (zdcx and vpdx are pretty similar, but not exactly the same), here's a plot of the low (red) and high (blue) luminosity samples vpdx distributions (<vpdx>low lumi = 2.2 kHz, <vpdx>high lumi = 4.6 kHz):
Rihan posted his results here. I took his h-/h+ histograms, selected a reference (west-side phi-integrated primaries, new alignment, all luminosities), divided each of the individual sector histograms by the reference, and then fit to A (1 + B pT2) over pT = [1.0,3.6] GeV/c. Here are the fits (red/blue is old/new alignment, open/solid symbols is globals/primaries):
(click on the images for a PDF, or open in a new browser window/tab for a larger PNG)
low luminosity: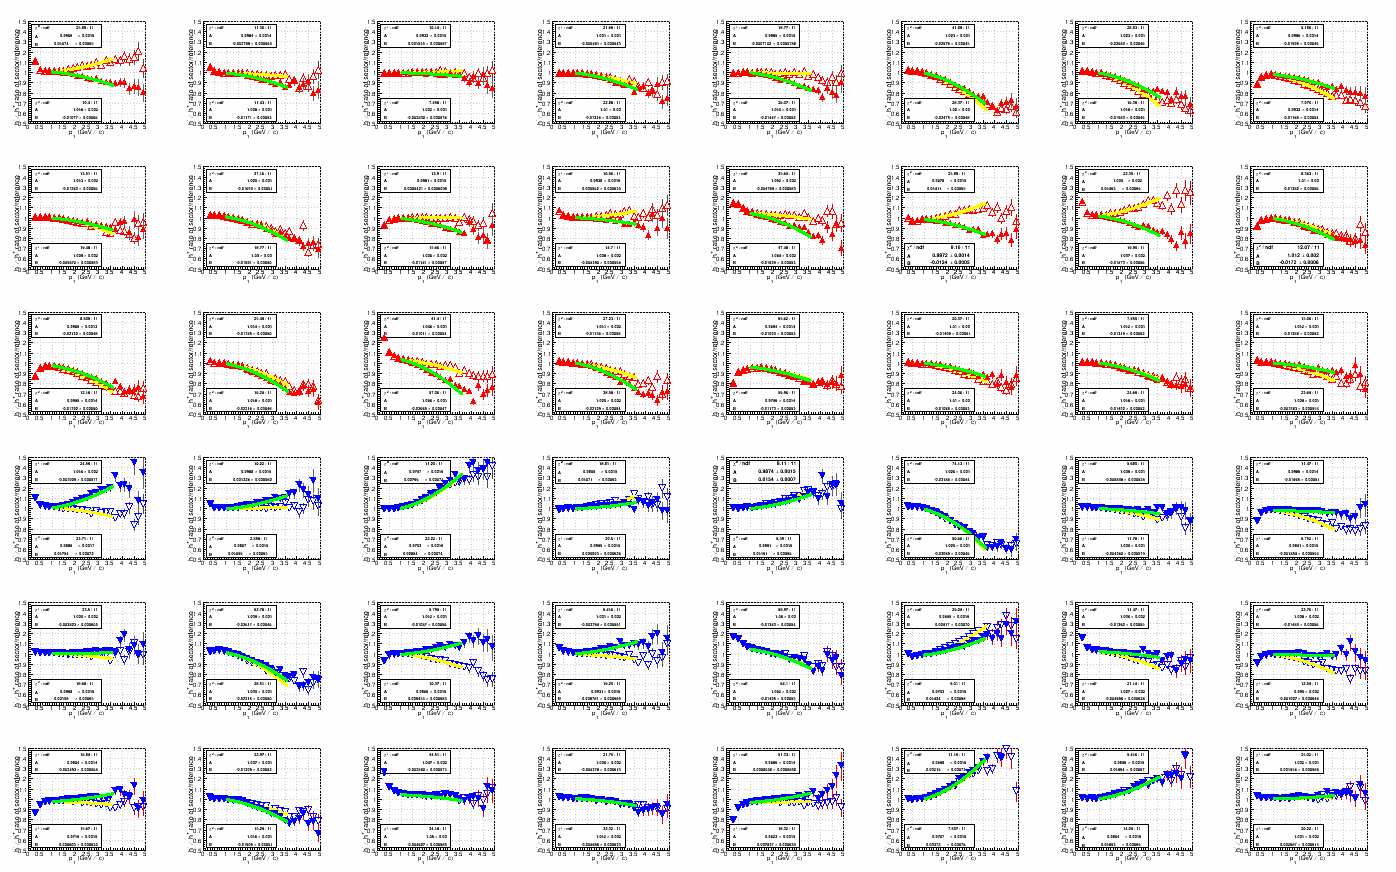 and high luminosity:
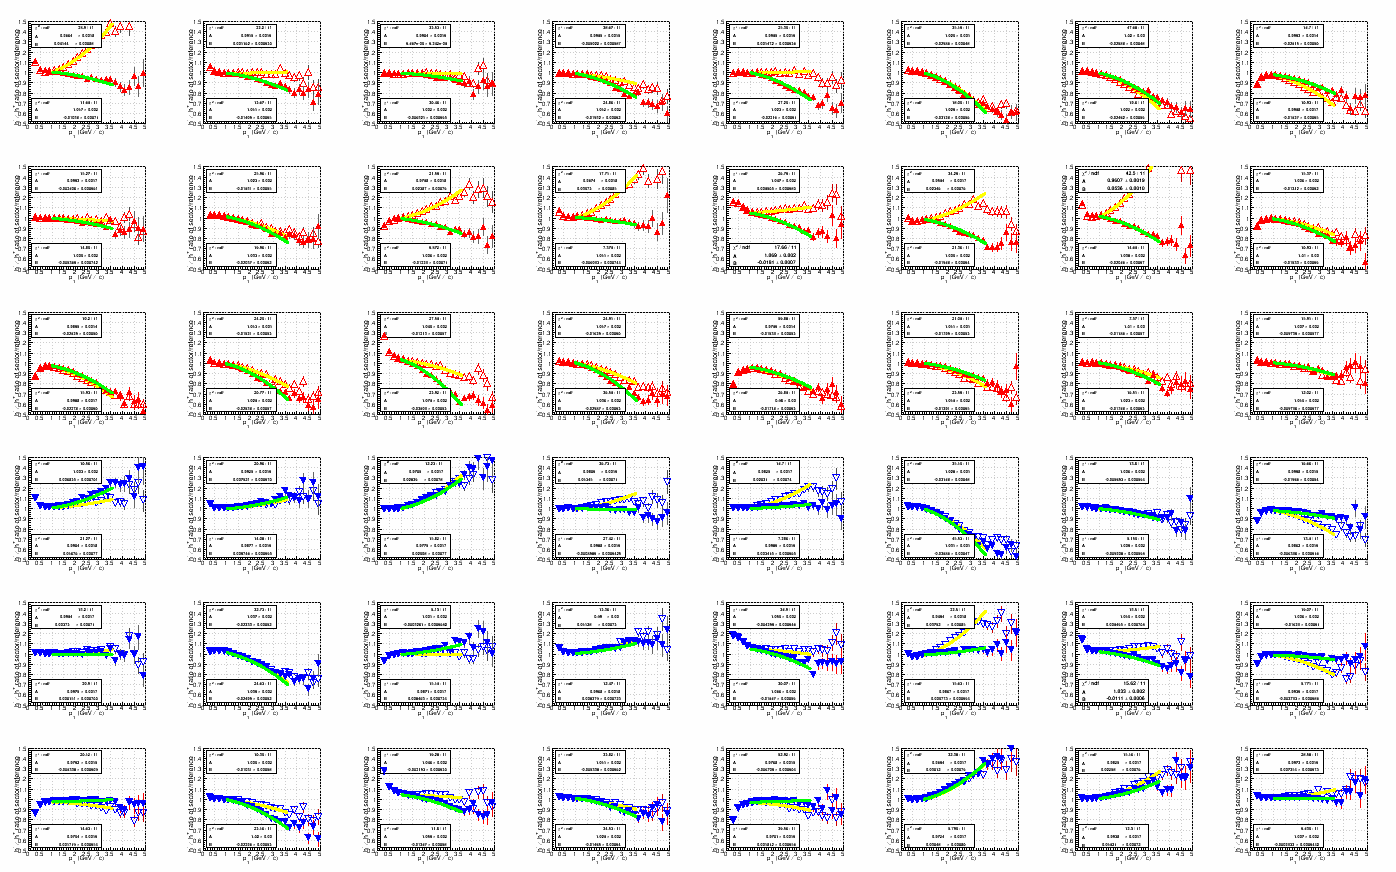
Here are the distributions of B:
(again, if images are too small, open in a new browser window/tab for a larger PNG)
low luminosity: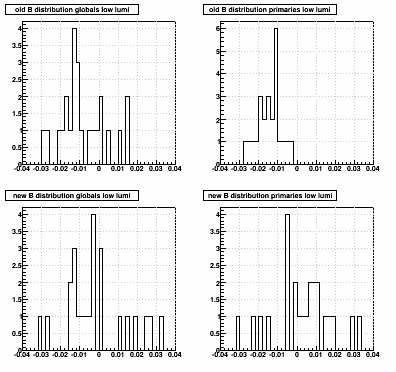 and high luminosity:
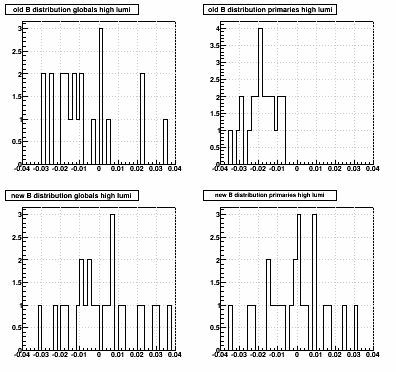
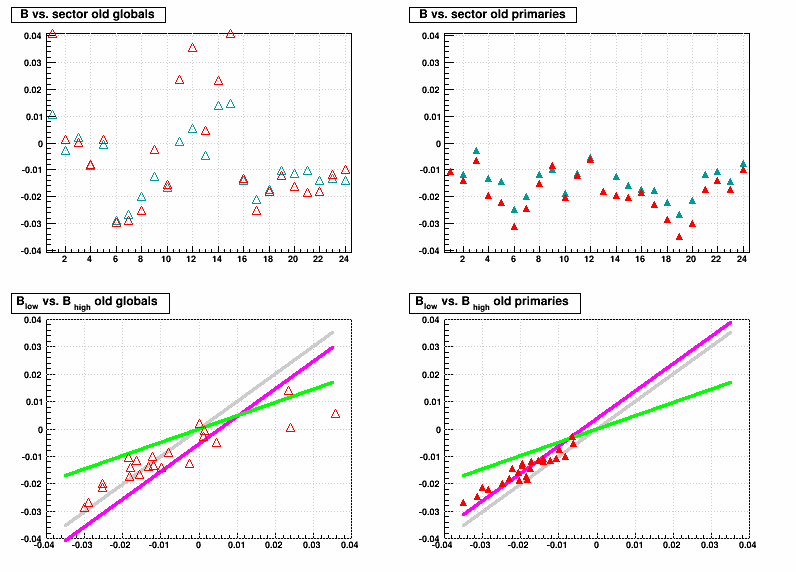
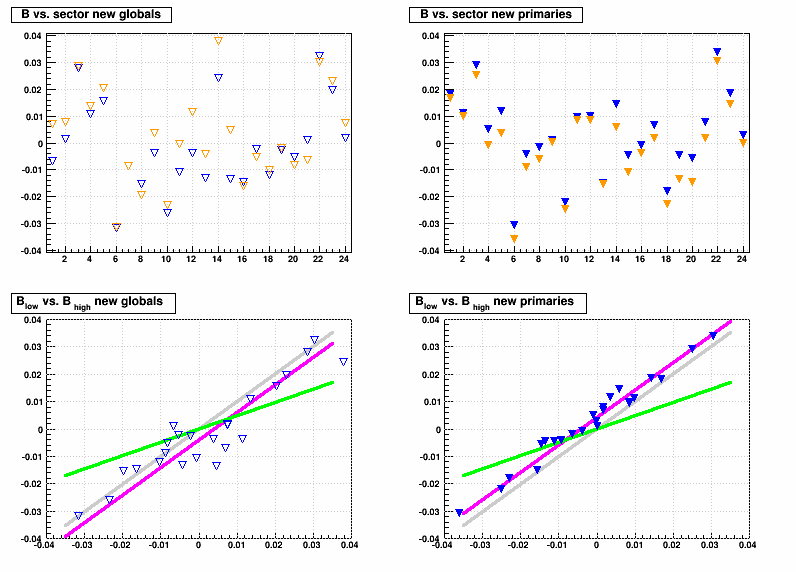
Next are B vs. sector for low (cyan/blue) and high (red/orange) luminosity globals/primaries (open/solid symbols), along with Blow lumi vs. Bhigh lumi for each of the 24 sectors. The grey lines are meant to show a 1:1 match between low and high luminosity. The green lines show the distribution one would expect to see if the sector-by-sector variation is something which depends on luminosity, and the magenta lines show what one could expect if the SpaceCharge & GridLeak calibrations do not perfectly capture the luminosity dependence for the TPC as a whole (i.e. all sectors shift, where in this case I actually fit an offset so that the magenta lines match the data well). It is clear that bulk of the sector-by-sector dependence is unchanged by luminosity, though there may be some slight miscalibration of the SpaceCharge & GridLeak luminosity dependence.
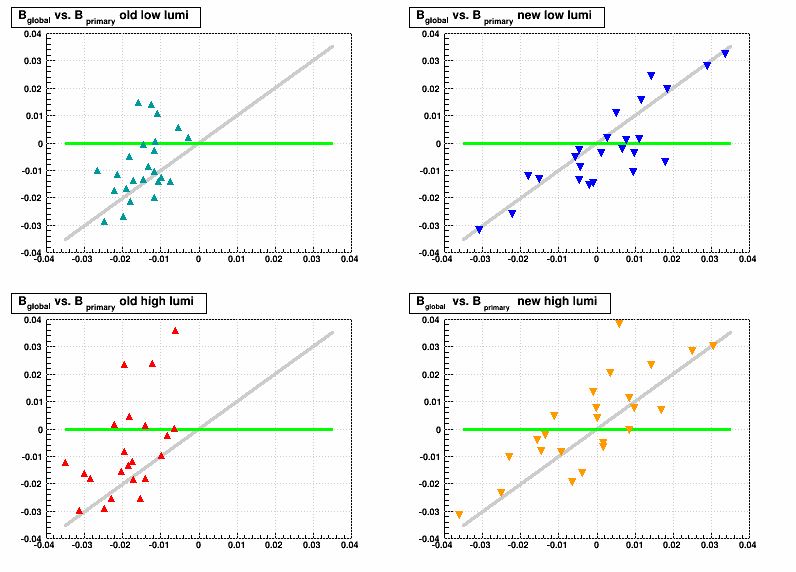
Here are Bglobal vs. Bprimary for the different alignments and luminosities. The gray line illustrates the expected trend if global and primary tracks were similarly distorted, as would be the case for good super-sector alignment but faulty internal sector alignment. The green line illustrates the expected trend for distorted primaries and undistorted globals, as would be the case for good internal alignment but faulty super-sector alignment. With the new alignment, the trends seem to indicate that the variance is in the internal sector alignment. Faults with the old alignment are less easily interpreted as the variance in primaries is actually less than globals. Perhaps this is a result of super-sector alignment which compensates for internal sector alignment flaws to some degree.
Tangentially, this data lets me look at another expected feature: effects of observed sector-by-sector GL variance (see slide 9 of You do not have access to view this node). An improperly corrected GridLeak distortion should be seen as a luminosity dependent distortion for global tracks in any given sector. The math goes as follows...
Bsector = C * Δ(GL)sector * L + Dsector
where L is luminosity, and Dsector represents static distortions like alignment, and C is some coefficient. It then follows that...
(Bhigh - Blow)sector = C * Δ(GL)sector * (Lhigh - Llow)
and since Lhigh and Llow are the same for all sectors,
(Bhigh - Blow)sector ∝ Δ(GL)sector = GLsector - GLglobal
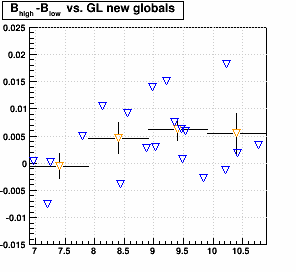
In this case, GLglobal = 7.15 was used to reconstruct the data. Variations in GLsector should appear linearly in (Bhigh - Blow)sector, and here is the plot using new alignment globals (blue symbols are individual sectors, orange symbols are a binned profile). The data do not strongly show such a correlation, but a mild correlation may be present.
-Gene
Following up on my You do not have access to view this node with Rihan's data, and particularly this analysis, Yuri suggested repeating the analysis as a function of luminosity under the hypothesis that some of the sector-by-sector variation may be due to varying SpaceCharge. I proposed to divide the UU into two samples, low and high luminosity, to see if the variations showed luminosity dependence. To that end, I split the runs into those with ZDC coincidence rates below and above 6.5 kHz (with <zdcx>low lumi = 3.9 kHz, and <zdcx>high lumi = 8.5 kHz). In case the VPD coincidence rate is the better luminosity meaure (zdcx and vpdx are pretty similar, but not exactly the same), here's a plot of the low (red) and high (blue) luminosity samples vpdx distributions (<vpdx>low lumi = 2.2 kHz, <vpdx>high lumi = 4.6 kHz):
Rihan posted his results here. I took his h-/h+ histograms, selected a reference (west-side phi-integrated primaries, new alignment, all luminosities), divided each of the individual sector histograms by the reference, and then fit to A (1 + B pT2) over pT = [1.0,3.6] GeV/c. Here are the fits (red/blue is old/new alignment, open/solid symbols is globals/primaries):
(click on the images for a PDF, or open in a new browser window/tab for a larger PNG)
low luminosity:
and high luminosity:Here are the distributions of B:
(again, if images are too small, open in a new browser window/tab for a larger PNG)
low luminosity:
and high luminosity:Next are B vs. sector for low (cyan/blue) and high (red/orange) luminosity globals/primaries (open/solid symbols), along with Blow lumi vs. Bhigh lumi for each of the 24 sectors. The grey lines are meant to show a 1:1 match between low and high luminosity. The green lines show the distribution one would expect to see if the sector-by-sector variation is something which depends on luminosity, and the magenta lines show what one could expect if the SpaceCharge & GridLeak calibrations do not perfectly capture the luminosity dependence for the TPC as a whole (i.e. all sectors shift, where in this case I actually fit an offset so that the magenta lines match the data well). It is clear that bulk of the sector-by-sector dependence is unchanged by luminosity, though there may be some slight miscalibration of the SpaceCharge & GridLeak luminosity dependence.
Here are Bglobal vs. Bprimary for the different alignments and luminosities. The gray line illustrates the expected trend if global and primary tracks were similarly distorted, as would be the case for good super-sector alignment but faulty internal sector alignment. The green line illustrates the expected trend for distorted primaries and undistorted globals, as would be the case for good internal alignment but faulty super-sector alignment. With the new alignment, the trends seem to indicate that the variance is in the internal sector alignment. Faults with the old alignment are less easily interpreted as the variance in primaries is actually less than globals. Perhaps this is a result of super-sector alignment which compensates for internal sector alignment flaws to some degree.
Tangentially, this data lets me look at another expected feature: effects of observed sector-by-sector GL variance (see slide 9 of You do not have access to view this node). An improperly corrected GridLeak distortion should be seen as a luminosity dependent distortion for global tracks in any given sector. The math goes as follows...
Bsector = C * Δ(GL)sector * L + Dsector
where L is luminosity, and Dsector represents static distortions like alignment, and C is some coefficient. It then follows that...
(Bhigh - Blow)sector = C * Δ(GL)sector * (Lhigh - Llow)
and since Lhigh and Llow are the same for all sectors,
(Bhigh - Blow)sector ∝ Δ(GL)sector = GLsector - GLglobal
In this case, GLglobal = 7.15 was used to reconstruct the data. Variations in GLsector should appear linearly in (Bhigh - Blow)sector, and here is the plot using new alignment globals (blue symbols are individual sectors, orange symbols are a binned profile). The data do not strongly show such a correlation, but a mild correlation may be present.
-Gene
»
- genevb's blog
- Login or register to post comments