- genevb's home page
- Posts
- 2025
- 2024
- 2023
- 2022
- September (1)
- 2021
- 2020
- 2019
- 2018
- 2017
- December (1)
- October (3)
- September (1)
- August (1)
- July (2)
- June (2)
- April (2)
- March (2)
- February (1)
- 2016
- November (2)
- September (1)
- August (2)
- July (1)
- June (2)
- May (2)
- April (1)
- March (5)
- February (2)
- January (1)
- 2015
- December (1)
- October (1)
- September (2)
- June (1)
- May (2)
- April (2)
- March (3)
- February (1)
- January (3)
- 2014
- 2013
- 2012
- 2011
- January (3)
- 2010
- February (4)
- 2009
- 2008
- 2005
- October (1)
- My blog
- Post new blog entry
- All blogs
Run 17 beam positions
Updated on Fri, 2019-10-18 23:14. Originally created by genevb on 2019-10-17 12:25.
In hopes of finding some causal correlation with fill-by-fill variations in the high-pT ratios of global tracks in Run 17 pp510 data, I looked for possible clues in the beam position data.
To begin, here is a metric of the fill-by-fill ratio determined using data provided by Jae Nam. I fit a simple exponential to the ratio (equivalent to a 1st order polynomial to the log of the ratio) over the pT range [3.0,15.0] GeV/c, using the value of the function at 9.0 GeV/c as its magnitude parameter so that I would get that value directly with an error. I then plotted log10 of that ratio value vs. fill for the three cases Jae examined: without PID cuts, with pion PID cuts, and with electron PID cuts, only for those fills where the error on the ratio was less than 0.1, to avoid cluttering the plot. The general trends are present in all three:
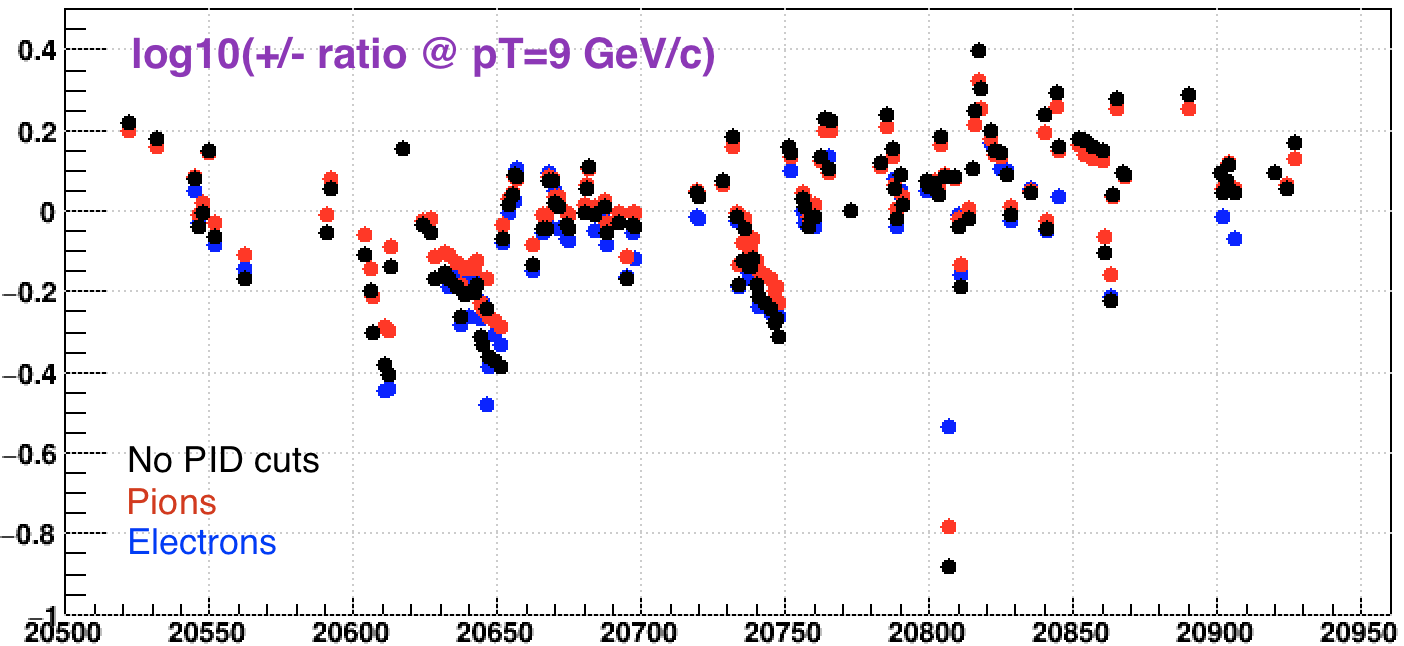
As a highlight, fills 20649 and 20654 show very clear differences while being recorded with very nearly the same luminosity:
(note: this table is the +/- ratio, not log10 of that ratio as shown in the above plot)
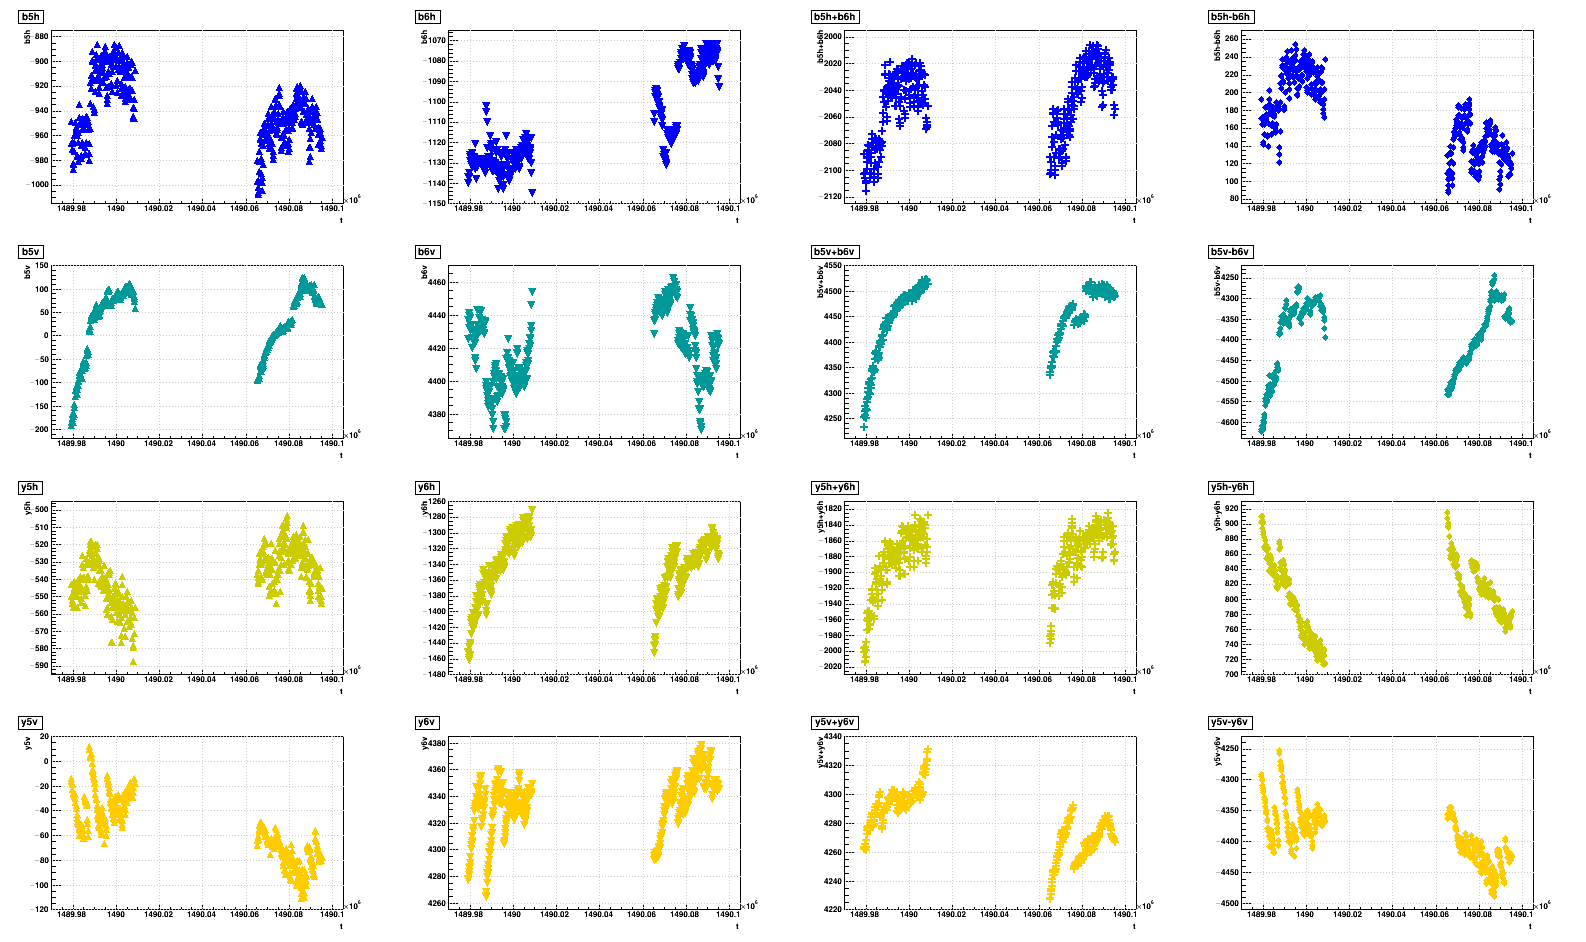
The beam positions in these two fills using C-AD's Beam Position Monitors (BPMs) is shown below versus unix time [sec], where the 4 rows are (from top to bottom):
My own thoughts are that there are no clear smoking guns in the above that one might associate with the +/- ratio differences between those two fills.
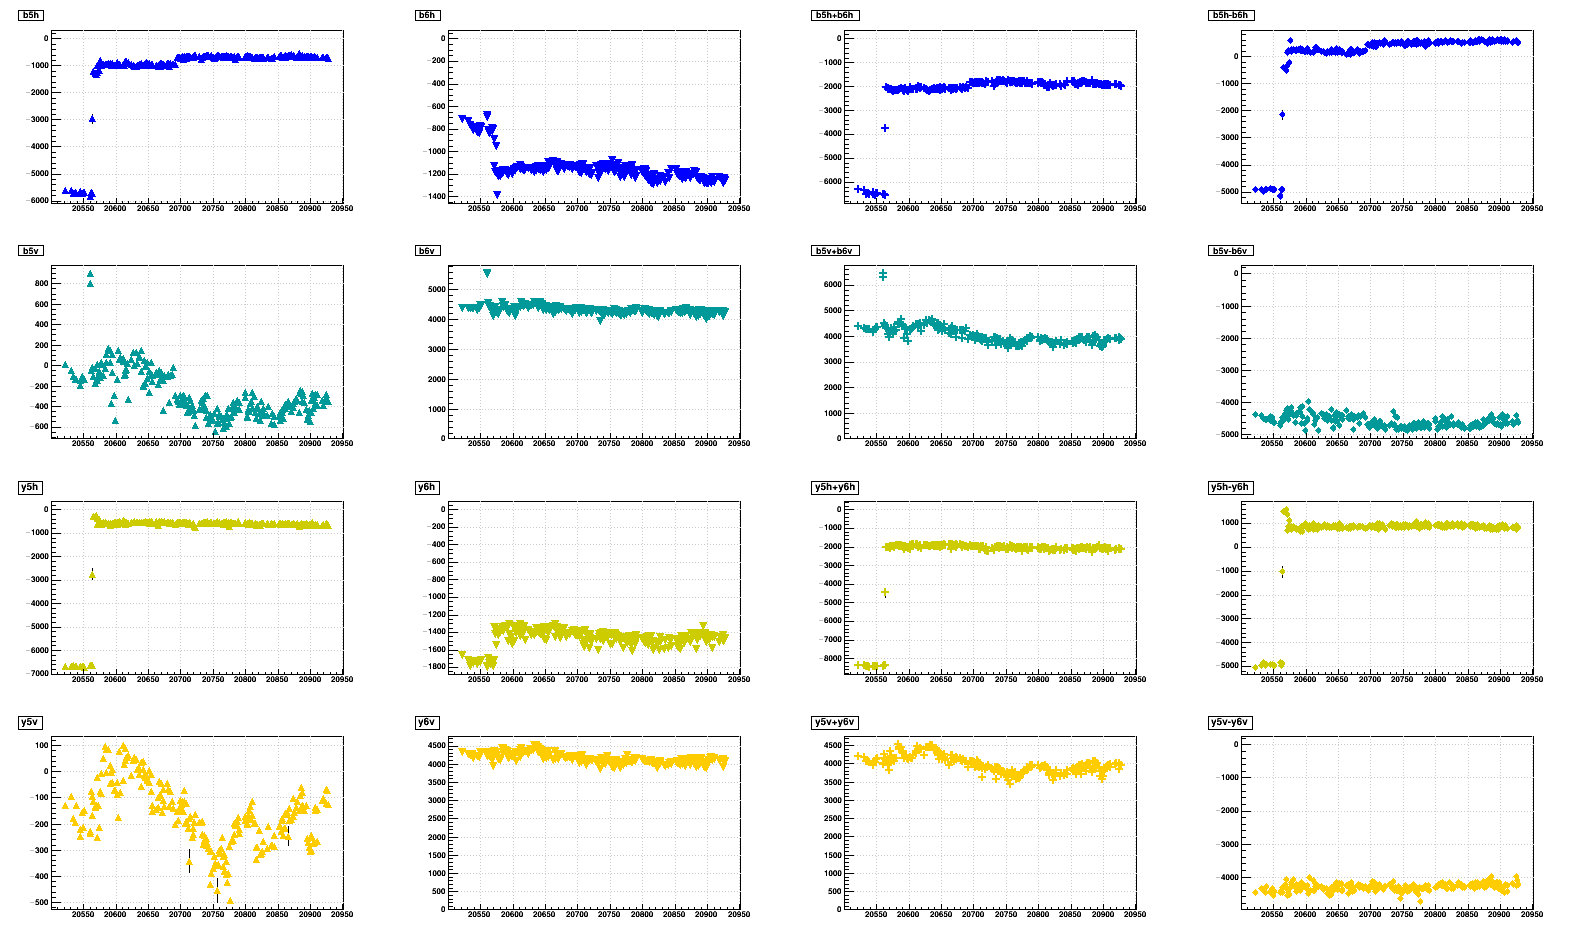
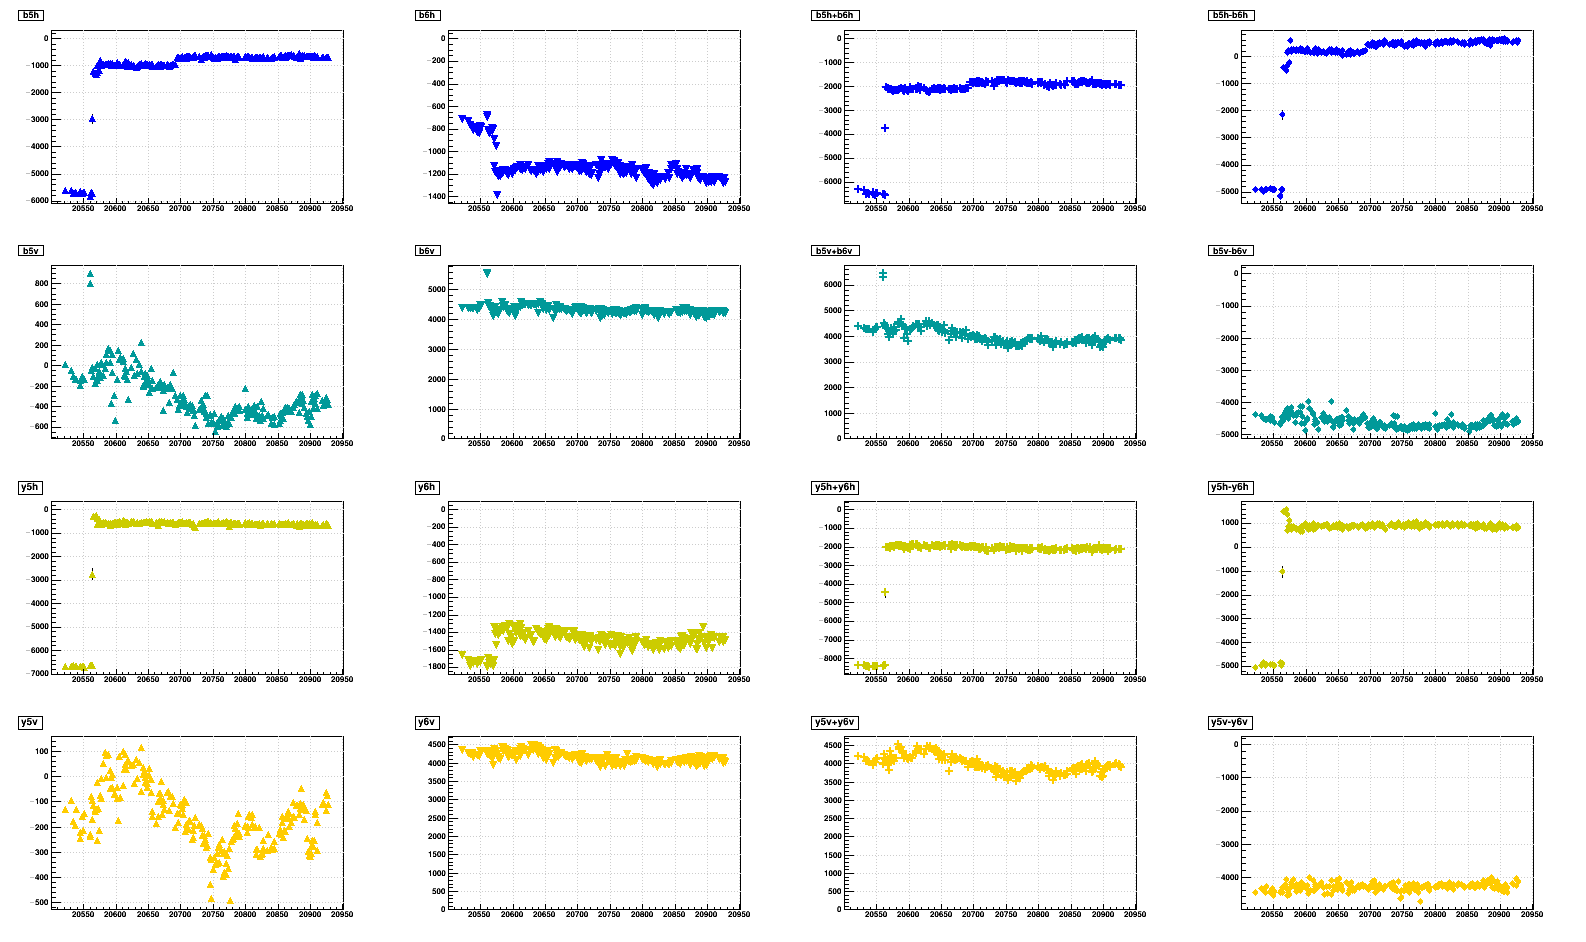
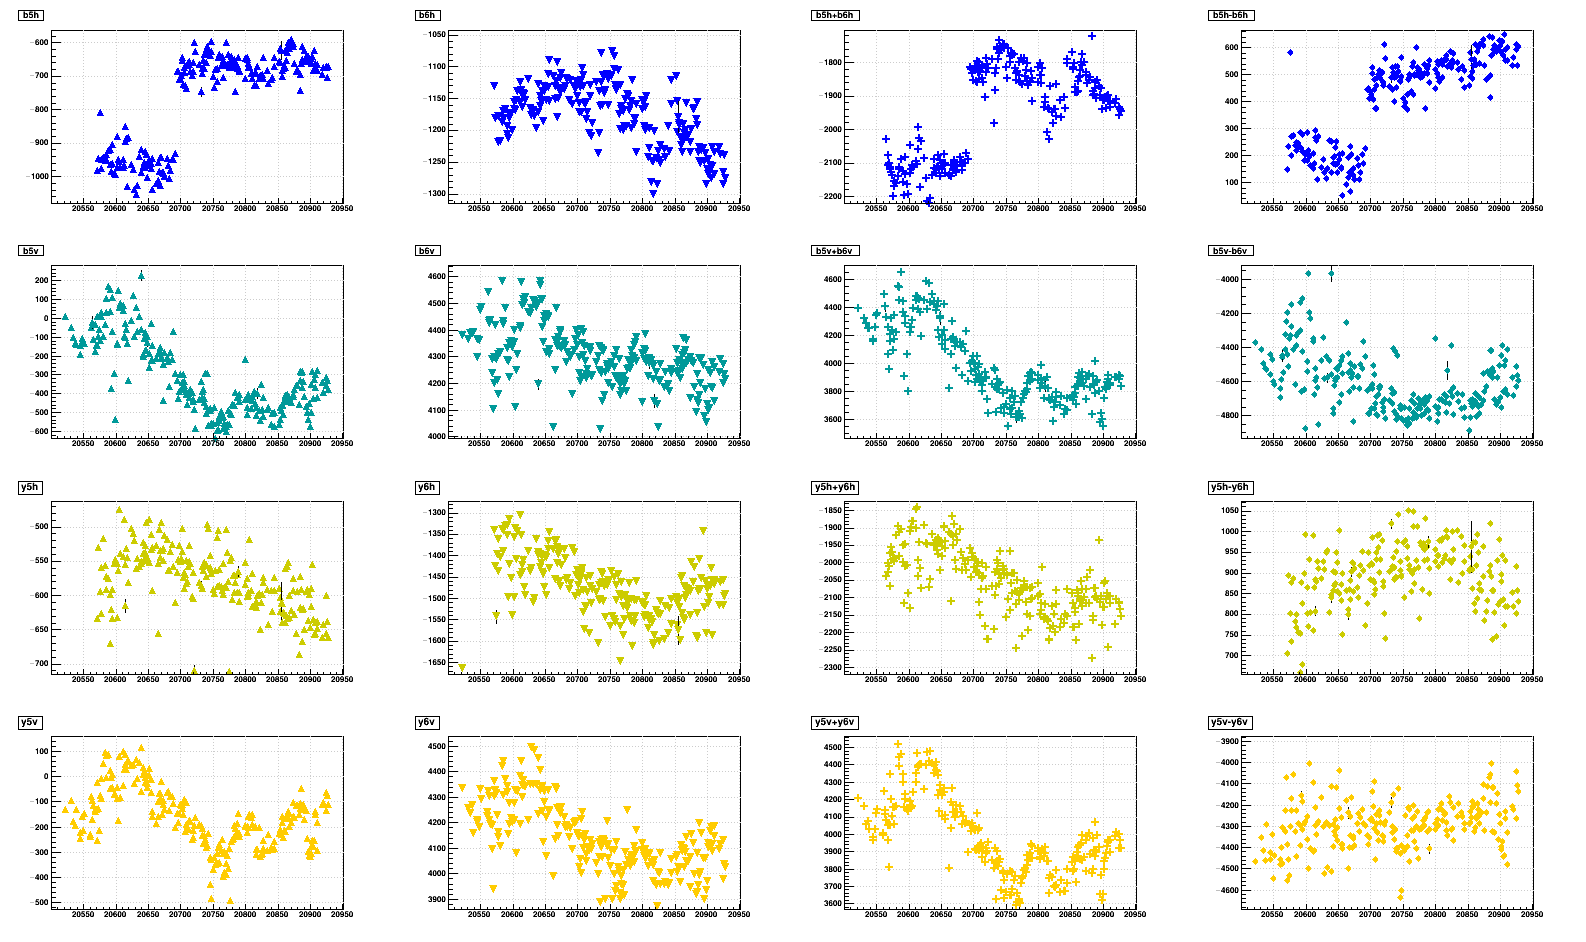
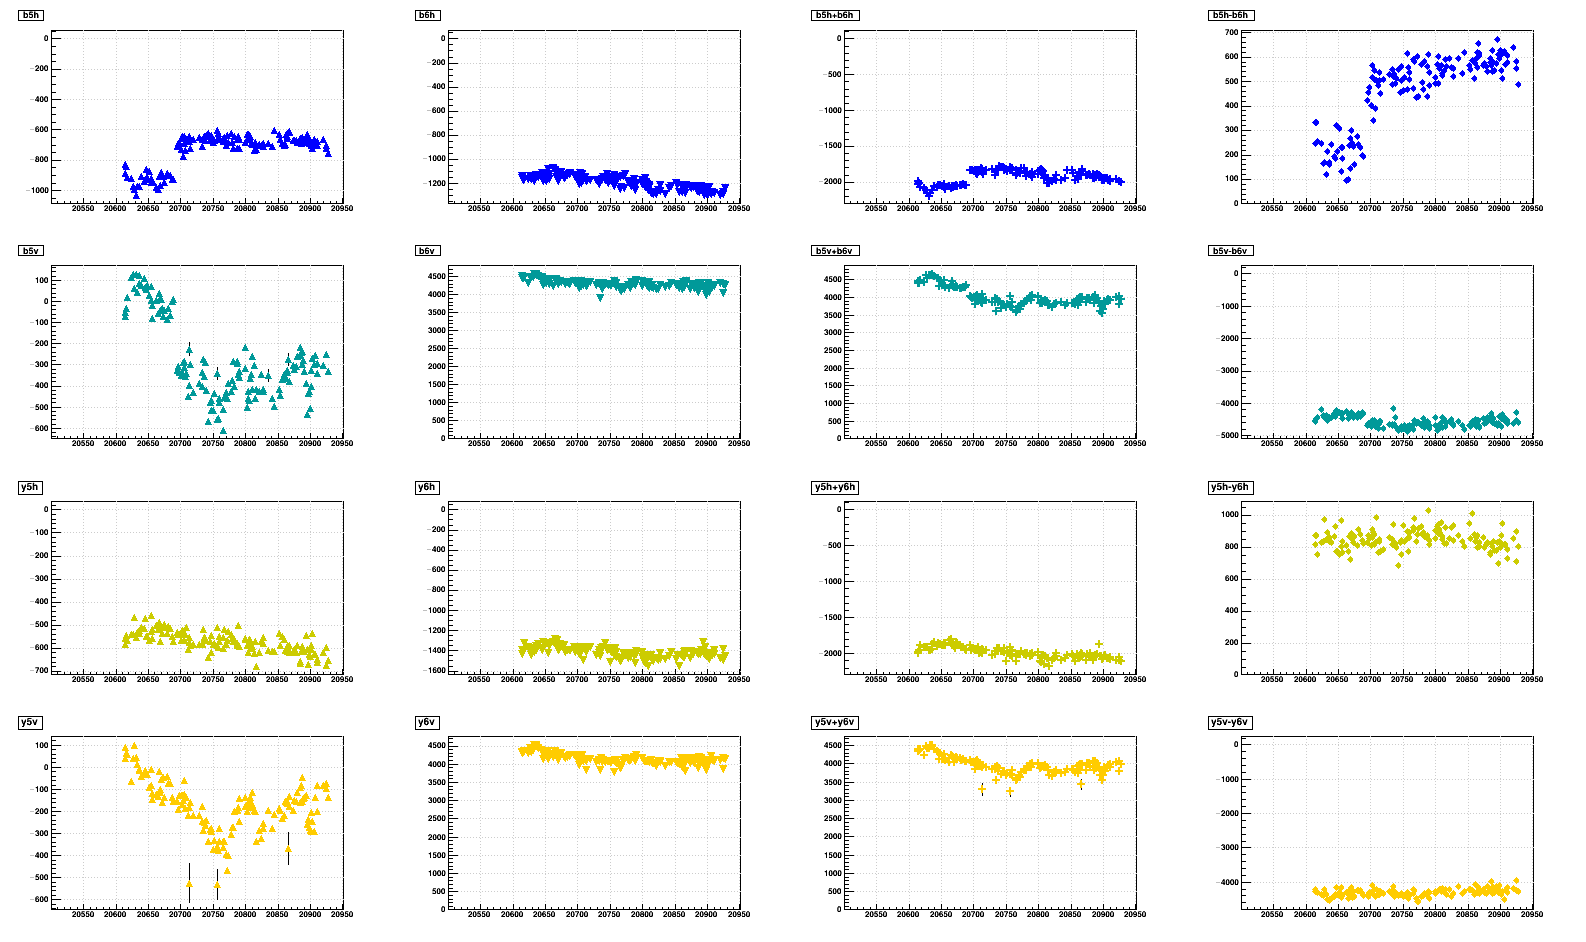
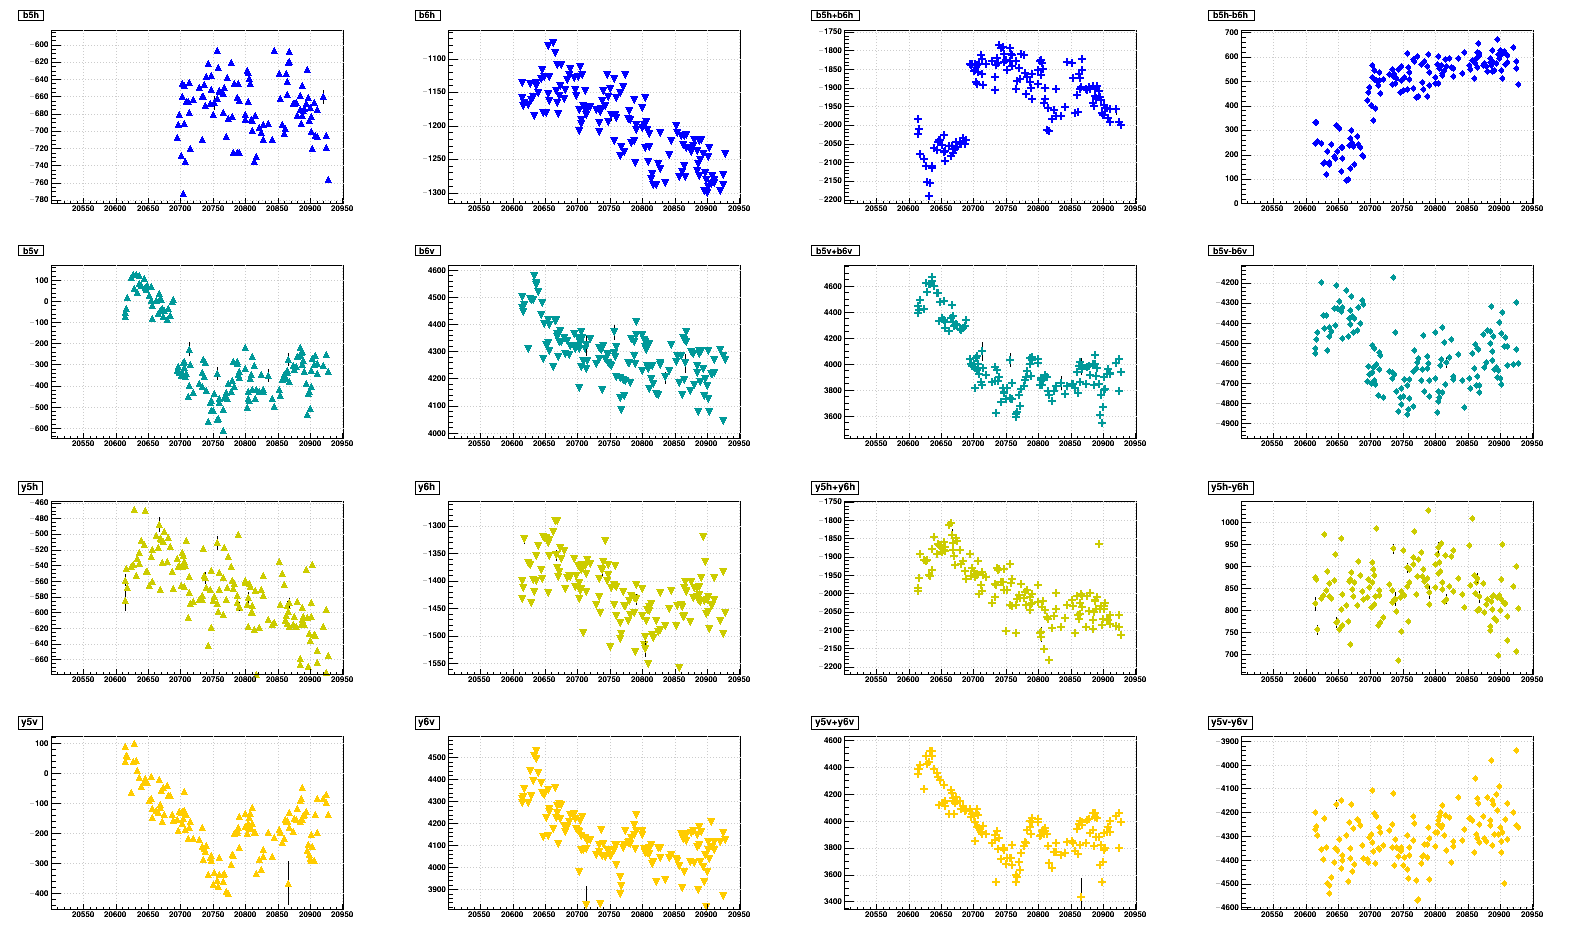
For a more complete picture, I show below three additional sets of data where I plot versus fill number over the range of fills in Jae's analysis (I have not been careful to exclude fills within that range that were not included in his analysis), taking the mean position for each entire fill. The first 16-plot set in each pair is showing all data, while the second 16-plot set in each pair has the vertical axis zoomed in on the bulk of the data (I did this by-hand) to help look at any trends that may match the +/- ratio data shown earlier. There are three pairs of 16-plot sets: the first plot set pair shows entire fills, while the second and third plot set pairs show the "pre-β*-squeeze" portion of the fills' data, and the "post-β*-squeeze" portion (which is determinable from the "beam state" in the BPM data) respectively.
Entire fills:
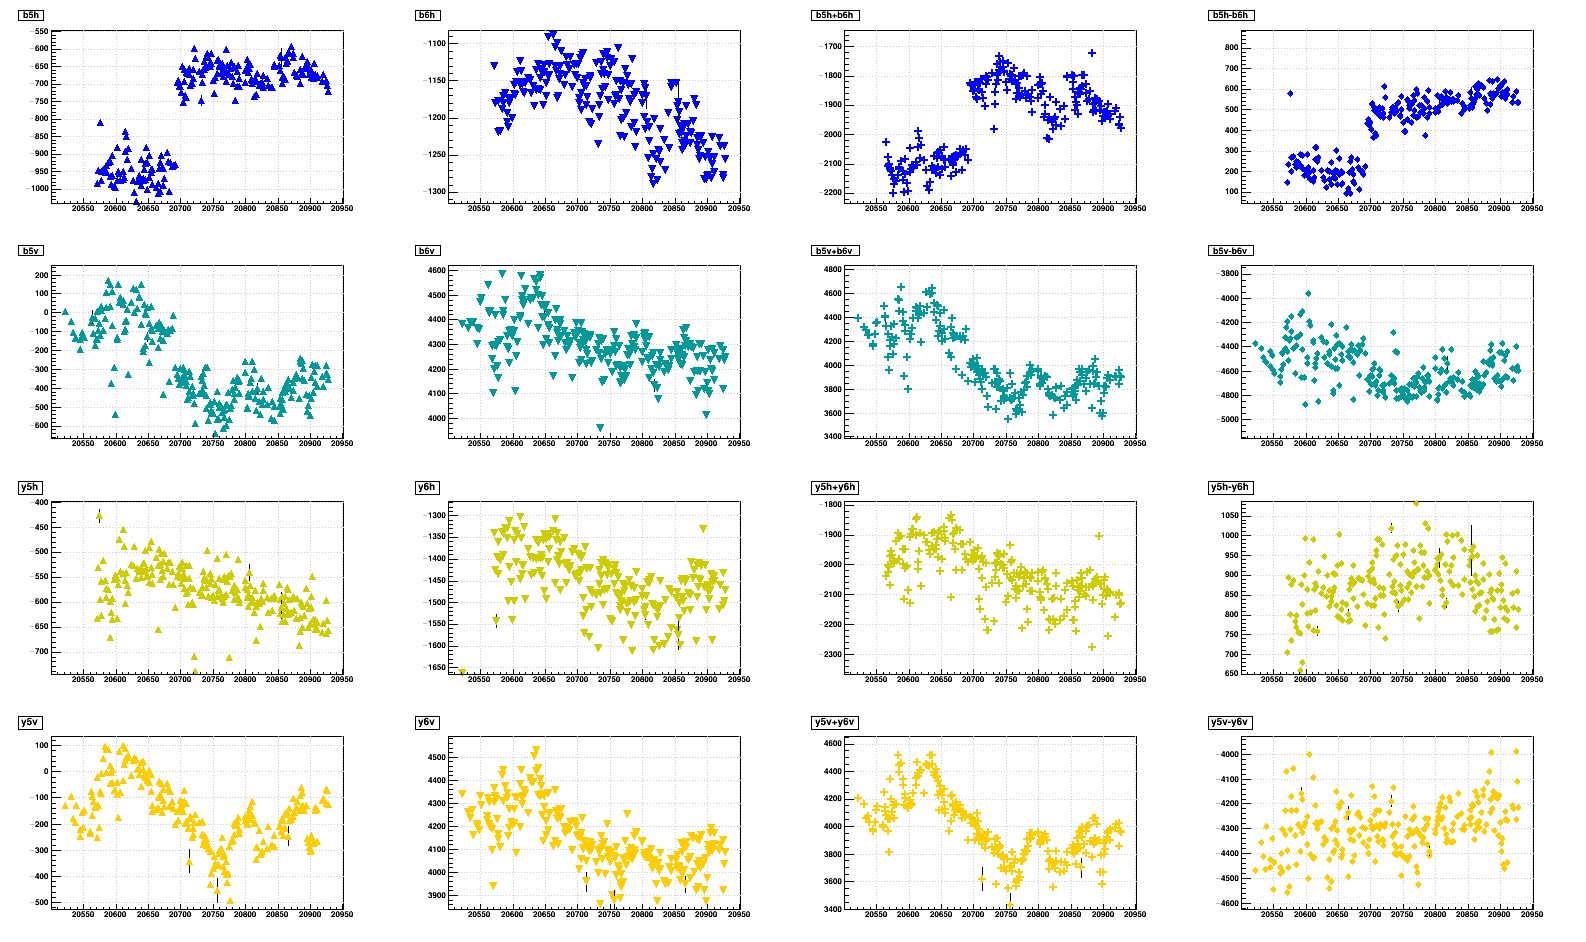
Pre-β*-squeeze:
Post-β*-squeeze:
Unfortunately, again, I see nothing that is a clear correlation with Jae's +/- ratios. The slightest hint might be in the yellow horizontal sums. Here is a closer look at that correlation, where the blue markers are a binned profile of the yellow-green marker data:
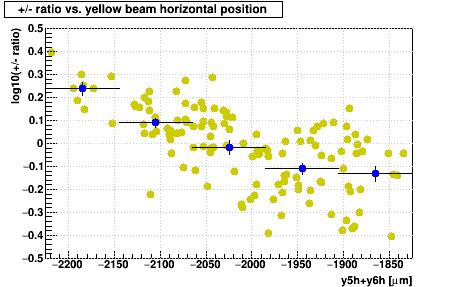
While the correlation may be real, it is not tight and isn't convincingly causal. For example, around a yellow beam horizontal position sum of -1900 μm, the +/- ratio spans the range [0.4,1.4] (note again that the plot above shows log10 of the +/- ratio). Alternatively, for a +/- ratio of 1.0, the beam position sum spans roughly [-2100,-1850] μm. Using this particular beam position data to decide a correction would unlikely go far enough.
Further arguing against the value of this particular correlation is that within fills 20649 and 20654 shown earlier, the yellow beam horizontal position sum varied over the range [-2020,-1820] μm, yet within those fills each run's +/- ratio did not vary by the degree that the above-seen correlation implies: the large scale correlation is not seen on the small scale. Here are plots of the +/- ratio vs. pT for the runs in those two fills, and the value at pT = 9 GeV/c, showing how clearly different the two fills are from each other, and that within the fill there is very little variation:
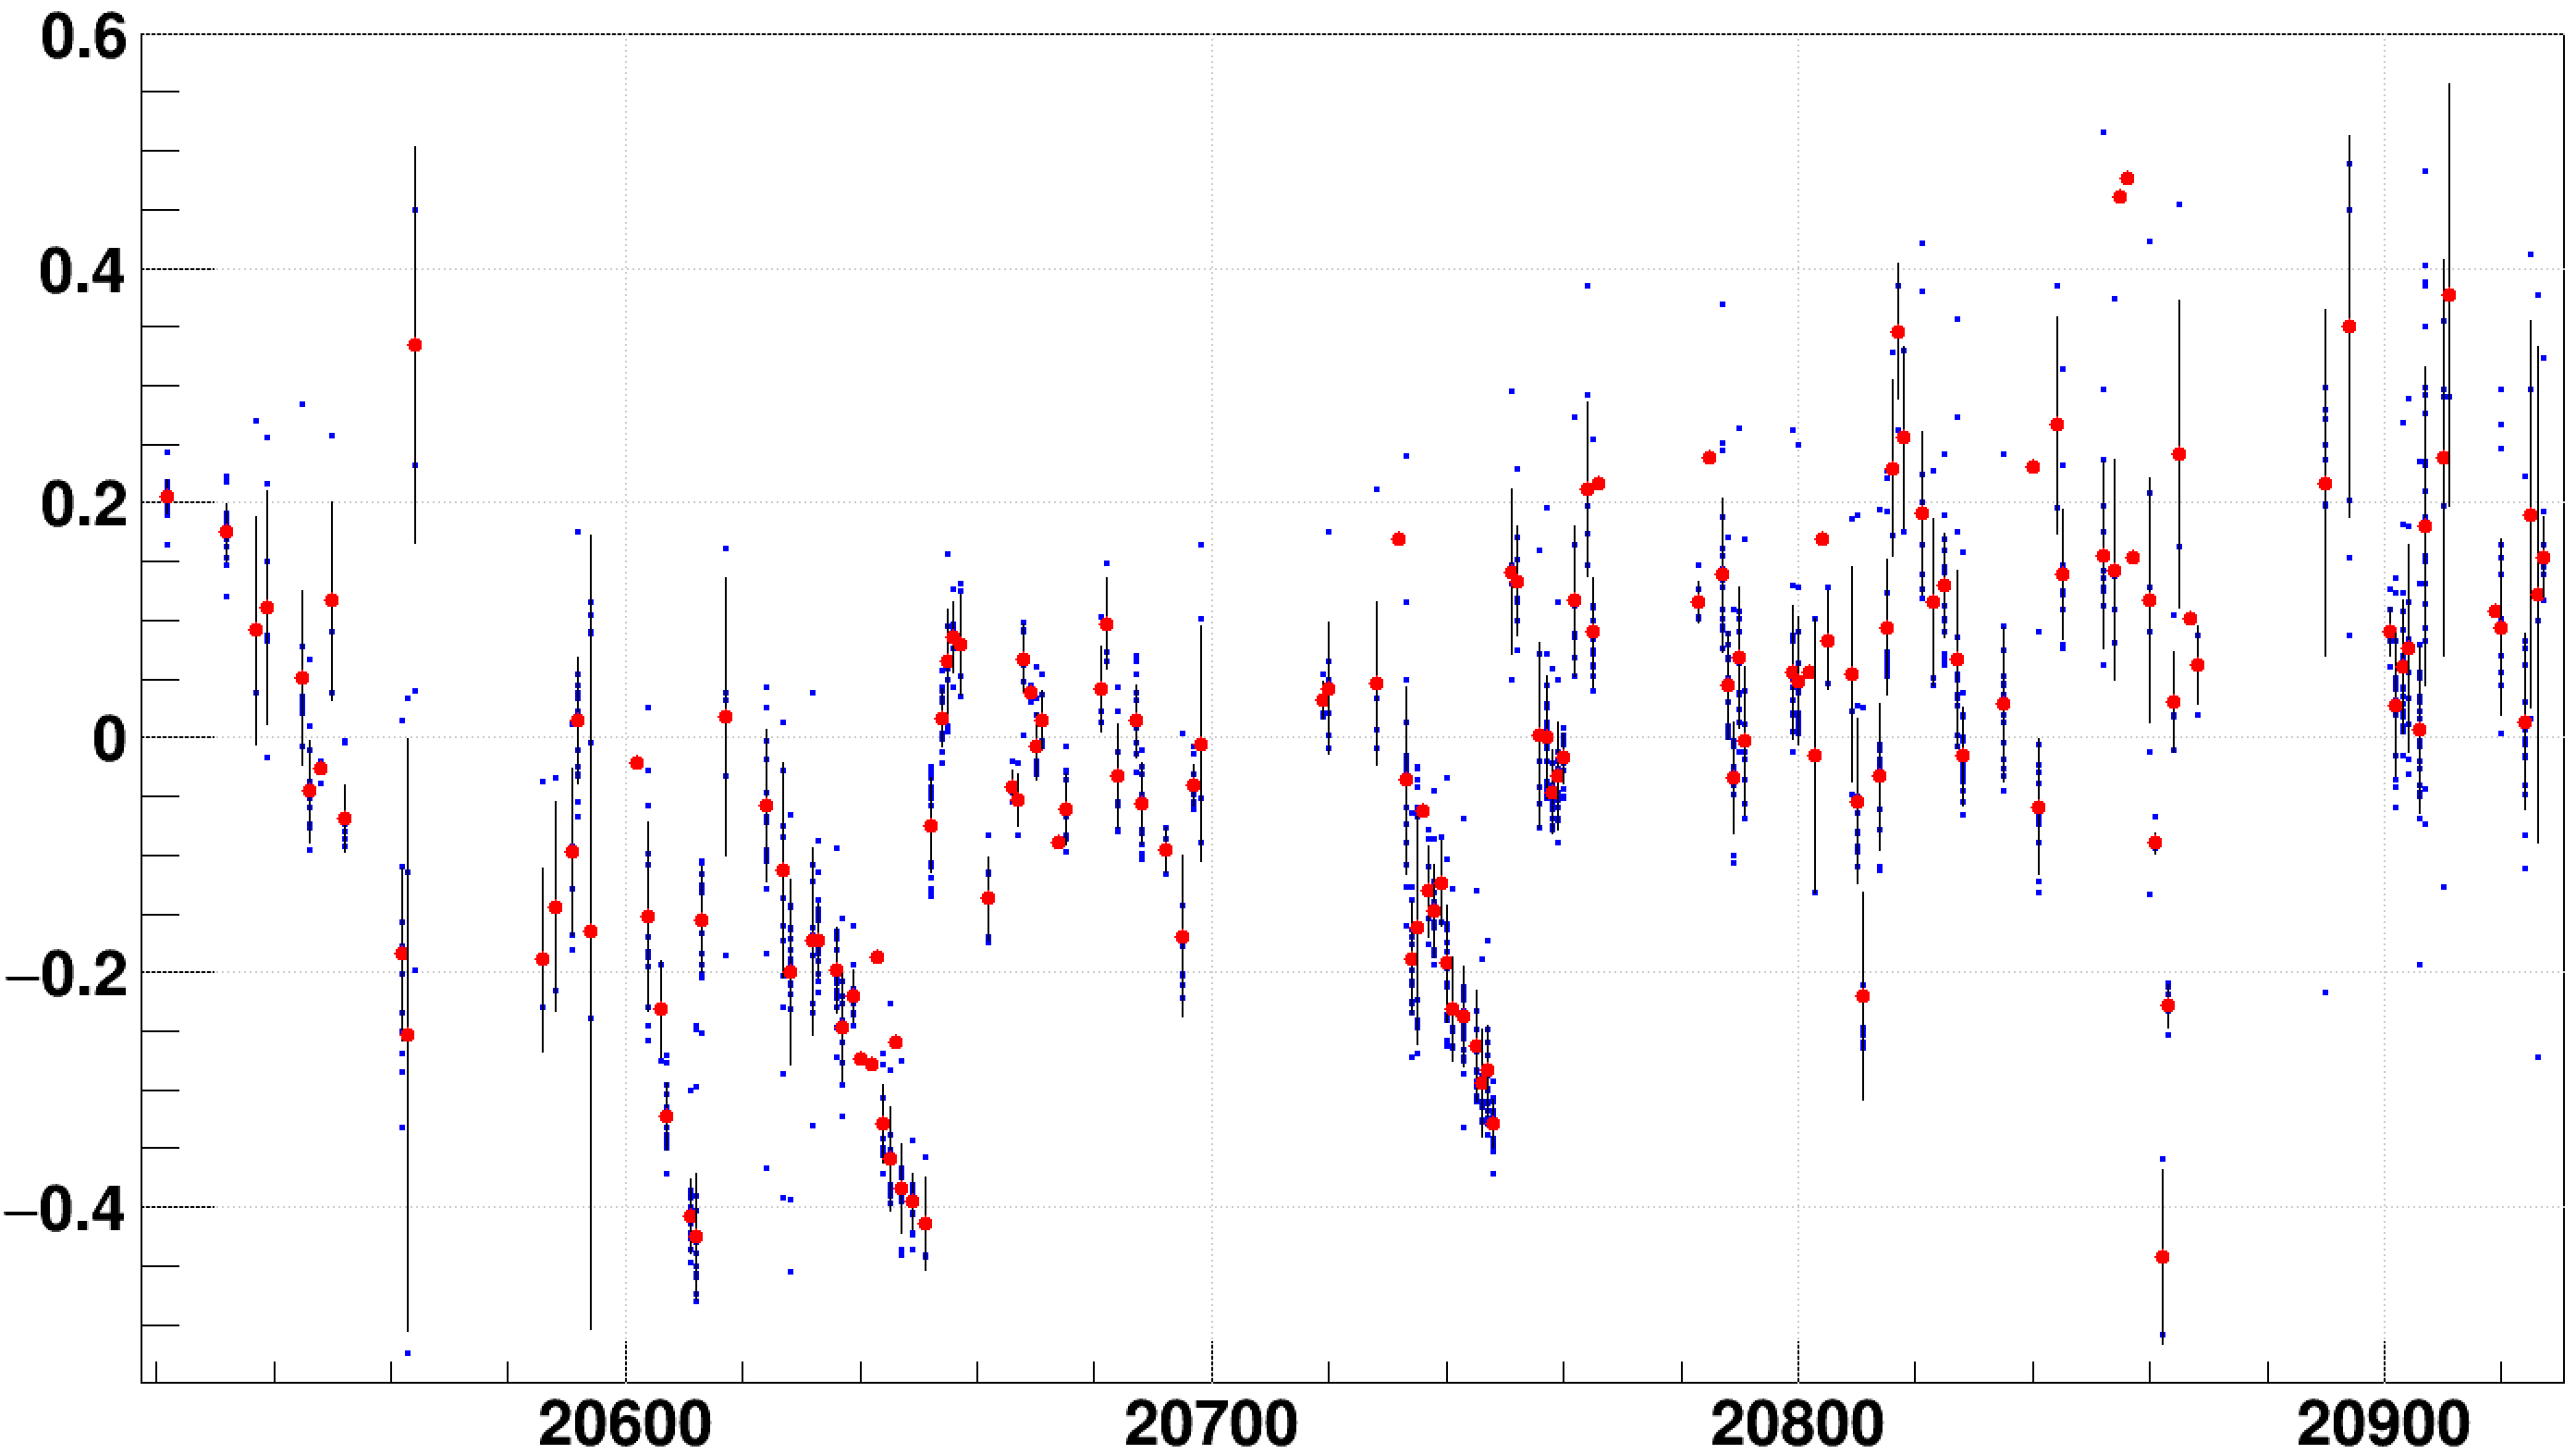
Another way to see how tightly grouped withn fills each run's +/- ratio is (i.e. how much of a fill-by-fill fluctuation this is instead of a run-by-run fluctuation), I plot here the individual runs' log10(+/- ratio) vs. run in blue along with the profile with error bars representing the spread in red (open in the image in a new tab/window to see more detail):
(Note: I zoomed in so the individual fills' runs could be more clearly seen, but this mean pushing fill 20807 off the bottom of the plot; its 4 runs 18116002-18116005 are all very well clustered near ~log10(0.11) = ~-0.95)
The runs in some fills are more tightly grouped than in others, so it isn't 100% clear that the fluctuations are fill by. fill vs. simply trending in time.
-Gene
To begin, here is a metric of the fill-by-fill ratio determined using data provided by Jae Nam. I fit a simple exponential to the ratio (equivalent to a 1st order polynomial to the log of the ratio) over the pT range [3.0,15.0] GeV/c, using the value of the function at 9.0 GeV/c as its magnitude parameter so that I would get that value directly with an error. I then plotted log10 of that ratio value vs. fill for the three cases Jae examined: without PID cuts, with pion PID cuts, and with electron PID cuts, only for those fills where the error on the ratio was less than 0.1, to avoid cluttering the plot. The general trends are present in all three:
As a highlight, fills 20649 and 20654 show very clear differences while being recorded with very nearly the same luminosity:
(note: this table is the +/- ratio, not log10 of that ratio as shown in the above plot)
| Fill | No PID cuts | Pions | Electrons |
|---|---|---|---|
| 20649 | 0.425±0.002 | 0.535±0.003 | 0.495±0.028 |
| 20654 | 1.039±0.005 | 1.068±0.007 | 0.995±0.058 |
The beam positions in these two fills using C-AD's Beam Position Monitors (BPMs) is shown below versus unix time [sec], where the 4 rows are (from top to bottom):
- Blue beam horizontal positions
- Blue beam vertical positions
- Yellow beam horizontal positions
- Yellow beam vertical positions
- Location 5 (on one side of STAR; I don't remember which)
- Location 6 (on the other side of STAR)
- The sum of locations 5 and 6
- The difference of locations 5 and 6
My own thoughts are that there are no clear smoking guns in the above that one might associate with the +/- ratio differences between those two fills.
For a more complete picture, I show below three additional sets of data where I plot versus fill number over the range of fills in Jae's analysis (I have not been careful to exclude fills within that range that were not included in his analysis), taking the mean position for each entire fill. The first 16-plot set in each pair is showing all data, while the second 16-plot set in each pair has the vertical axis zoomed in on the bulk of the data (I did this by-hand) to help look at any trends that may match the +/- ratio data shown earlier. There are three pairs of 16-plot sets: the first plot set pair shows entire fills, while the second and third plot set pairs show the "pre-β*-squeeze" portion of the fills' data, and the "post-β*-squeeze" portion (which is determinable from the "beam state" in the BPM data) respectively.
Entire fills:
Pre-β*-squeeze:
Post-β*-squeeze:
Unfortunately, again, I see nothing that is a clear correlation with Jae's +/- ratios. The slightest hint might be in the yellow horizontal sums. Here is a closer look at that correlation, where the blue markers are a binned profile of the yellow-green marker data:
While the correlation may be real, it is not tight and isn't convincingly causal. For example, around a yellow beam horizontal position sum of -1900 μm, the +/- ratio spans the range [0.4,1.4] (note again that the plot above shows log10 of the +/- ratio). Alternatively, for a +/- ratio of 1.0, the beam position sum spans roughly [-2100,-1850] μm. Using this particular beam position data to decide a correction would unlikely go far enough.
Further arguing against the value of this particular correlation is that within fills 20649 and 20654 shown earlier, the yellow beam horizontal position sum varied over the range [-2020,-1820] μm, yet within those fills each run's +/- ratio did not vary by the degree that the above-seen correlation implies: the large scale correlation is not seen on the small scale. Here are plots of the +/- ratio vs. pT for the runs in those two fills, and the value at pT = 9 GeV/c, showing how clearly different the two fills are from each other, and that within the fill there is very little variation:
| fill | +/- ratio vs. pT, all runs in fill | run | +/- ratio at pT=9 GeV/c |
|---|---|---|---|
| 20649 | 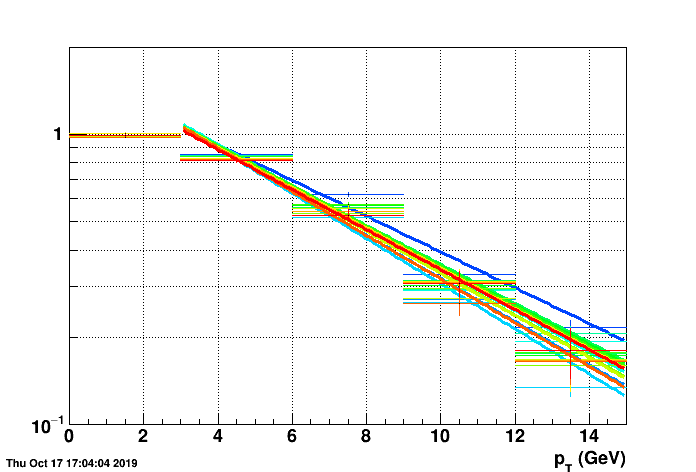 |
18078067 | 0.454±0.006 |
| 18079001 | 0.379±0.005 | ||
| 18079002 | 0.366±0.006 | ||
| 18079003 | 0.406±0.013 | ||
| 18079004 | 0.414±0.006 | ||
| 18079005 | 0.416±0.006 | ||
| 18079006 | 0.412±0.006 | ||
| 18079007 | 0.413±0.006 | ||
| 18079008 | 0.393±0.005 | ||
| 18079009 | 0.392±0.006 | ||
| 18079010 | 0.406±0.019 | ||
| 18079013 | 0.404±0.007 | ||
| 18079015 | 0.378±0.015 | ||
| 18079016 | 0.401±0.018 | ||
| 20654 | 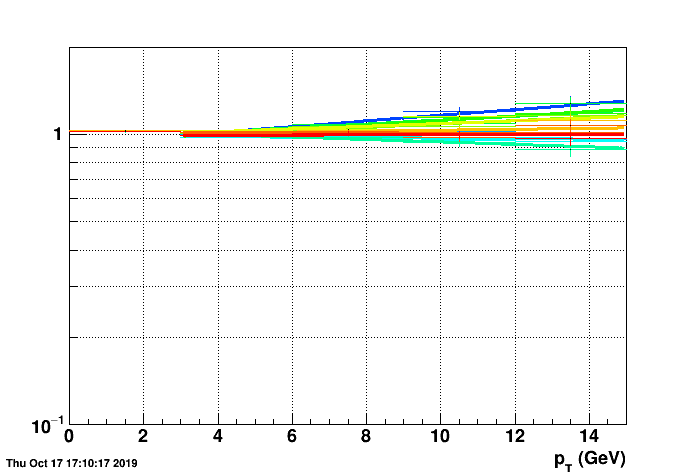 |
18079061 | 1.140±0.017 |
| 18079062 | 1.008±0.015 | ||
| 18080001 | 0.974±0.012 | ||
| 18080002 | 0.952±0.013 | ||
| 18080003 | 1.104±0.014 | ||
| 18080004 | 1.098±0.016 | ||
| 18080006 | 1.073±0.014 | ||
| 18080007 | 1.080±0.014 | ||
| 18080008 | 1.032±0.015 | ||
| 18080009 | 1.013±0.014 | ||
| 18080010 | 0.998±0.013 | ||
Another way to see how tightly grouped withn fills each run's +/- ratio is (i.e. how much of a fill-by-fill fluctuation this is instead of a run-by-run fluctuation), I plot here the individual runs' log10(+/- ratio) vs. run in blue along with the profile with error bars representing the spread in red (open in the image in a new tab/window to see more detail):
(Note: I zoomed in so the individual fills' runs could be more clearly seen, but this mean pushing fill 20807 off the bottom of the plot; its 4 runs 18116002-18116005 are all very well clustered near ~log10(0.11) = ~-0.95)
The runs in some fills are more tightly grouped than in others, so it isn't 100% clear that the fluctuations are fill by. fill vs. simply trending in time.
-Gene
»
- genevb's blog
- Login or register to post comments