- genevb's home page
- Posts
- 2025
- 2024
- 2023
- 2022
- September (1)
- 2021
- 2020
- 2019
- 2018
- 2017
- December (1)
- October (3)
- September (1)
- August (1)
- July (2)
- June (2)
- April (2)
- March (2)
- February (1)
- 2016
- November (2)
- September (1)
- August (2)
- July (1)
- June (2)
- May (2)
- April (1)
- March (5)
- February (2)
- January (1)
- 2015
- December (1)
- October (1)
- September (2)
- June (1)
- May (2)
- April (2)
- March (3)
- February (1)
- January (3)
- 2014
- 2013
- 2012
- 2011
- January (3)
- 2010
- February (4)
- 2009
- 2008
- 2005
- October (1)
- My blog
- Post new blog entry
- All blogs
Run 20 BMM potential issues
Updated on Wed, 2020-03-18 14:10. Originally created by genevb on 2020-03-18 13:42.
More text to come later...
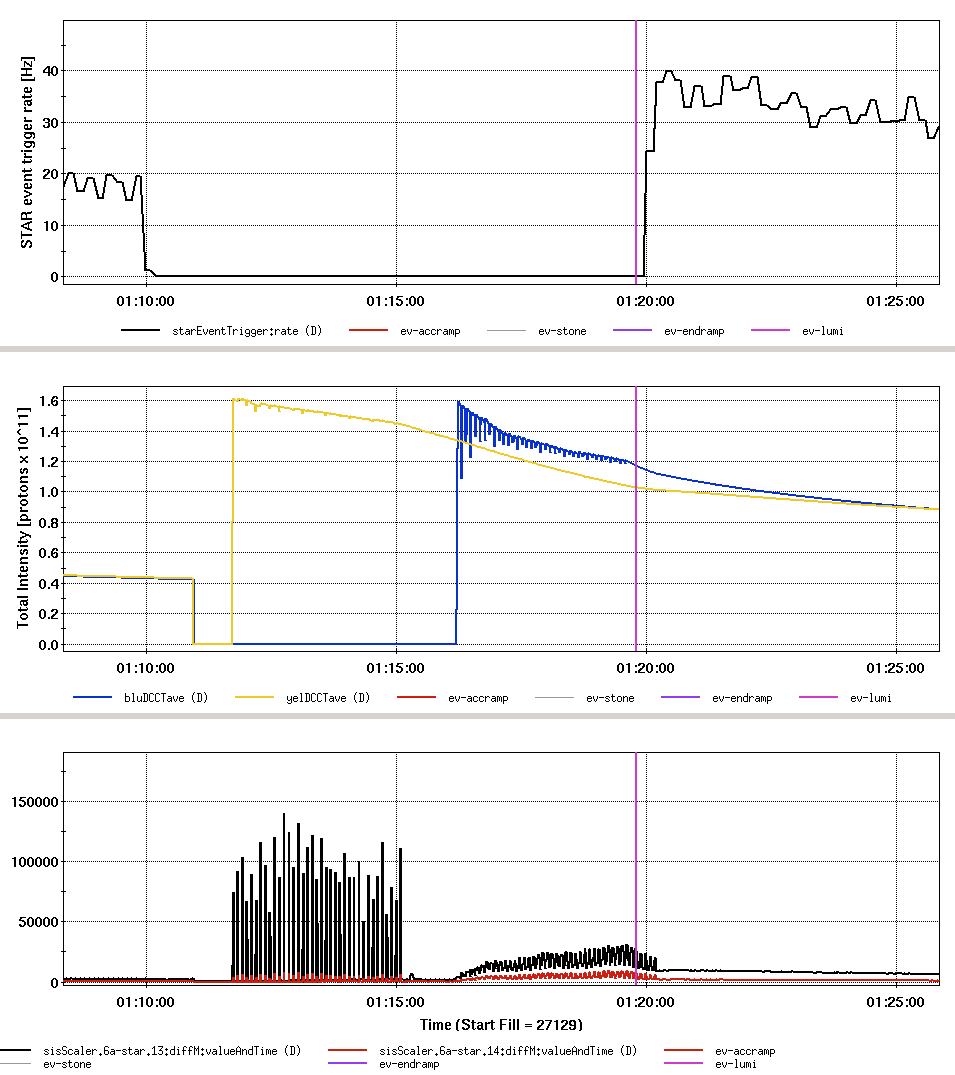
Some plots from JH Lee just as the beginning of run 21076004:
Top: HLT rate
Middle: intensity
Bottom: BBC singles
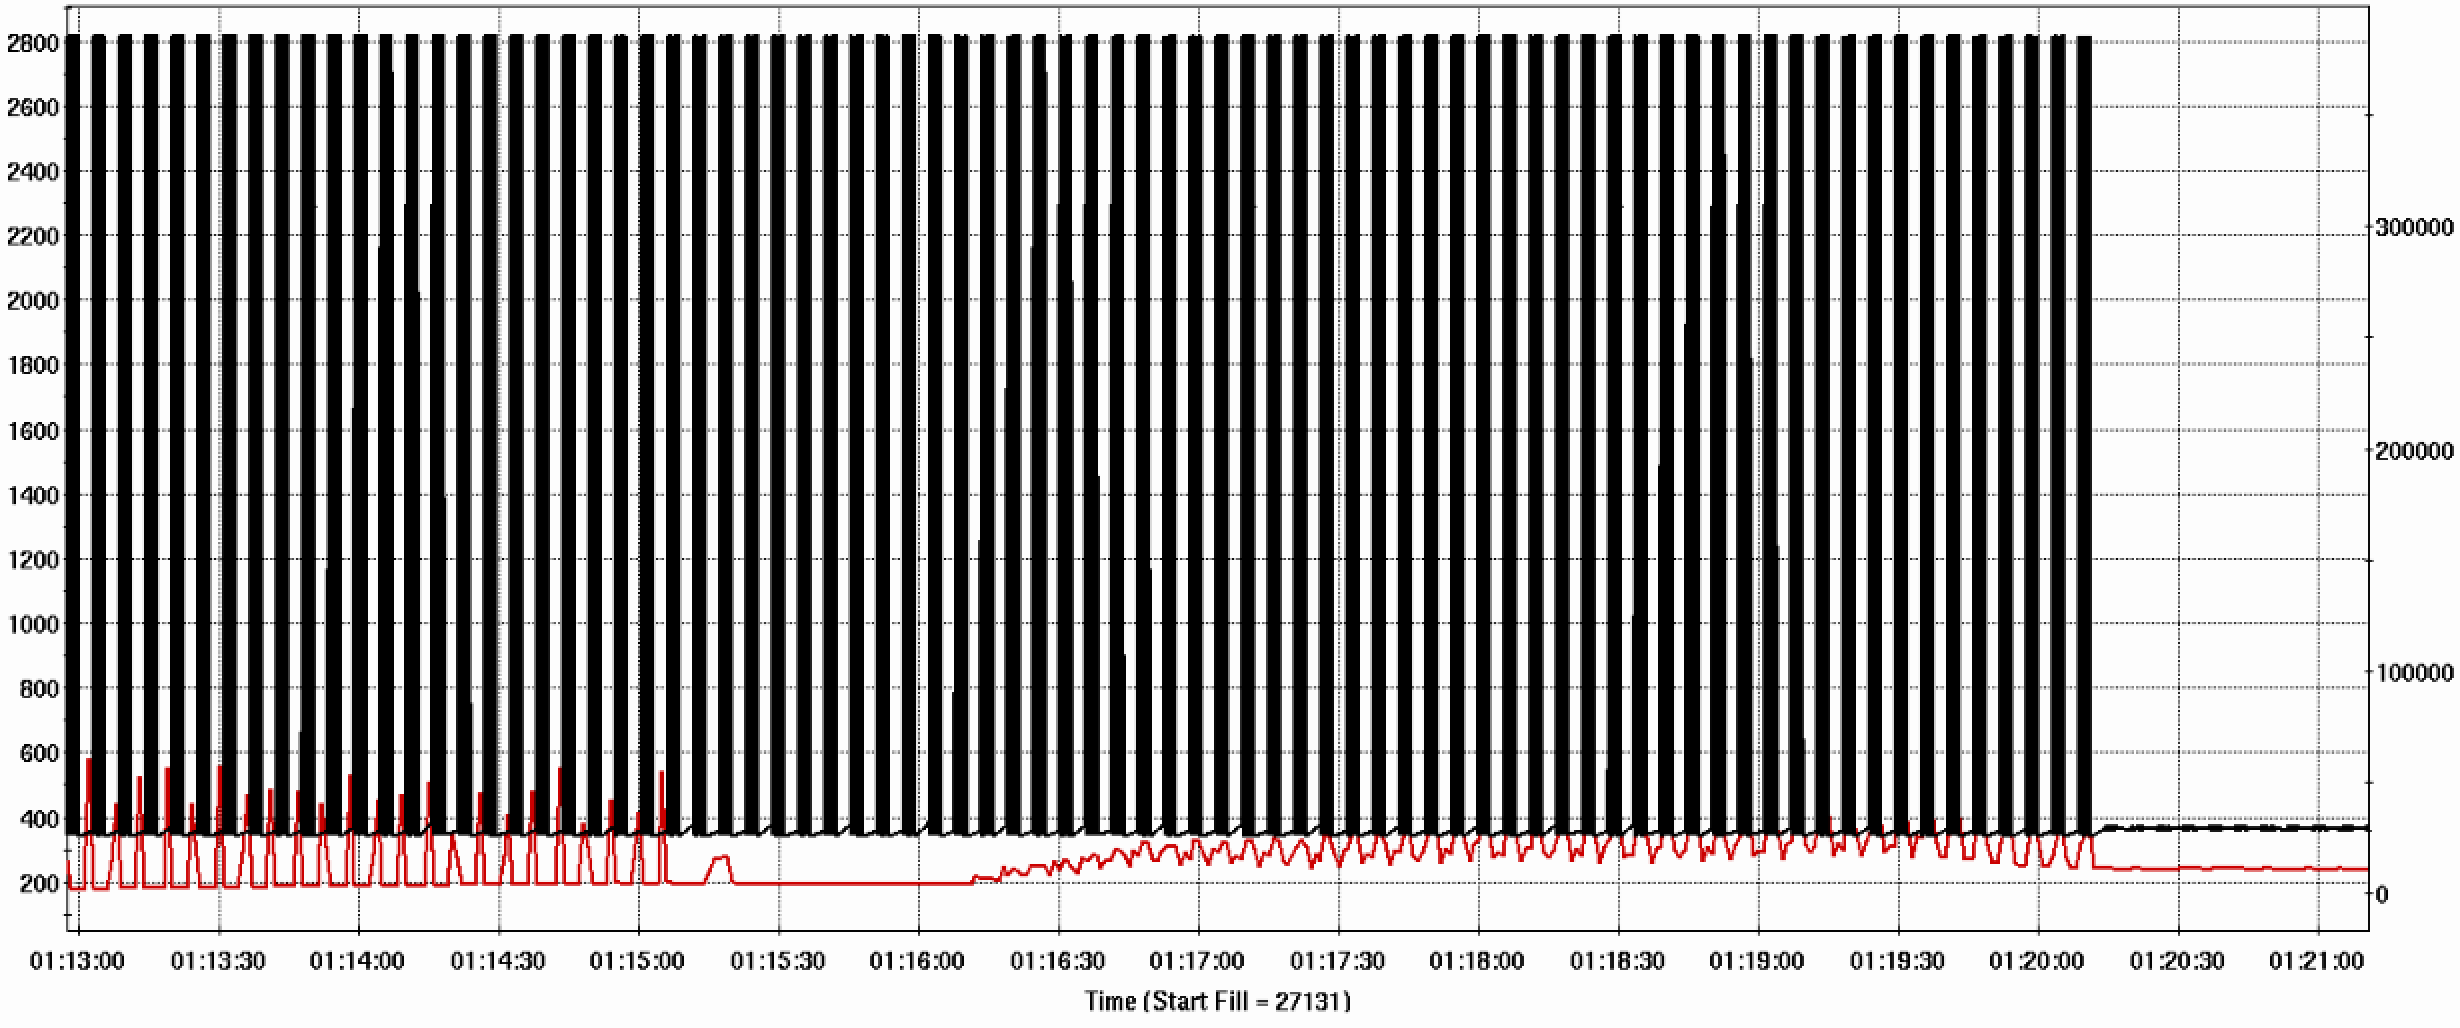
The next plot is by me (Gene) from about the same time, with black showing the BMM currents, and red showing one of the RICH scalers (I think it's one of the BBC singles as JH has shown).
_____________
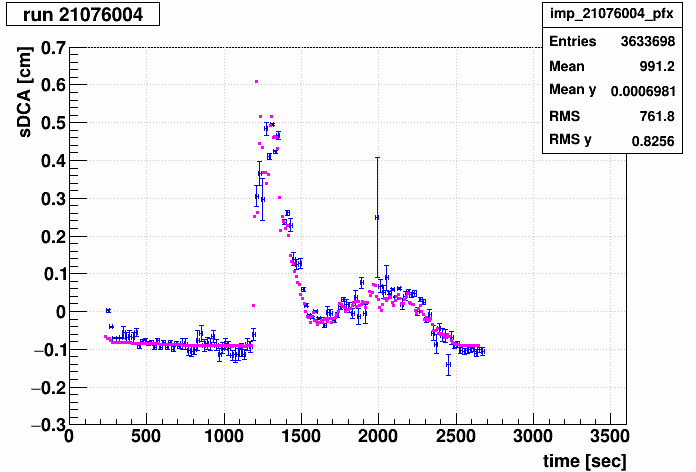
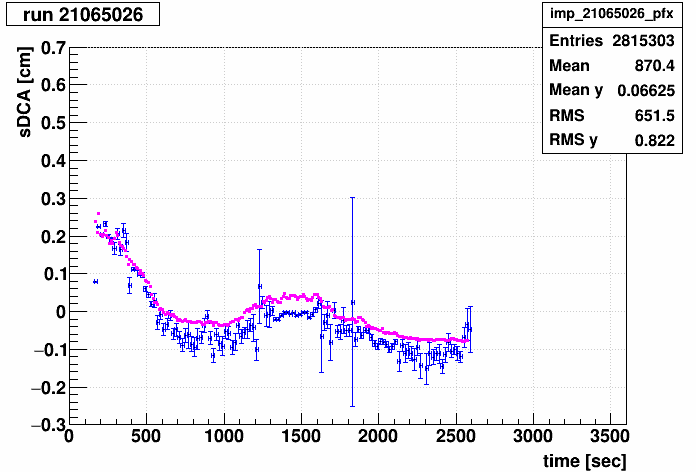
Some example run-by-run sDCAs (blue, in 20-second-wide bins) and scaled BBC coincidence rates (magenta = bbcx*0.6/7000.0 - 0.1) vs. time after the run starts:
(note: I used a crude method to match the time axis between the two datasets, so there may be an offset here that is a failure of my method, not a real offset in time)
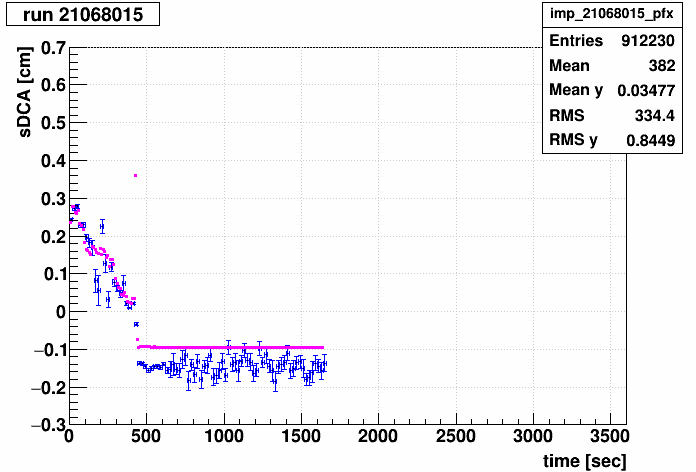

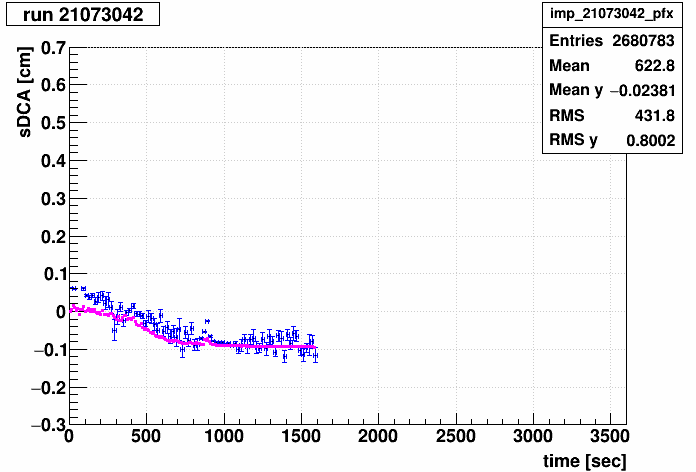
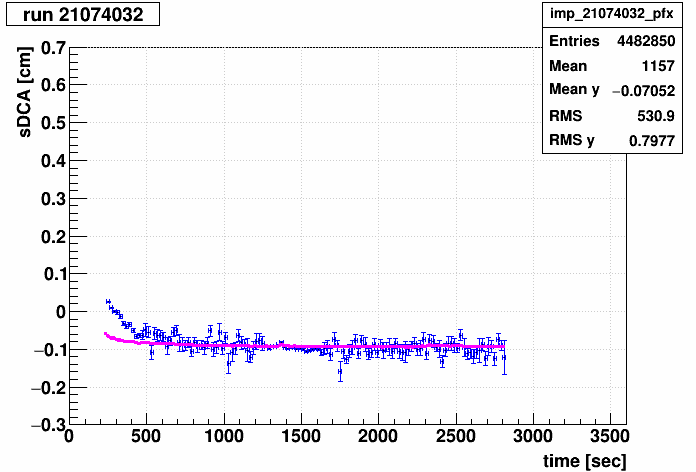
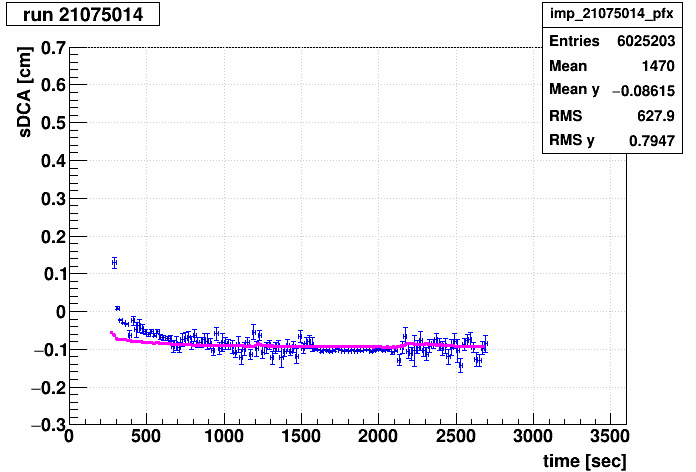
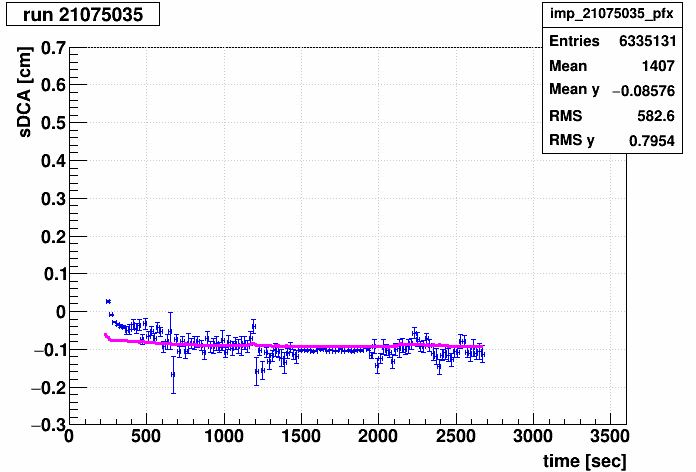
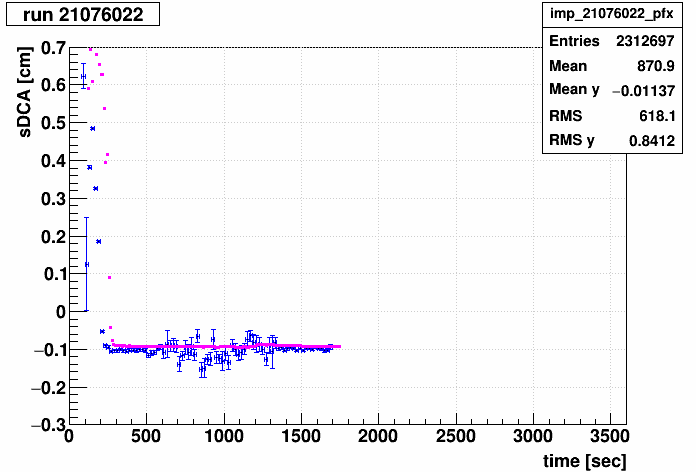
-Gene
Some plots from JH Lee just as the beginning of run 21076004:
Top: HLT rate
Middle: intensity
Bottom: BBC singles
The next plot is by me (Gene) from about the same time, with black showing the BMM currents, and red showing one of the RICH scalers (I think it's one of the BBC singles as JH has shown).
_____________
Some example run-by-run sDCAs (blue, in 20-second-wide bins) and scaled BBC coincidence rates (magenta = bbcx*0.6/7000.0 - 0.1) vs. time after the run starts:
(note: I used a crude method to match the time axis between the two datasets, so there may be an offset here that is a failure of my method, not a real offset in time)
-Gene
»
- genevb's blog
- Login or register to post comments